
Enabling Cloud Monitoring using Local Collector
Last updated on 16 January, 2024Adding a Local Collector to your AWS, Azure, or GCP platform provides the most detailed access to important data about your AWS EC2 instances, Azure VMs, and GCP compute engine instances. Installing a Local Collector allows you to collect full OS and application-level metrics within your cloud infrastructure.
LogicMonitor collects health metrics for cloud servers from CloudWatch, Azure Monitor, and Stackdriver APIs, However, installing a Local Collector provides a full and comprehensive view of cloud server health by supplementing this API data with full OS and Application metrics.
Requirements to install a local Collector
This assumes that you have already added the AWS, Azure, GCP environment to monitoring through the Cloud API. For more information, see LM Cloud Monitoring Overview.
You can install a LogicMonitor Collector within your AWS, Azure, or GCP environment to collect non-AWS, Azure, or GCP API data such as operating systems and application-level metrics.
Follow these steps to install a local Collector:
- Create the necessary compute resources in your cloud environment. Use EC2 instances for AWS, Virtual Machines in Azure, and Compute Engines in GCP.
- See Recommended Cloud Specifications for minimum resource specifications to support a local Collector.
- There must be at least one collector per CSP account, one per region, and one per VPC. Linux collectors can monitor linux devices and windows collectors monitor windows and linux devices.
- The security policy needs to allow ssh and/or SNMP communication.
- Install the local Collector onto the cloud environment you created. For more information, see Installing Collectors.
- Once you install the Collector, proceed to Enabling monitoring using a local Collector.
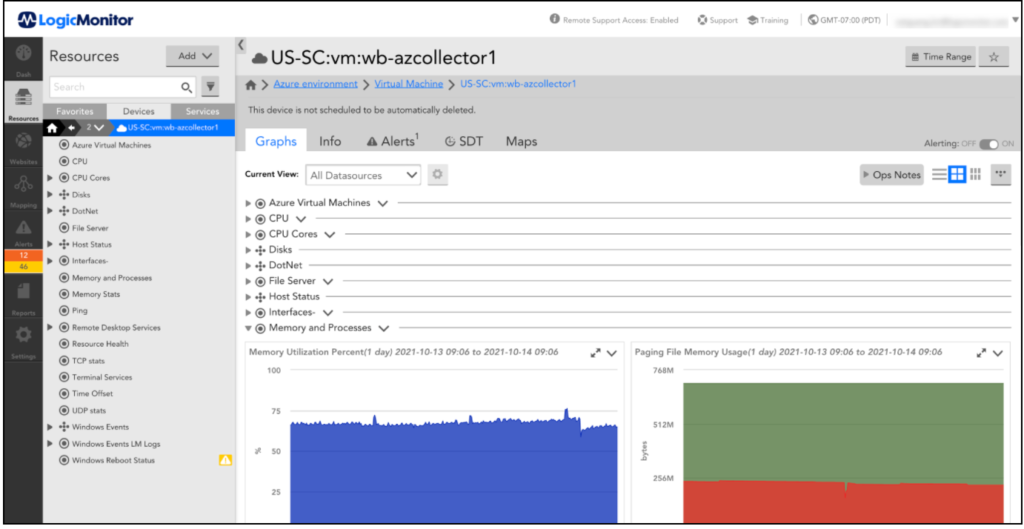
Once you have installed the LogicMonitor Collector, you can access the LogicMonitors LogicModule library for your cloud resources, including DataSources, EventSources, PropertySource, and so on. The specific data for CloudWatch, Azure Monitor, and Stackdriver will continue to be collected via LogicMonitor Collector.
You can view the data collected by the LogicMonitor Collector alongside the CloudWatch, Azure Monitor, and GCP Stackdriver data.
Enabling monitoring using a local Collector
To enable monitoring using a local collector, complete the following steps:
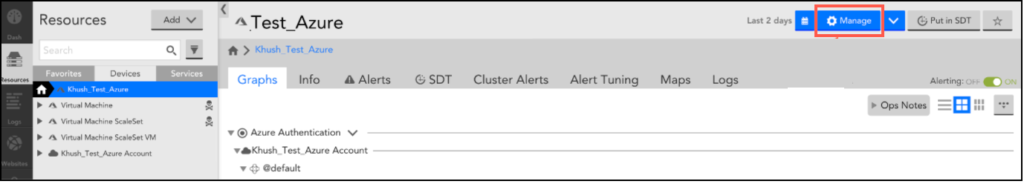
1. Navigate to Resources and select Manage for your AWS / Azure / GCP account.
Note: You can follow these steps while adding a cloud account.
2. On the top-right corner, click Manage.
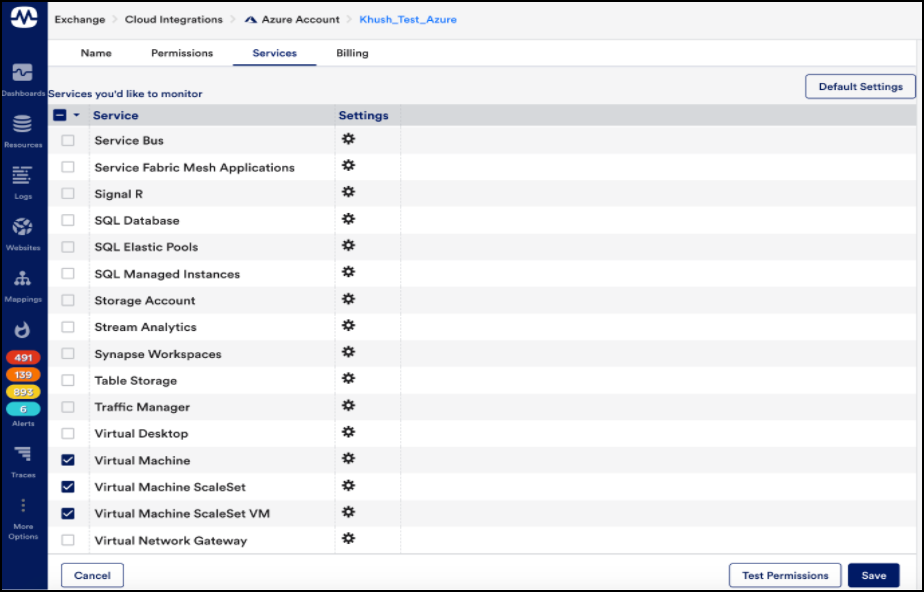
3. On the Cloud Integrations page, click the Services tab.
4. Select the required services from the list and click the Settings Gear icon.
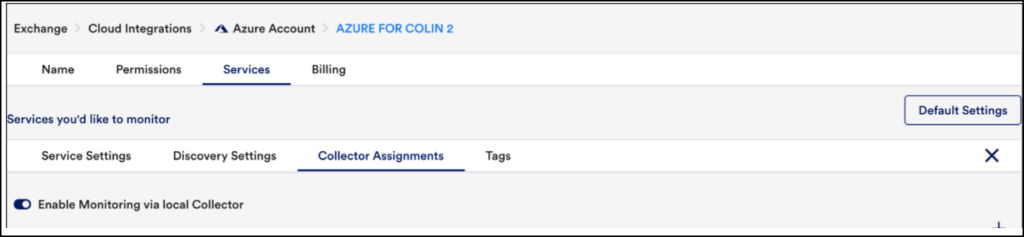
5. On the Settings page, click the Collector Assignments tab.
6. Toggle the Enable Monitoring via local Collector option to enable the monitoring.
7. In the Collector Assignments section, on the top-right corner, click the + icon, to add the collector.
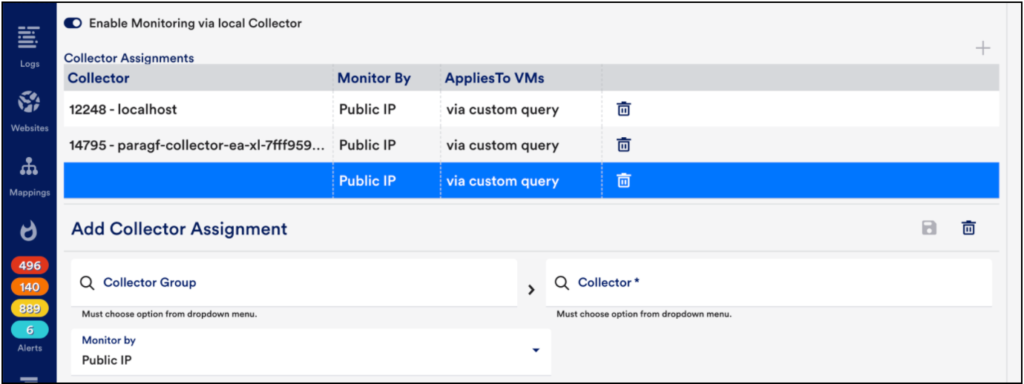
The collector assignments will map Collectors to the EC2 instances, VMs, or Compute Engine instances they should monitor. You can assign Collectors based on EC2, VM, or Compute Engine properties like AWS region or VPC, Azure subnet, or a custom tag. You may also want to add a condition to exclude stopped instances from getting a collector assignment to avoid receiving alerts for DataSources like Ping – you can add ‘&& system.aws.stateName != “stopped”’ to an existing query.
Note: Currently, you can only use properties starting with system.aws, system.azure, and system.gcp.
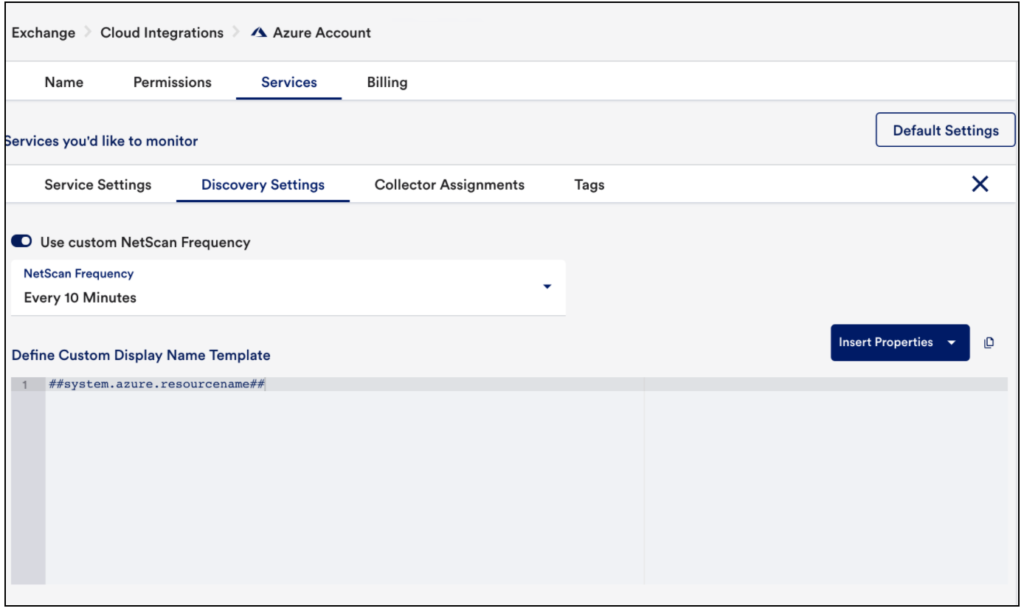
8. (Optional) You can click the Discovery Settings tab and toggle the Use custom NetScan Frequency option to enable more frequent discovery for the EC2 / VM / Compute Engine service. Enabling this option will allow you to configure LogicMonitor to check for new EC2 / VM / Compute Engine instances up to every 10 minutes (more frequent than the default frequency for all services, which has a minimum of 1 hour). This frequency will only apply to the EC2 / VM / Compute Engine service.
9. Save your changes.
After saving, the system.sysinfo property will be automatically populated for the EC2 instances / VMs / Compute Engine instances to which you assigned a Collector, and LogicMonitor DataSources will apply accordingly. The assigned Collectors will run Active Discovery for these DataSources, and you should see instances and data shortly thereafter:
Recommended Cloud Specifications
Use the following table to choose cloud resources that meet the requirements for every size of Collector. See the specifications provided by each cloud provider for resource types that meet the installation requirements.
| Protocol | Small Collector | Medium Collector | Large Collector | Extra Large (XL) Collector | Double Extra Large (XXL) Collector |
| N/A | CPU: 1 Intel Xeon FamilySystem Memory: 2GiBJVM maximum memory: 1GiB | CPU: 2 Intel Xeon E5-2680v2 2.8GHzSystem Memory: 4GiBJVM maximum memory: 2GiB | CPU: 4 Intel Xeon E5-2680v2 2.8GHzSystem Memory: 8GiBJVM maximum memory: 4GiB | CPU: 8System Memory: 16GiBJVM maximum memory: 8GiB | CPU: 16System Memory: 32GiBJVM maximum memory: 16GiB |
| SNMP v2c(Linux) | 300 standard devices76 RPS | 1000 standard devices256 RPS | 4000 standard devices1024 RPS | 8000 standard devices2048 RPS | 15000 standard devices3840 RPS |
| SNMP v3 | 855 standard devices220 RPS | 1087 standard devices278 RPS | 1520 standard devices390 RPS | 2660 standard devices682 RPS | 4180 standard devices1074 RPS |
| HTTP | 320 standard devices160 RPS | 1400 standard devices735 RPS | 2400 standard devices1260 RPS | 4500 standard devices2000 RPS | 7500 standard devices3740 RPS |
| WMI | 211 standard devices77 RPS | 287 standard devices102 RPS | 760 standard devices272 RPS | 1140 standard devices409 RPS | 1330 standard devices433 RPS |
| BatchScript | 94 standard devices5 RPS | 124 standard devices7 RPS | 180 standard devices11 RPS | 295 standard devices17 RPS | 540 standard devices32 RPS |
| Perfmon | 200 standard devices87 RPS | 400 standard devices173 RPS | 800 standard devices347 RPS | TBA | TBA |
| JMX | 1000 standard devices416 RPS | 2500 standard devices1041 RPS | 5000 standard devices2083 RPS | TBA | TBA |
| Syslog | TBD | 500 EPS(assuming event size of 100-200 bytes) | 2500 EPS(assuming event size of 100-200 bytes) | 4000 EPS(assuming event size of 100-200 bytes) | 7000 EPS(assuming event size of 100-200 bytes) |
Frequently Asked Questions
What happens if I disable the monitoring via a local Collector?
If you disable monitoring via local Collector after it has already been enabled, any data collected by the local Collector will be deleted. CloudWatch/Azure Monitor/Stackdriver metric collection will continue being collected by a LogicMonitor maintained Collector.
What happens if my EC2 instances have two IP addresses?
LogicMonitor will use the first private IP address listed. You can override this assignment by setting a resource property cloud.primaryIP with the IP address you want LogicMonitor to collect data from.
What happens if an EC2 instance matches two Collector assignments?
The last assignment will take priority.
What happens if I unselect a region for monitoring the EC2 service?
If you configure the EC2 instances that no longer match to be deleted, they will be deleted according to schedule.
If you do not configure the EC2 instances to be deleted, but the instances no longer match the criteria in the EC2 service settings, CloudWatch data collection will stop and local Collector-based data collection will continue (assuming a local Collector was assigned and the ‘enable monitoring via local Collector’ option is still enabled).
Will I be billed twice if I enable local collector monitoring for a cloud device?
No. When local collector monitoring is enabled for a device, the device is charged as an IaaS device. The CSP API metrics and Collector metrics are included in that price.