At LogicMonitor, we manage vast quantities of time series data, processing billions of metrics, events, and configurations daily. As part of our transition from a monolithic architecture to microservices, we chose Quarkus—a Kubernetes-native Java stack—for its efficiency and scalability. Built with the best-of-breed Java libraries and standards, Quarkus is designed to work seamlessly with OpenJDK HotSpot and GraalVM.
To monitor our microservices effectively, we integrated Micrometer, a vendor-agnostic metrics instrumentation library for JVM-based applications. Micrometer simplifies the collection of both JVM and custom metrics, helping maximize portability and streamline performance monitoring across our services.
In this guide, we’ll show you how to integrate Quarkus with Micrometer metrics, offering practical steps, code examples, and best practices. Whether you’re troubleshooting performance issues or evaluating these tools for your architecture, this article will help you set up effective microservice monitoring.
Key takeaways


How Quarkus and Micrometer work together
Quarkus offers a dedicated extension that simplifies the integration of Micrometer, making it easier to collect both JVM and custom metrics. This extension allows you to quickly expose application metrics through representational state transfer (REST) endpoints, enabling real-time monitoring of everything from Java Virtual Machine (JVM) performance to specific microservice metrics. By streamlining this process, Quarkus and Micrometer work hand-in-hand to deliver a powerful solution for monitoring microservices with minimal setup.
// gradle dependency for the Quarkus Micrometer extension
implementation 'io.quarkus:quarkus-micrometer:1.11.0.Final'
// gradle dependency for an in-memory registry designed to operate on a pull model
implementation 'io.micrometer:micrometer-registry-prometheus:1.6.3'
What are the two major KPIs of our metrics processing pipeline?
For our metrics processing pipeline, our two major KPIs (Key Performance Indicators) are the number of processed messages and the latency of the whole pipeline across multiple microservices.
We are interested in the number of processed messages over time in order to detect anomalies in the expected workload of the application. Our workload is variable across time but normally follows predictable patterns. This allows us to detect greater than expected load, react accordingly, and proactively detect potential data collection issues.
In addition to the data volume, we are interested in the pipeline latency. This metric is measured for all messages from the first ingestion time to being fully processed. This metric allows us to monitor the health of the pipeline as a whole in conjunction with microservice-specific metrics. It includes the time spent in transit in Kafka clusters between our different microservices. Because we monitor the total processing duration for each message, we can report and alert on average processing time and different percentile values like p50, p95, and p999. This can help detect when one or multiple nodes in a microservice along the pipeline are unhealthy. The average processing duration across all messages might not change much, but the high percentile (p99, p999) will increase, indicating a localized issue.
In addition to our KPIs, Micrometer exposes JVM metrics that can be used for normal application monitoring, such as memory usage, CPU usage, garbage collection, and more.
Using Micrometer annotations
Two dependencies are required to use Micrometer within Quarkus: the Quarkus Micrometer dependency and Micrometer Registry Prometheus. Quarkus Micrometer provides the interfaces and classes needed to instrument codes, and Micrometer Registry Prometheus is an in-memory registry that exposes metrics easily with rest endpoints. Those two dependencies are combined into one extension, starting with Quarkus 1.11.0.Final.
Micrometer annotations in Quarkus produce a simple method to track metric names across different methods. Two key annotations are:
- @Timed: Measures the time a method takes to execute.
- @Counted: Tracks how often a method is called.
This, however, is limited to methods in a single microservice.
@Timed(
   value = "processMessage",
   description = "How long it takes to process a message"
)
public void processMessage(String message) {
   // Process the message
}
It is also possible to programmatically create and provide values for Timer metrics. This is helpful when you want to instrument a duration, but want to provide individual measurements. We are using this method to track the KPIs for our microservice pipeline. We attach the ingestion timestamp as a Kafka header to each message and can track the time spent throughout the pipeline.
@ApplicationScoped
public class Processor {

   private MeterRegistry registry;
   private Timer timer;

   // Quarkus injects the MeterRegistry
   public Processor(MeterRegistry registry) {
       this.registry = registry;
       timer = Timer.builder("pipelineLatency")
           .description("The latency of the whole pipeline.")
           .publishPercentiles(0.5, 0.75, 0.95, 0.98, 0.99, 0.999)
           .percentilePrecision(3)
           .distributionStatisticExpiry(Duration.ofMinutes(5))
           .register(registry);
   }

   public void processMessage(ConsumerRecord<String, String> message) {
       /*
           Do message processing
        */
       // Retrieve the kafka header
       Optional.ofNullable(message.headers().lastHeader("pipelineIngestionTimestamp"))
           // Get the value of the header
           .map(Header::value)
           // Read the bytes as String
           .map(v -> new String(v, StandardCharsets.UTF_8))
           // Parse as long epoch in millisecond
           .map(v -> {
               try {
                   return Long.parseLong(v);
               } catch (NumberFormatException e) {
                   // The header can't be parsed as a Long
                   return null;
               }
           })
           // Calculate the duration between the start and now
           // If there is a discrepancy in the clocks the calculated
           // duration might be less than 0. Those will be dropped by MicroMeter
           .map(t -> System.currentTimeMillis() - t)
           .ifPresent(d -> timer.record(d, TimeUnit.MILLISECONDS));
   }
}
The timer metric with aggregation can then be retrieved via the REST endpoint at https://quarkusHostname/metrics.
# HELP pipelineLatency_seconds The latency of the whole pipeline.
# TYPE pipelineLatency_seconds summary
pipelineLatency_seconds{quantile="0.5",} 0.271055872
pipelineLatency_seconds{quantile="0.75",} 0.386137088
pipelineLatency_seconds{quantile="0.95",} 0.483130368
pipelineLatency_seconds{quantile="0.98",} 0.48915968
pipelineLatency_seconds{quantile="0.99",} 0.494140416
pipelineLatency_seconds{quantile="0.999",} 0.498072576
pipelineLatency_seconds_count 168.0
pipelineLatency_seconds_sum 42.581
# HELP pipelineLatency_seconds_max The latency of the whole pipeline.
# TYPE pipelineLatency_seconds_max gauge
pipelineLatency_seconds_max 0.498
We then ingest those metrics in LogicMonitor as DataPoints using collectors.
Step-by-step setup for Quarkus Micrometer
To integrate Micrometer with Quarkus for seamless microservice monitoring, follow these steps:
1. Add Dependencies: Add the required Micrometer and Quarkus dependencies to enable metrics collection and reporting for your microservices.
gradle
Copy code
implementation 'io.quarkus:quarkus-micrometer:1.11.0.Final'
implementation 'io.micrometer:micrometer-registry-prometheus:1.6.3'2. Enable REST endpoint: Configure Micrometer to expose metrics via a REST endpoint, such as /metrics.
3. Use annotations for metrics: Apply Micrometer annotations like @Timed and @Counted to the methods where metrics need to be tracked.
4. Set up a registry: Use Prometheus as a registry to pull metrics from Quarkus via Micrometer. Here’s an example of how to set up a timer:
java
Copy code
Timer timer = Timer.builder("pipelineLatency")
.description("Latency of the pipeline") .publishPercentiles(0.5, 0.75, 0.95, 0.98, 0.99, 0.999) .register(registry);5. Monitor via the endpoint: After setup, retrieve and monitor metrics through the designated REST endpoint:
urlCopy codehttps://quarkusHostname/metricsPractical use cases for using Micrometer in Quarkus
Quarkus and Micrometer offer a strong foundation for monitoring microservices, providing valuable insights for optimizing their performance. Here are some practical applications:
- Latency tracking: Use Micrometer to measure the time it takes for messages to move through your microservice pipeline. This helps identify bottlenecks and improve processing efficiency.
- Anomaly detection: By continuously analyzing metrics over time, you can detect unusual patterns in message processing rates or spikes in system latency, letting you address issues before they impact performance.
- Resource monitoring: Track JVM metrics like memory usage and CPU consumption to optimize resource allocation and ensure your services run smoothly.
- Custom KPIs: Tailor metrics to your specific business objectives, such as message processing speed or response times, allowing you to track key performance indicators that matter most to your organization.
Quarkus and Micrometer make it easy to monitor critical performance metrics, allowing businesses to scale with confidence.
LogicMonitor microservice technology stack
LogicMonitor’s Metric Pipeline, where we built out multiple microservices with Quarkus in our environment, is deployed on the following technology stack:
- Java 11 (corretto, cuz licenses)
- Kafka (managed in AWS MSK)
- Kubernetes
- Nginx (ingress controller within Kubernetes)
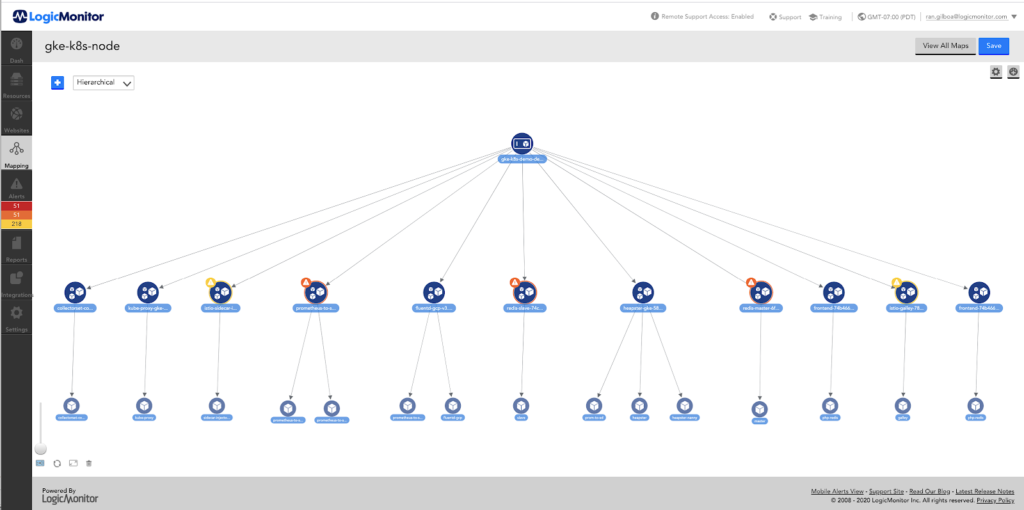
How do we correlate configuration changes to metrics?
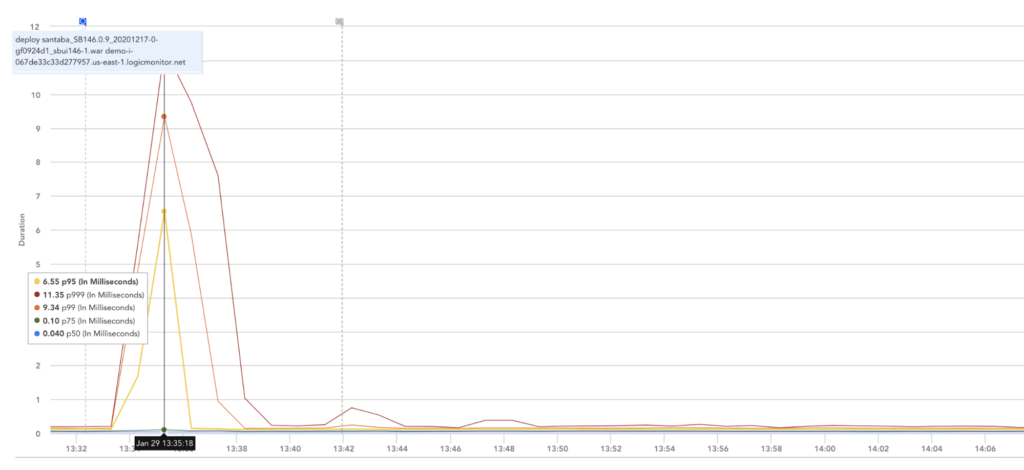
Once those metrics are ingested in LogicMonitor, they can be displayed as graphs or integrated into dashboards. They can also be used for alerting and anomaly detections, and in conjunction with ops notes, they can be visualized in relation to infrastructure or configuration changes, as well as other significant events.
Below is an example of an increase in processing duration correlated to deploying a new version. Deploying a new version automatically triggers an ops note that can then be displayed on graphs and dashboards. In this example, this functionality facilitates the correlation between latency increase and service deployment.
Tips for efficient metrics collection and optimizing performance
To get the most out of Quarkus and Micrometer, follow these best practices for efficient metrics collection:
- Focus on Key Metrics: Track the metrics that directly impact your application’s performance, such as latency, throughput, and resource usage. This helps you monitor critical areas that influence your overall system health.
- Use Percentile Data: Analyzing percentile values like p95 and p99 allows you to spot outliers and bottlenecks more effectively than relying on averages. This gives you deeper insights into performance anomalies.
- Monitor Custom Metrics: Customize the metrics you collect to match your application’s specific needs. Don’t limit yourself to default metrics. Tracking specific business-critical metrics will give you more actionable data.
How to Track Anomalies
All of our microservices are monitored with LogicMonitor. Here’s an example of Anomaly Detection for the pipeline latencies 95 percentile. LogicMonitor dynamically figures out the normal operating values and creates a band of expected values. It’s then possible to define alerts when values fall outside the generated band.
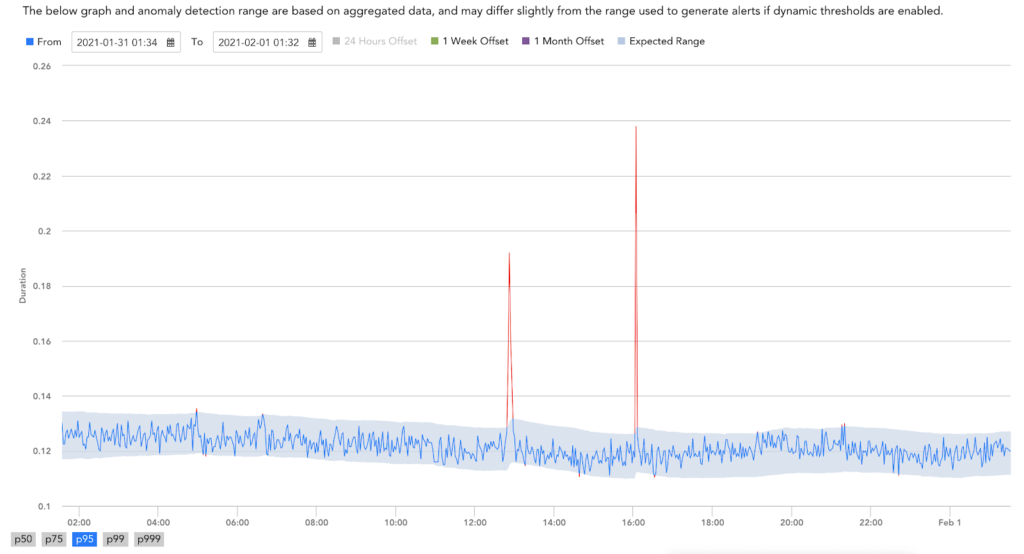
As seen above, the integration of MicroMeter with Quarkus allows in conjunction with LogicMonitor a straightforward, easy, and quick way to add visibility into our microservices. This ensures that our processing pipeline provides the most value to our clients while minimizing the monitoring effort for our engineers, reducing cost, and increasing productivity.
Quarkus With Micrometer: Unlock the Power of Real-Time Insights
Integrating Micrometer with Quarkus empowers real-time visibility into the performance of your microservices with minimal effort. Whether you’re monitoring latency, tracking custom KPIs, or optimizing resource usage, this streamlined approach simplifies metrics collection and enhances operational efficiency.
Leverage the combined strengths of Quarkus and Micrometer to proactively address performance issues, improve scalability, and ensure your services are running at peak efficiency.
FAQs
How does Micrometer work with Quarkus?
Micrometer integrates seamlessly with Quarkus by providing a vendor-neutral interface for collecting and exposing metrics. Quarkus offers an extension that simplifies the integration, allowing users to track JVM and custom metrics via annotations like @Timed and @Counted and expose them through a REST endpoint.
What are the benefits of using Micrometer in a microservice architecture?
Using Micrometer in a microservice architecture provides observability, real-time visibility into the performance of individual services, helping detect anomalies, track latency, and monitor resource usage. It supports integration with popular monitoring systems like Prometheus, enabling efficient metrics collection and analysis across microservices, improving scalability and reliability.
How do you set up Micrometer metrics in Quarkus?
To set up Micrometer metrics in Quarkus, add the necessary dependencies (quarkus-micrometer and a registry like micrometer-registry-prometheus). Enable metrics exposure via a REST endpoint, apply annotations like @Timed to track specific metrics, and configure a registry (e.g., Prometheus) to pull and monitor the metrics.
What are common issues when integrating Micrometer with Quarkus, and how can they be resolved?
Common issues include misconfigured dependencies, failure to expose the metrics endpoint, and incorrect use of annotations. These can be resolved by ensuring that the proper dependencies are included, that the REST endpoint for metrics is correctly configured, and that annotations like @Timed and @Counted are applied to the correct methods.
How do I monitor a Quarkus microservice with Micrometer?
To monitor a Quarkus microservice with Micrometer, add the Micrometer and Prometheus dependencies, configure Micrometer to expose metrics via a REST endpoint, and use annotations like @Timed to track important performance metrics. You can then pull these metrics into a monitoring system like Prometheus or LogicMonitor for visualization and alerting.
Subscribe to our blog
Get articles like this delivered straight to your inbox


