AI Observability for Infrastructure, Workloads, and Pipelines in One Platform
Unify every signal across your AI environment so you move from reactive firefighting to strategic, data-driven decision making.


Unify every signal across your AI environment so you move from reactive firefighting to strategic, data-driven decision making.
Stop chasing data across tools. With full-stack visibility across your AI and IT environments, your team can move faster, troubleshoot smarter, and stay focused on what matters.
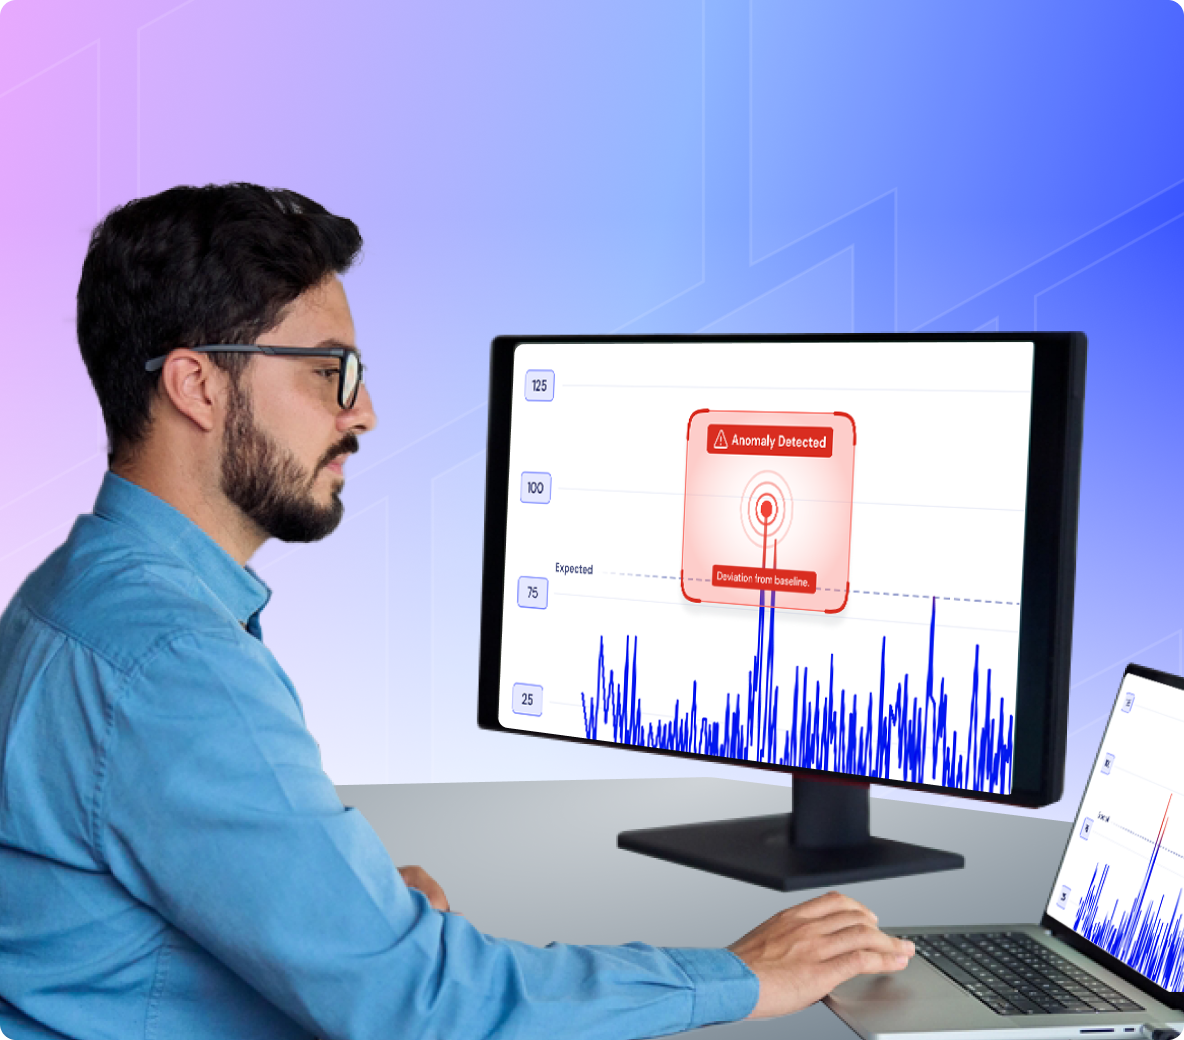
Proactively catch anomalies before they disrupt services. With early detection and root cause insights, you reduce downtime and eliminate the guesswork.
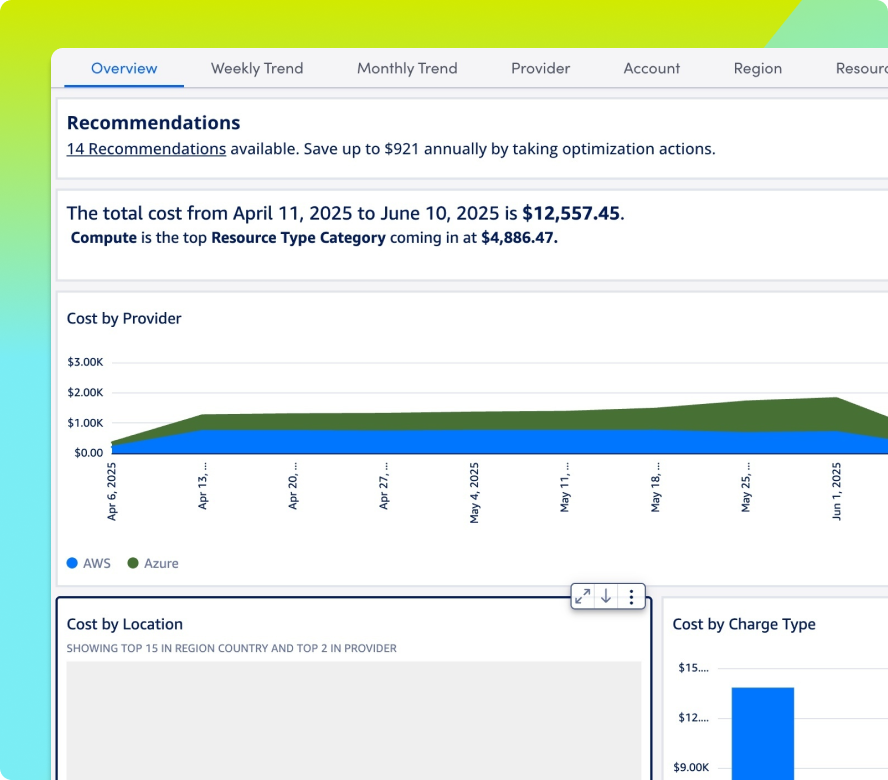
Avoid budget surprises with built-in visibility into idle resources, underused GPUs, and runaway compute before they impact spend.
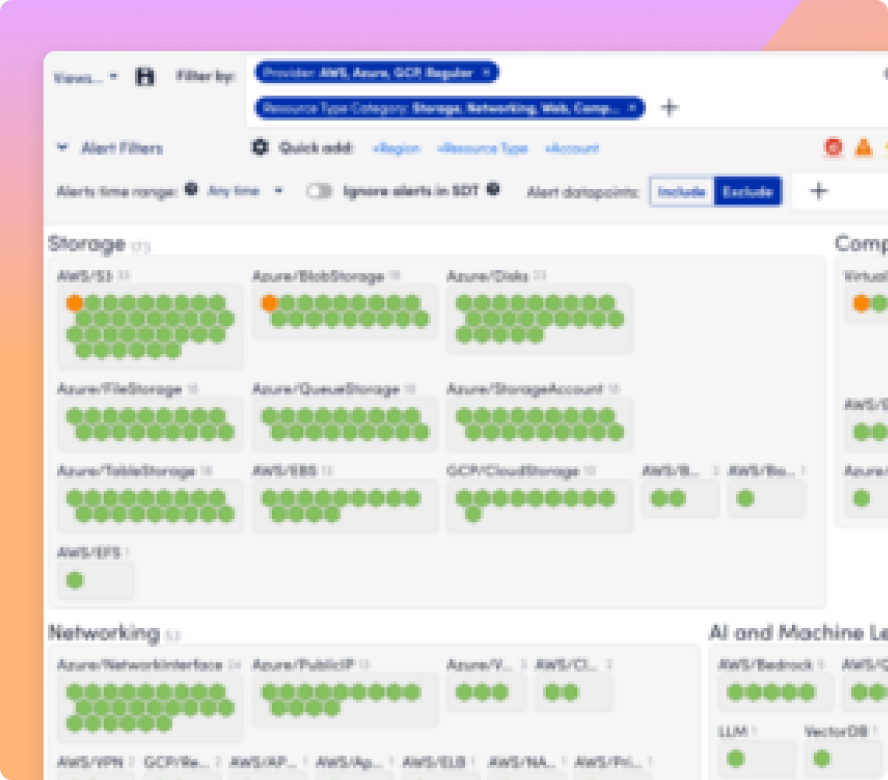
As your stack evolves, LogicMonitor keeps up. New systems are discovered automatically with no manual overhead and no gaps in coverage.
Monitor access, usage, and system behavior across your entire AI footprint. Spot irregular activity before it becomes a breach or a service disruption.
Turn complex metrics—like AI cost, uptime, and system performance—into clear, actionable dashboards that drive alignment, investment, and smarter decisions.
OBSERVABILITY POWERED BY LOGICMONITOR ENVISION AND EDWIN AI
With real-time visibility, automated discovery, and AI correlation, LM Envision helps you monitor every layer of your AI infrastructure, so you can prevent downtime, manage spend, and move fast.
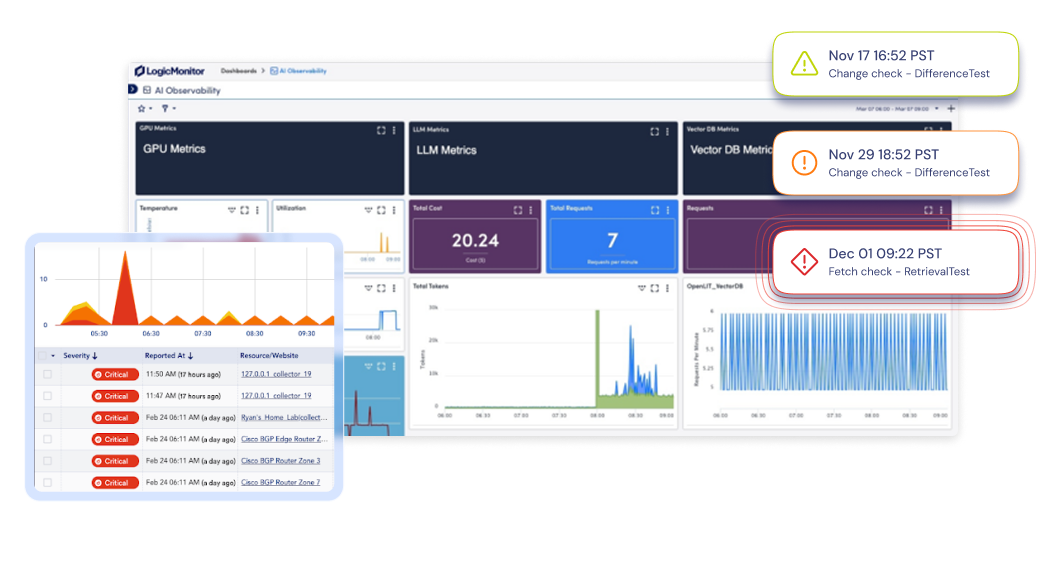
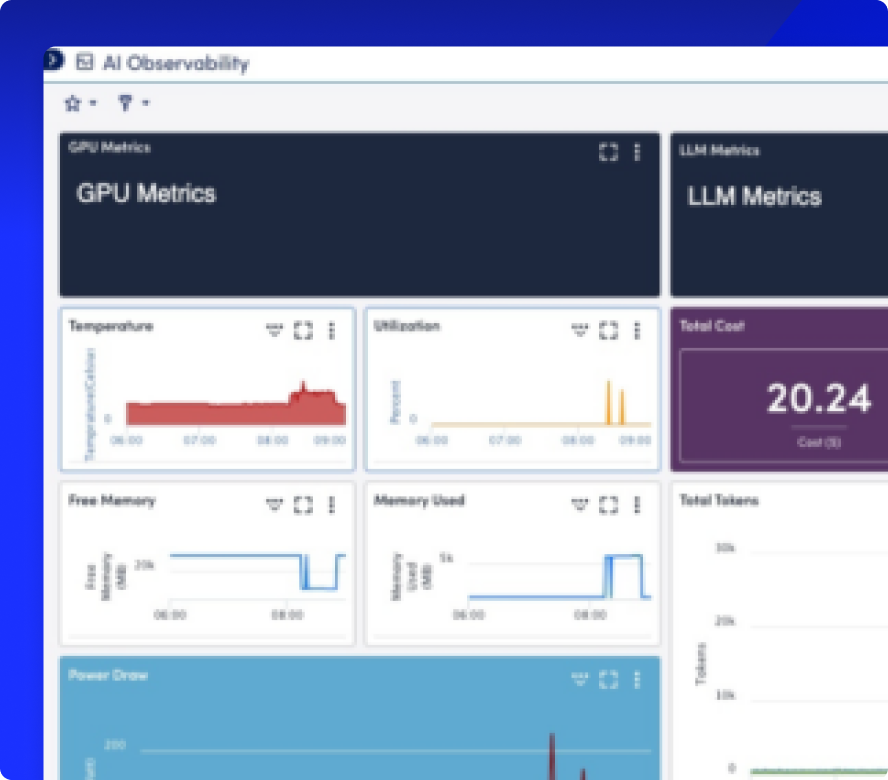
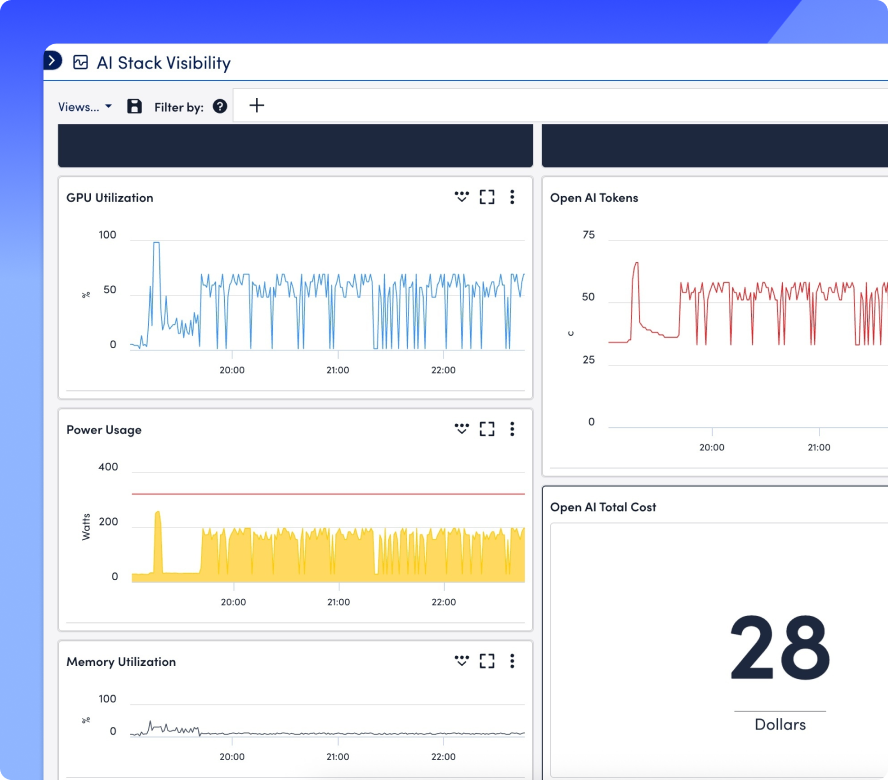
Bring GPU metrics, LLM performance, and vector database stats into a single view, so you can eliminate blind spots and monitor every layer of your AI stack.
Display GPU, LLM, vector-DB, and infrastructure metrics side by side using prebuilt dashboards or build your own with drag-and-drop customization.
Catch unusual behavior early with anomaly detection, set metric-based thresholds, and suppress low-priority alerts, so teams can focus on high-confidence incidents.Trace every AI request from API to GPU
Map out inference pipelines, trace service relationships, and visualize cloud/on-prem topology, so you can pinpoint latency and troubleshoot faster.
Break down token usage and GPU costs, detect idle resources, and set budget alerts using built-in forecasting tools purpose-built for AI workloads.
Ingest AI-specific and infrastructure logs to flag anomalies, track access patterns, and export audit-ready logs for compliance with standards like HIPAA and SOC 2.
INTEGRATIONS
LM Envision integrates with 3,000+ technologies, from infrastructure and ITSM tools to AI platforms and model frameworks. Ingest metrics from GPUs, LLMs, vector databases, and cloud AI services while syncing enriched incident context with tools like ServiceNow, Jira, and Zendesk automatically.
100%
collector-based and API-friendly
3,000+
integrations and counting
AI agent for ITOps
Edwin AI applies agentic AIOps to streamline ITOps by cutting noise, automating triage, and driving resolution across even the most complex environments. No manual stitching. No swivel-chairing.
67%
ITSM incident reduction
88%
noise reduction
By the numbers
Get anwers
Get the answers to the top AI monitoring questions.
AI observability is the ability to monitor and understand how AI systems behave in production. It helps teams detect model drift, spot latency, and catch silent failures by combining insights from infrastructure, models, and apps into one view.
Traditional monitoring watches CPU, memory, and uptime. AI observability connects those signals with model behavior, like output changes, performance slowdowns, and unusual agent behaviors.
Ideally before production. It’s much easier to track your AI systems from day one than to fix visibility gaps later.
Yes. LogicMonitor watches for unusual patterns in system and model behavior, like slow responses, unexpected output spikes, or shifts in usage that often indicate deeper AI issues.
No. LogicMonitor uses a collector-based model with built-in integrations. You can start monitoring your AI stack quickly, without complex setup.
Own your AI performance
with LM Envision