

SD-WAN Monitoring Built for Hybrid Networks
Monitor SD-WAN performance across multi-vendor environments, detect anomalies in real time, and scale your network with confidence, no matter where your infrastructure lives.
When your team can monitor SD-WAN performance in real time, they can prevent disruptions, improve user experience, and make smarter infrastructure decisions at scale.
Get ahead of service-impacting issues with earlier warnings and faster incident response, so users stay connected and productivity stays high.
Maintain consistent performance across sites, clouds, and SD-WAN vendors as your network grows without losing visibility or control.
Make smarter choices about capacity, architecture, and spend with access to unified metrics, logs, and trends across your SD-WAN.
Eliminate blind spots across multi-vendor environments so your team can detect root causes faster and act with clarity and speed.
Automate alerting, eliminate noisy data, and streamline monitoring workflows, freeing your team to focus on optimization, not firefighting.
Maintain full visibility and performance awareness across on-prem, cloud, and edge environments even as your network evolves.
Observability powered by LogicMonitor Envision and Edwin AI
Everything you need to stay in control of your SD-WAN environment
From dynamic path tracking and edge device visibility to unified alerts and multi-vendor support, LM Envision gives you full control over your SD-WAN environments.
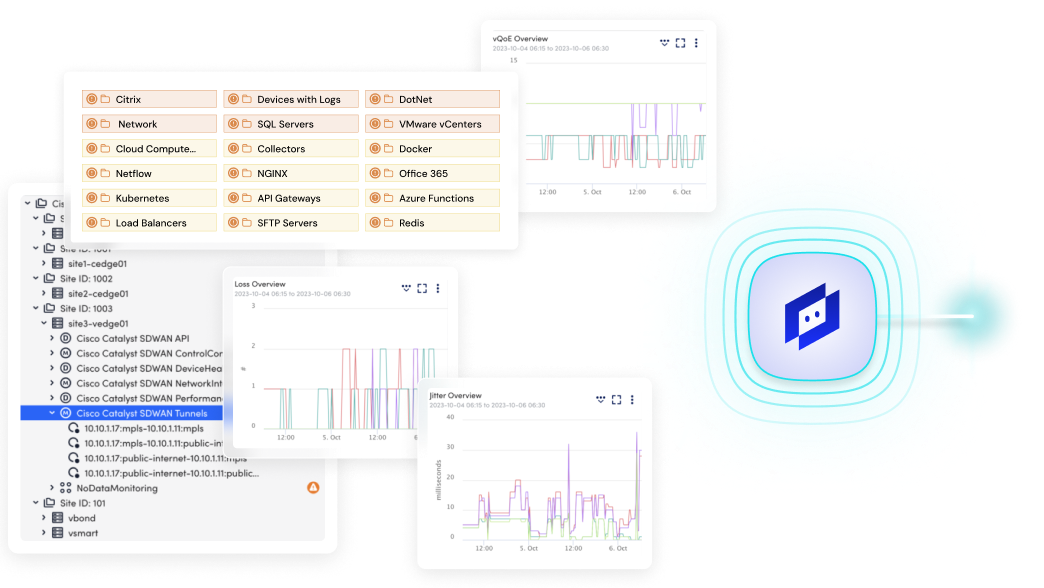
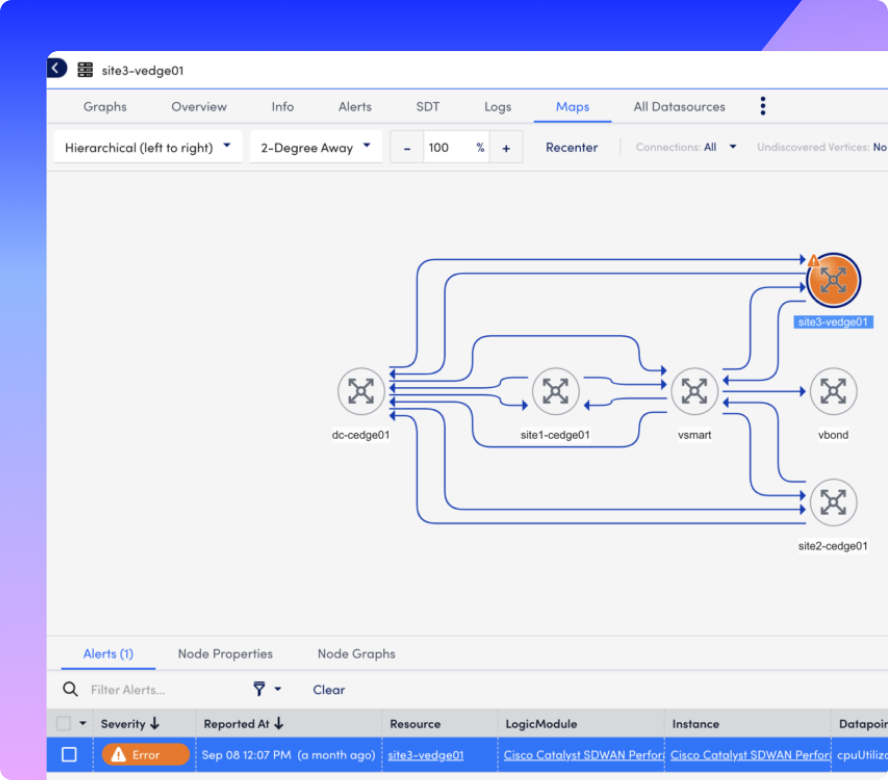
Monitor multi-vendor SD-WAN in one place
Unify monitoring across Cisco, Meraki, Palo Alto Prisma, Fortinet, and more without separate tools or manual integration.
-
Auto-discover cloud and edge devices Instantly detect and onboard SD-WAN nodes using vendor APIs and agentless collectors.
-
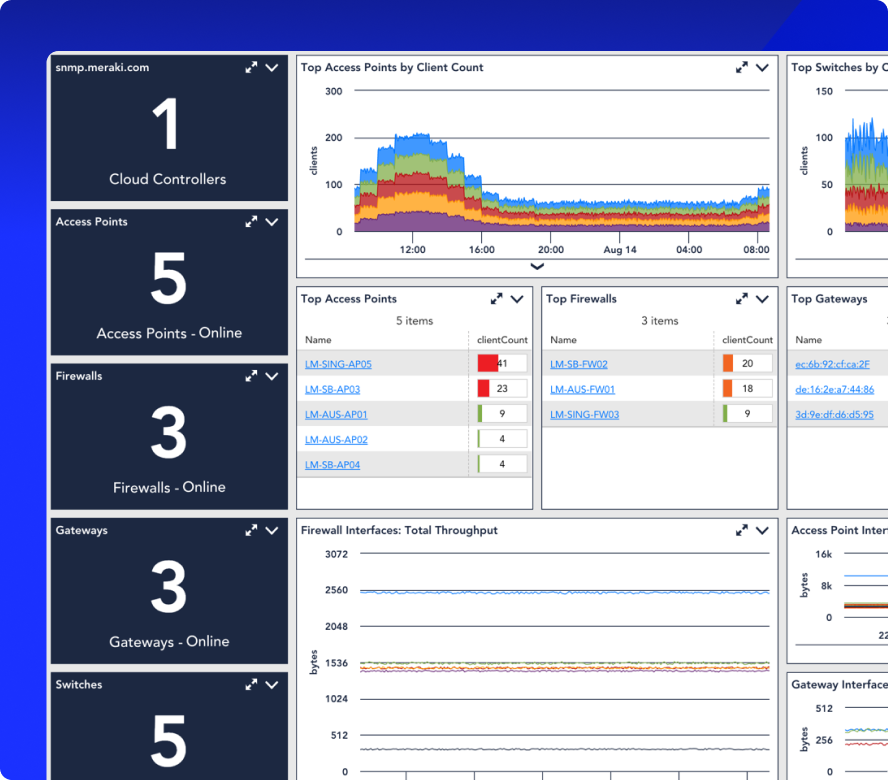
Normalize metrics across platforms View consistent performance data from multiple vendors in a single dashboard.
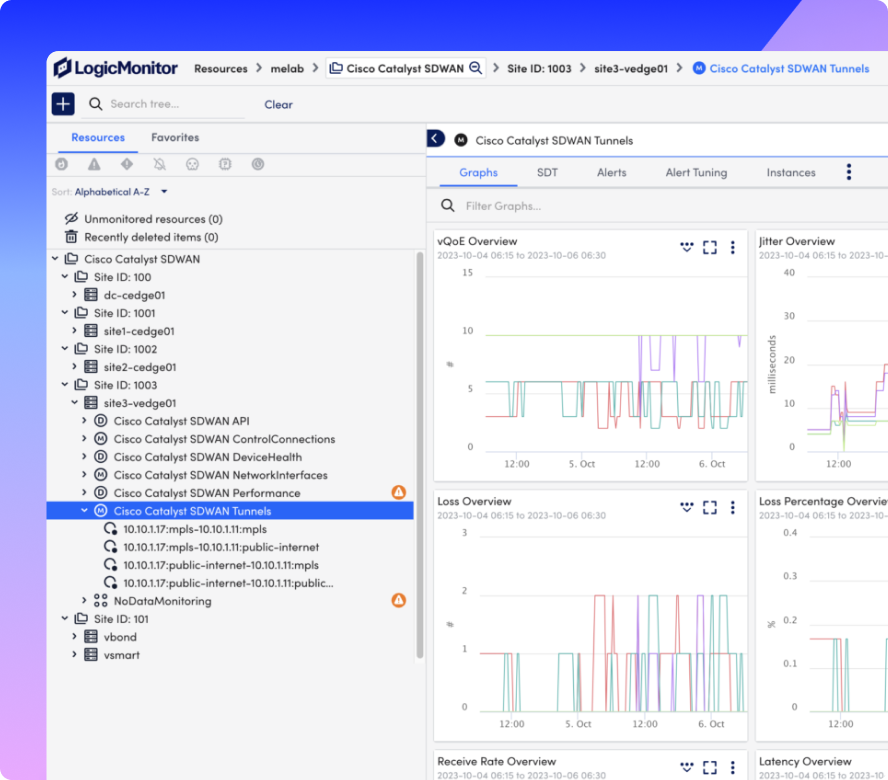
Surface issues with tunnel and path quality
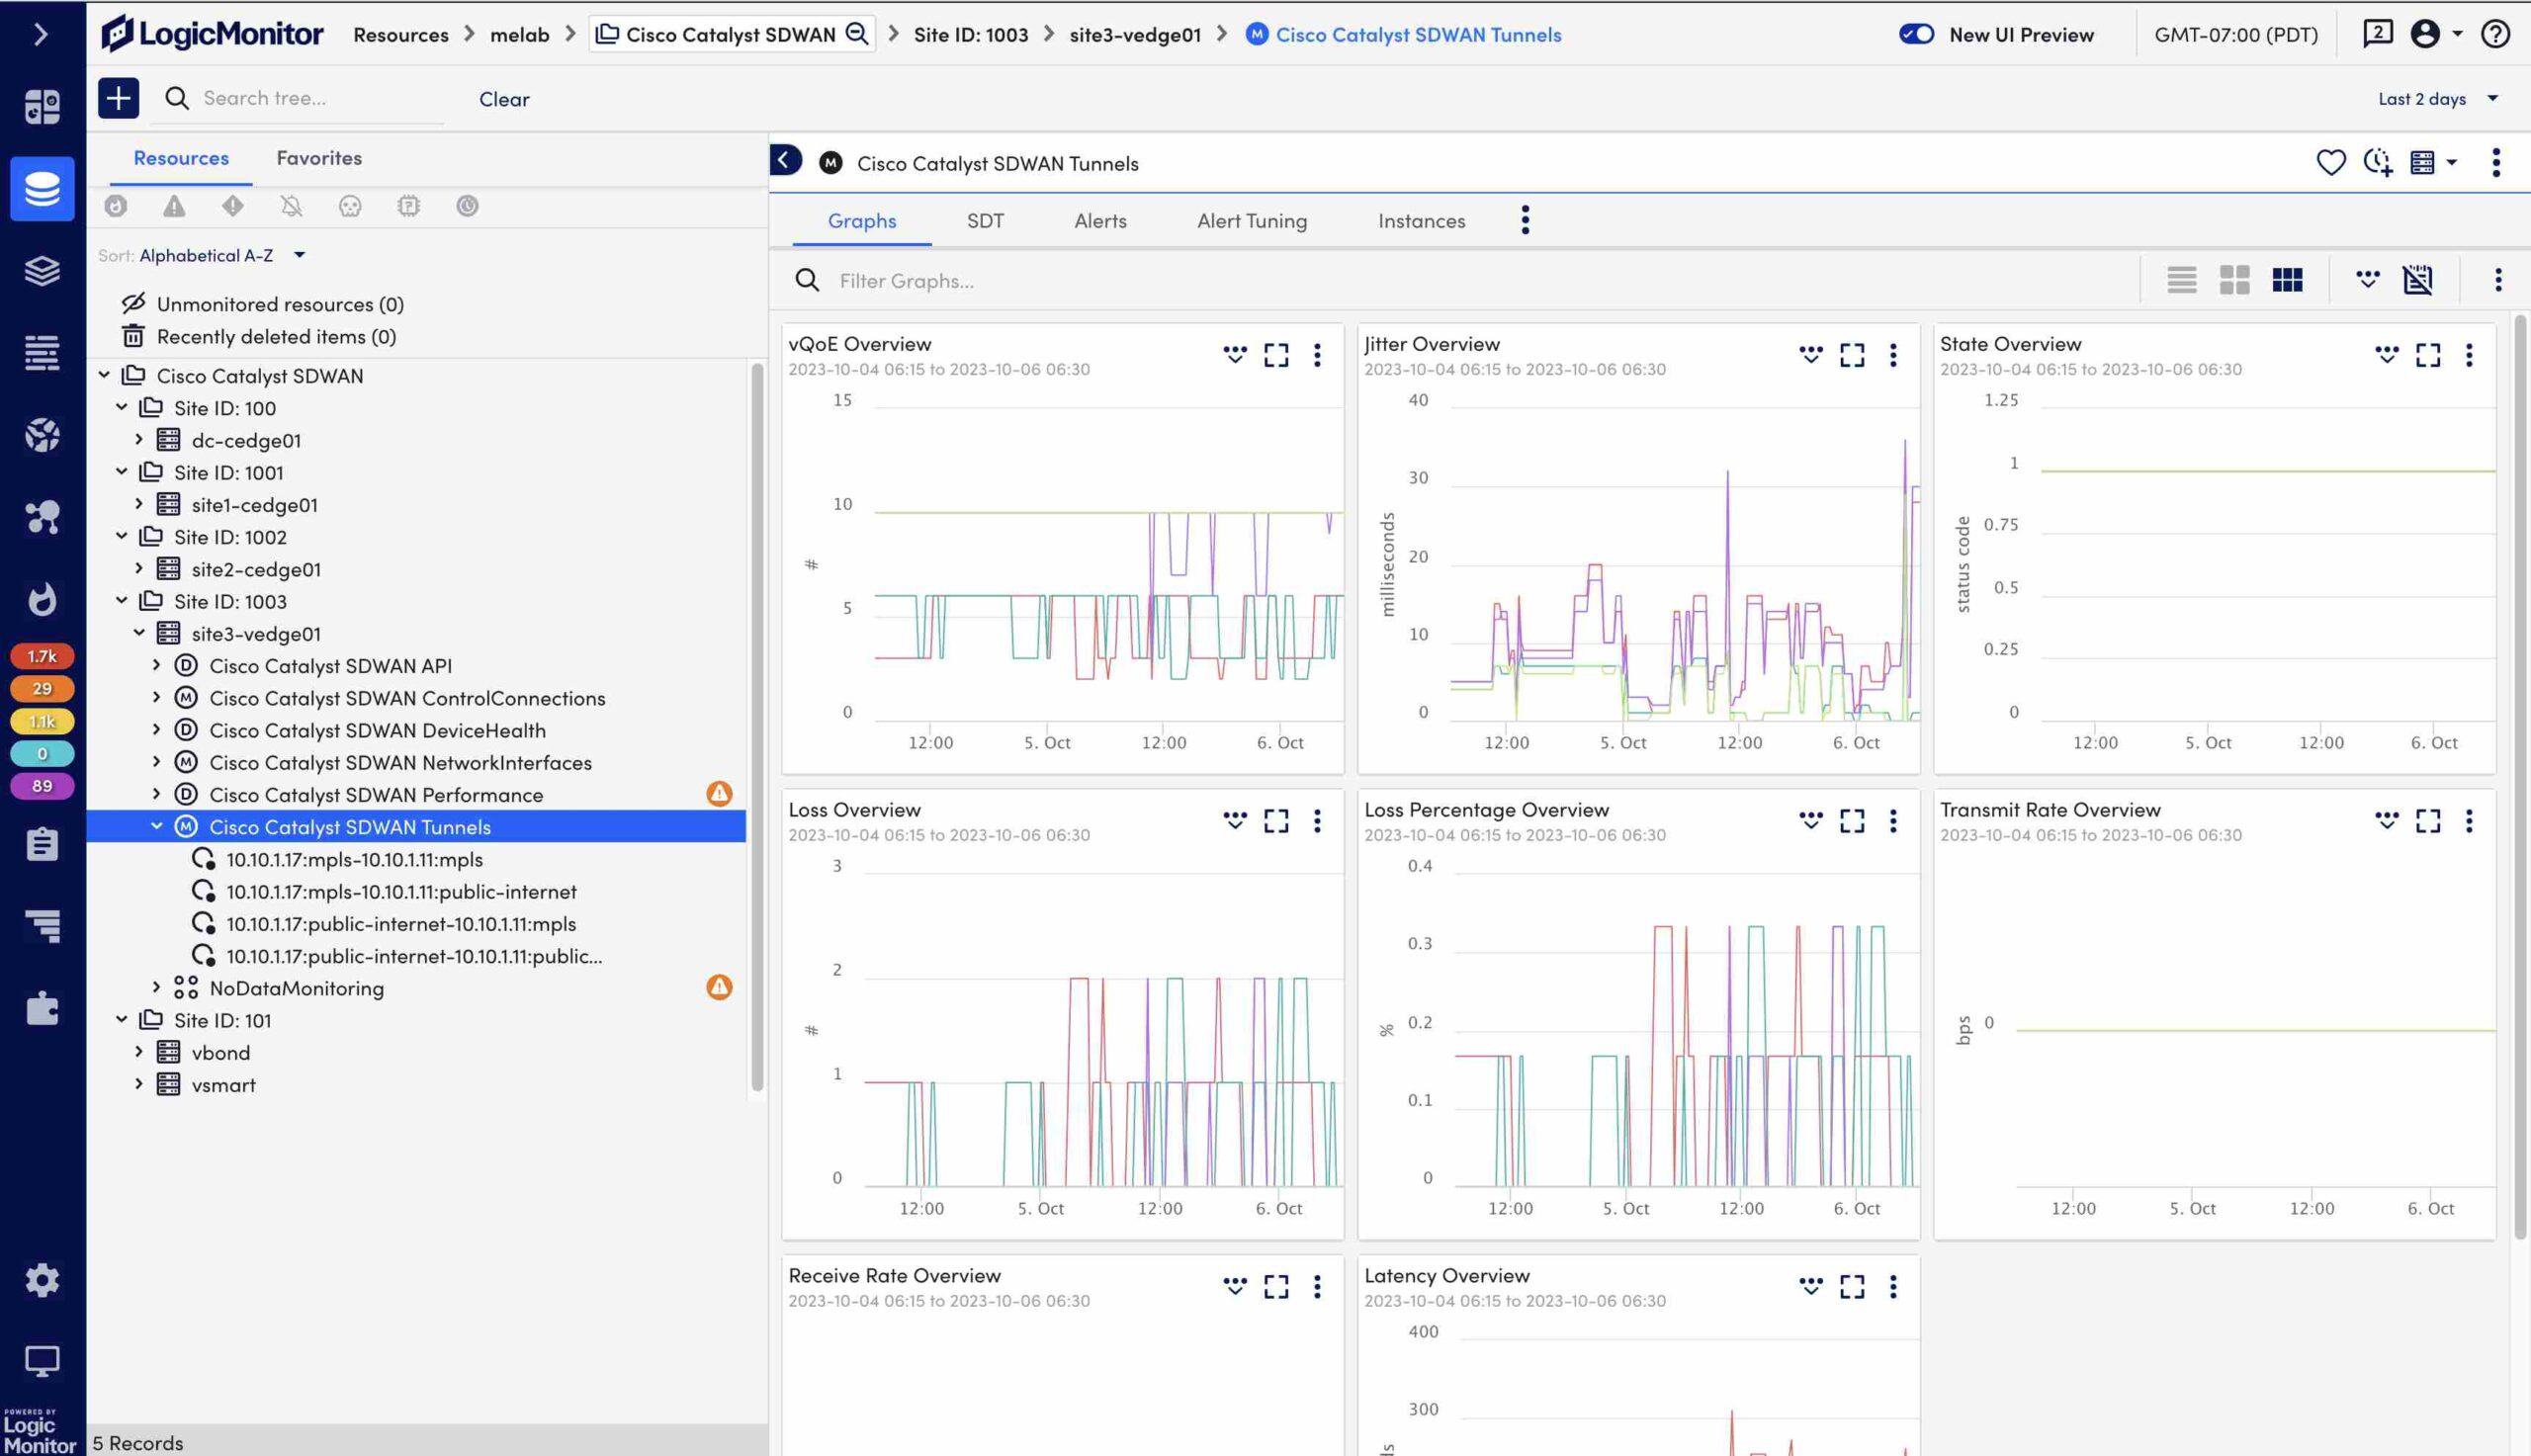
Detect tunnel degradation, jitter, latency, and packet loss before they disrupt connectivity or application performance.
-
Track real-time tunnel health Monitor performance between sites and cloud edges to prevent downtime.
-
Visualize traffic and availability trends Use dynamic graphs to spot instability or congestion across WAN paths.
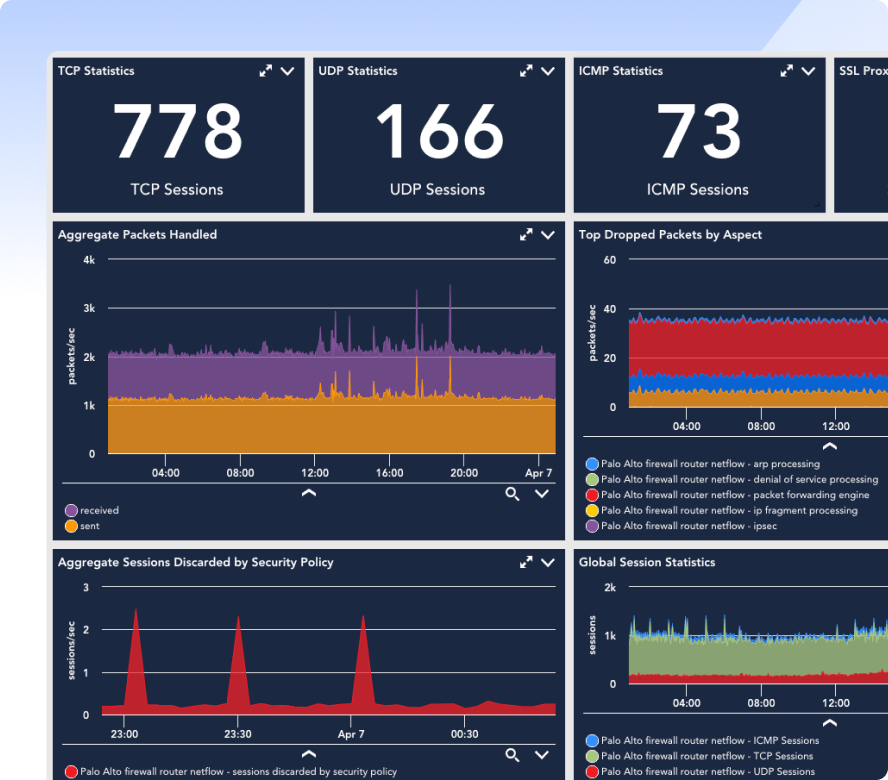
Correlate logs, metrics, and alerts in one view
Combine structured logs and performance data to accelerate root cause analysis and reduce MTTR.
-
Connect events to outcomes Understand how tunnel failures impact specific services or user groups.
-
Log-based anomaly detection Automatically surface unusual behavior tied to degraded network health.
Enable fast, actionable alerting
Route the right alerts to the right teams at the right time with integrations for ITSM, chat, and automation platforms.
-
Integrated with ServiceNow, Slack, PagerDuty, Teams Streamline incident response with pre-built workflows and notifications.
-
Smart alert escalation Prioritize alerts by severity, scope, or service impact without overwhelming your team.
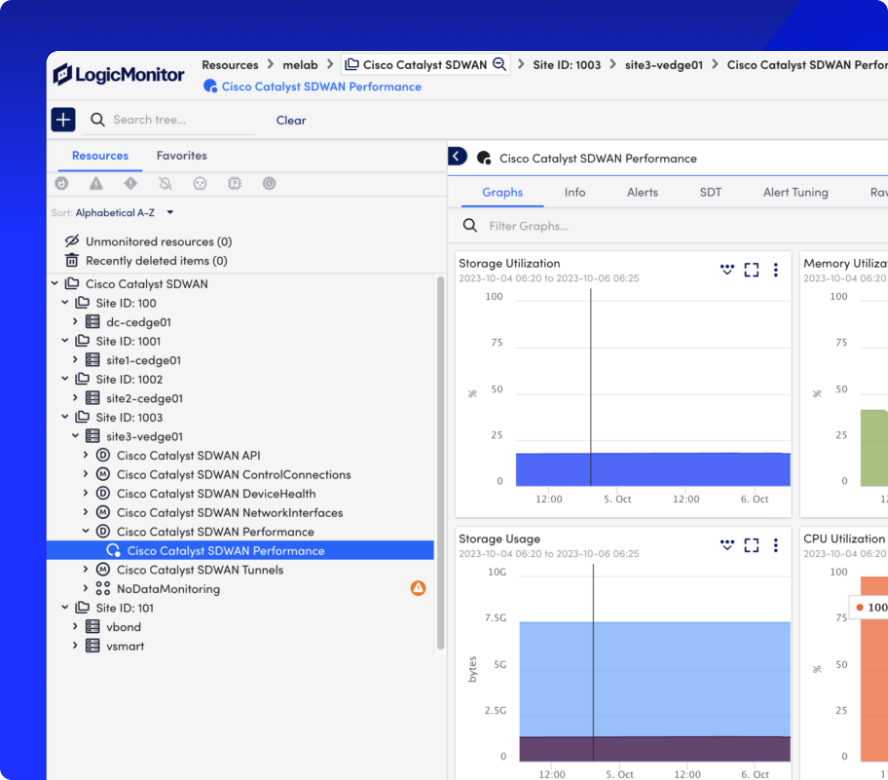
Forecast Performance and Plan Proactively
Leverage predictive analytics to anticipate bandwidth constraints and guide infrastructure investments.
-
Utilization and capacity forecasting See where growth may create bottlenecks and plan ahead.
-
SLA monitoring and reporting Measure availability and performance against defined service thresholds with built-in reporting tools.
Integrations
Built for Cisco, Meraki, Palo Alto, and everything in between
LM Envision integrates with your entire SD-WAN stack, including Cisco SD-WAN (Viptela), Meraki, Palo Alto Prisma, Fortinet, Juniper, VMware, and more. Whether you’re standardizing or managing multi-vendor networks, LogicMonitor keeps every connection observable, every device in view, and every alert in context.
100%
collector-based and API-friendly
3,000+
integrations and counting
AI AGENT FOR ITOPS
Edwin AI: AI that keeps your SD-WAN one step ahead
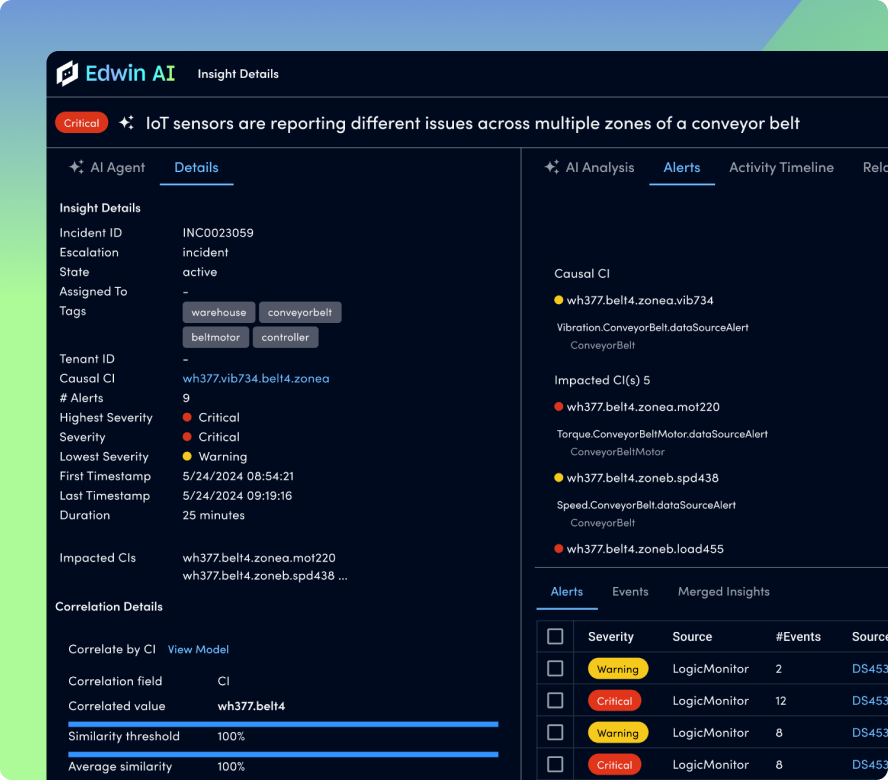
Edwin AI automatically detects tunnel degradation, correlates anomalies across branches and vendors, and summarizes incidents in plain language, so your teams don’t waste time chasing alerts. From predicting bandwidth constraints to pinpointing root cause, Edwin brings clarity and speed to every decision.
67%
ITSM incident reduction
88%
noise reduction
“Edwin AI cut noise by 90% & ITSM incidents by 76%, enabling better customer service.”

“LogicMonitor is a valuable partner, constantly innovating and adapting to our business needs.”

“Edwin AI delivered value within an hour of implementation.”

“Capital Group has 1,000+ alerts/ day. LogicMonitor will eliminate that noise.”

“The single pane of glass across all of our regions enables us to act more proactively.”

BY THE NUMBERS
SD-WAN monitoring that proves value
GET ANSWERS
FAQs
Get the answers to the top SD-WAN monitoring questions.
Does LogicMonitor support multiple SD-WAN vendors?
Yes. LM Envision provides out-of-the-box support for Cisco SD-WAN (Viptela), Meraki, Palo Alto Prisma SD-WAN, Fortinet, VMware, and more. You can monitor performance, tunnel health, and edge devices across vendors—all from a single platform.
Can I see tunnel performance like jitter, latency, and loss in real time?
Absolutely. LM Envision monitors SD-WAN tunnel quality metrics in real time, including jitter, latency, packet loss, and throughput, so you can detect degradation before it impacts user experience.
Will LogicMonitor integrate with my ITSM or incident management tools?
Yes. LM Envision integrates with tools like ServiceNow, PagerDuty, Slack, Microsoft Teams, and more. You can automate alert routing, streamline escalation workflows, and reduce response times.
How fast can we start monitoring our SD-WAN infrastructure?
Most teams begin monitoring in under five minutes using LogicMonitor’s agentless onboarding. Built-in integrations and auto-discovery make it easy to get up and running fast—no heavy setup required.
How does LogicMonitor help reduce alert fatigue?
With Edwin AI, LM Envision automatically correlates alerts across tunnels, locations, and devices, reducing noise and highlighting root cause. You’ll only see what matters when it matters.
Can LogicMonitor help us forecast bandwidth needs or infrastructure upgrades?
Yes. LM Envision provides predictive insights based on historical usage trends, so you can plan bandwidth expansion, anticipate tunnel capacity limits, and guide strategic infrastructure decisions.
Start monitoring your SD-WAN with LM Envision