


Database Monitoring That Keeps Your Stack Running Smoothly
Ensure performance, availability, and scale across your entire database environment with unified observability for hybrid infrastructure and the intelligence to act on what matters.
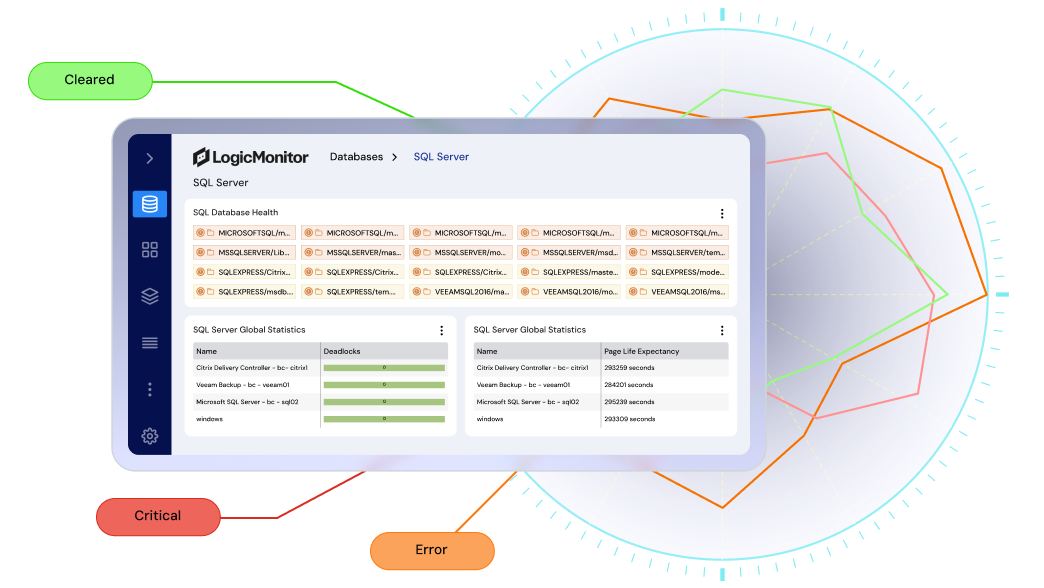
When your team has real-time visibility into database health, they resolve issues faster, deliver better experiences, and scale with confidence without the noise.
When performance dips, your team knows exactly where to look, so downtime is brief and business impact is minimized.
Healthy databases mean no more slow queries dragging down applications, so performance stays strong and users stay happy.
Understand how your databases are used over time, so you can scale wisely, optimize spend, and plan ahead with confidence.
Fewer false alerts and better context mean your team can move from reactive scrambling to proactive improvement.
Whether you’re monitoring five databases or five thousand, in the cloud or on-prem, LM Envision grows with you seamlessly.
From DBAs to developers to ITOps, everyone works from the same source of truth, so handoffs are faster and silos don’t slow you down.
OBSERVABILITY POWERED BY LOGICMONITOR ENVISION AND EDWIN AI
Everything you need to monitor and optimize your databases
From query performance and resource utilization to real-time alerting and historical trend analysis, LM Envision delivers full visibility into every database.
Monitor databases without the manual setup
Auto-discover cloud and on-prem databases with no agents, scripts, or guesswork required.
-
Discover and start monitoring in minutes Detect supported database instances automatically—no software installs or custom config.
-
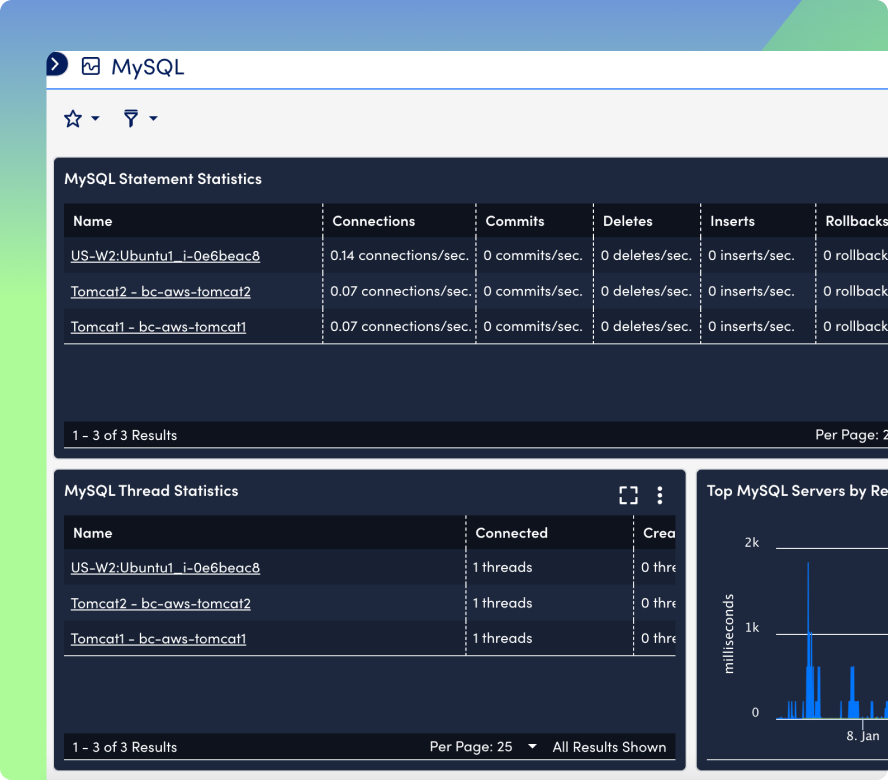
Built-in support for top platforms Get out-of-the-box visibility for Oracle, MySQL, SQL Server, PostgreSQL, MongoDB, Cassandra, and more.
Spot performance issues before they impact users
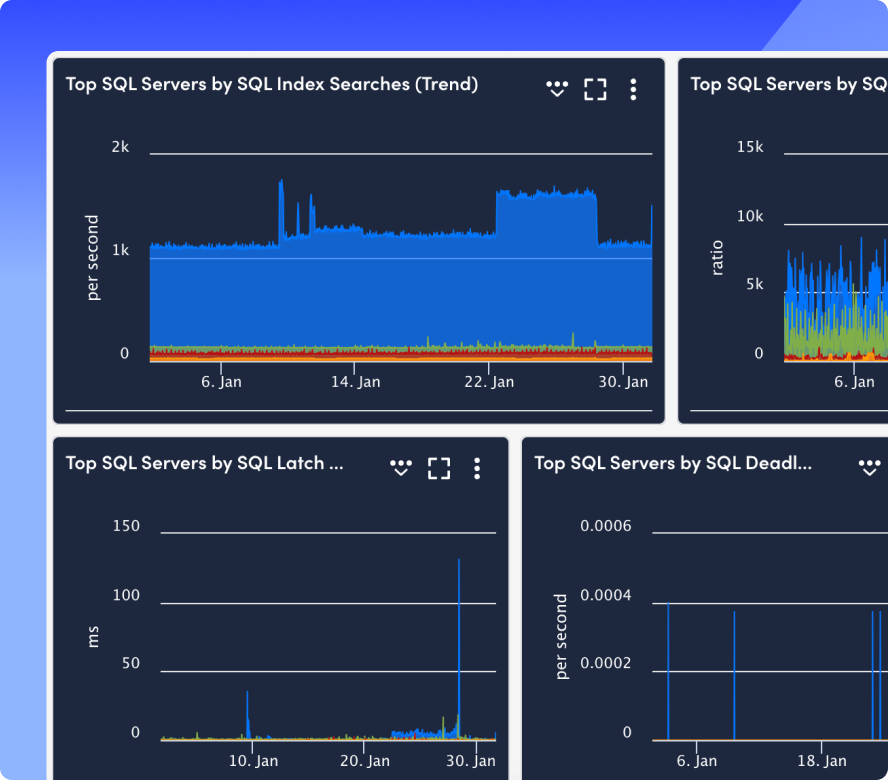
Track execution time, connection health, and throughput in real time to catch bottlenecks early.
-
Identify trends in query slowdowns Surface degrading performance across services and alert before it impacts applications.
-
Correlate database behavior to infrastructure Understand if slowness is caused by storage, CPU, or external dependencies—not just the DB layer.
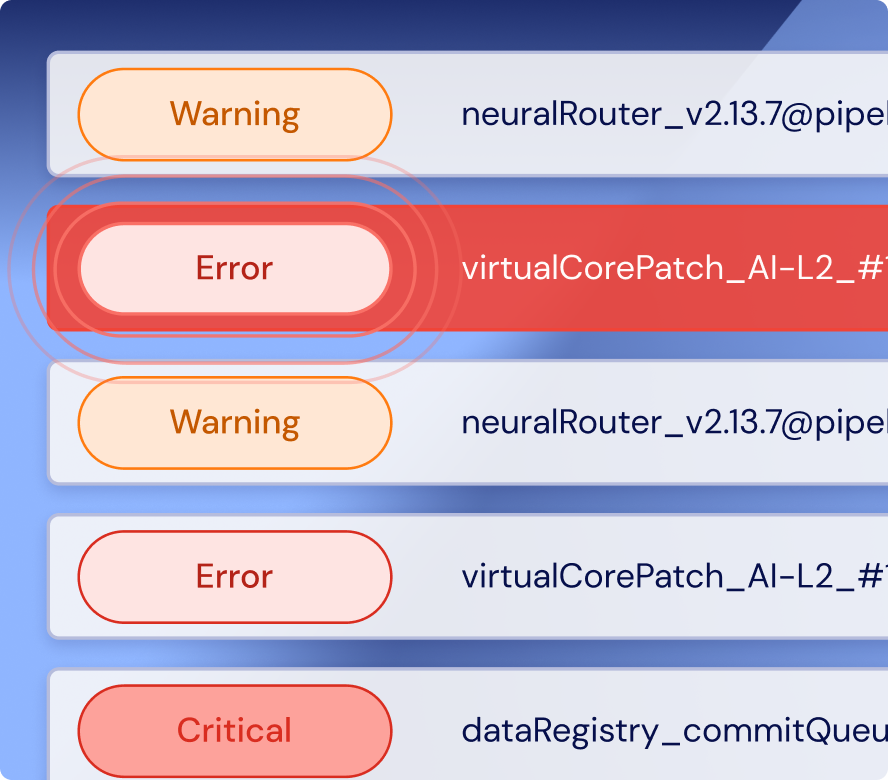
Get actionable alerts, not just more noise
Receive alerts that are tuned to real thresholds and context, not blanket rules.
-
Dynamic baselining and anomaly detection LM Envision learns what’s “normal” so your team can focus only on real problems.
-
Integrate with your workflow Route alerts through ServiceNow, PagerDuty, Slack, and Teams with context-rich payloads.
Plan smarter with forecasting and trend analysis
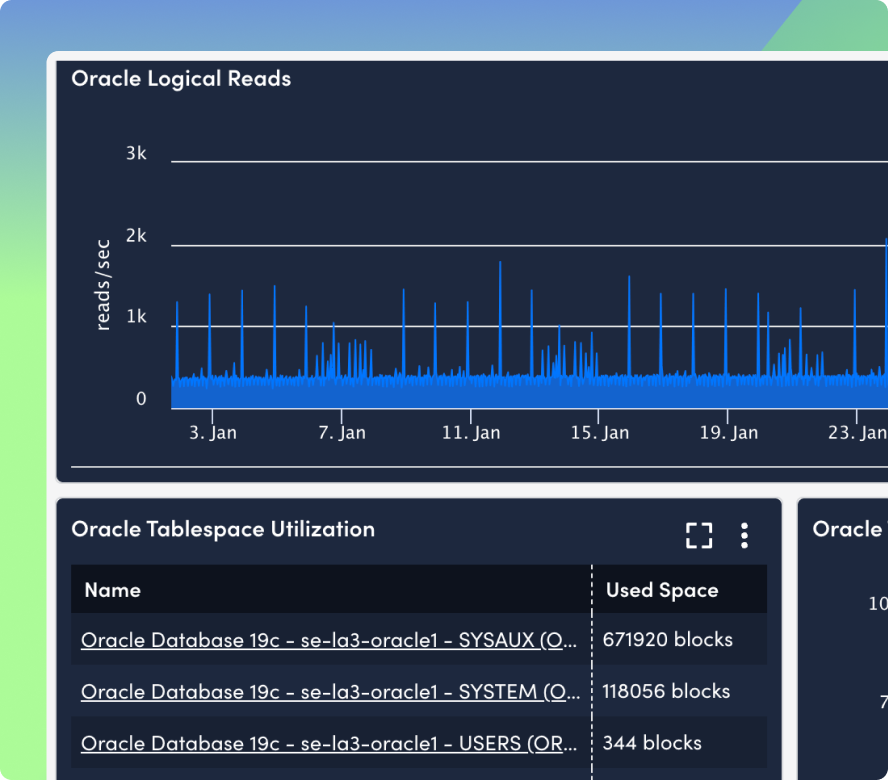
Track usage over time to prevent capacity issues and make smarter scaling decisions.
-
Historical trend tracking See how usage changes over time to avoid surprise outages or overprovisioning.
-
Forecast capacity needs Predict future resource requirements with time-based analysis and reporting.
Understand the full picture with infrastructure correlation
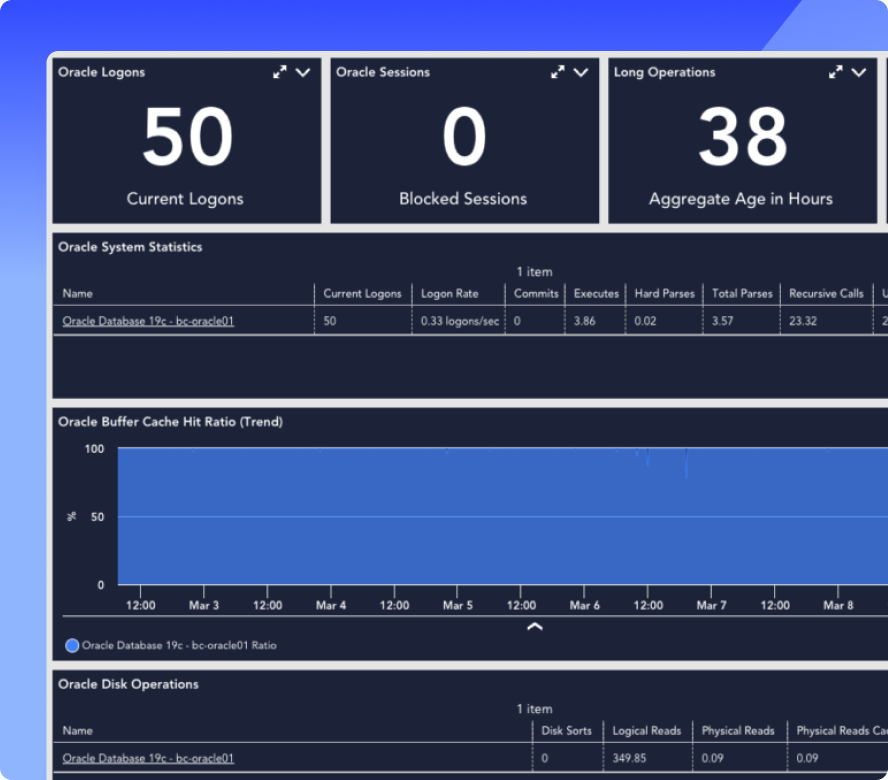
Go beyond the database—link performance to storage, app, and network health in one view.
-
Topology-aware root cause analysis Visualize how DB metrics interact with the full stack to speed up troubleshooting.
-
One platform, full observability Monitor everything—databases, applications, servers, and networks—in one unified view.
Integrations
Built for Oracle, MySQL, SQL Server, and beyond
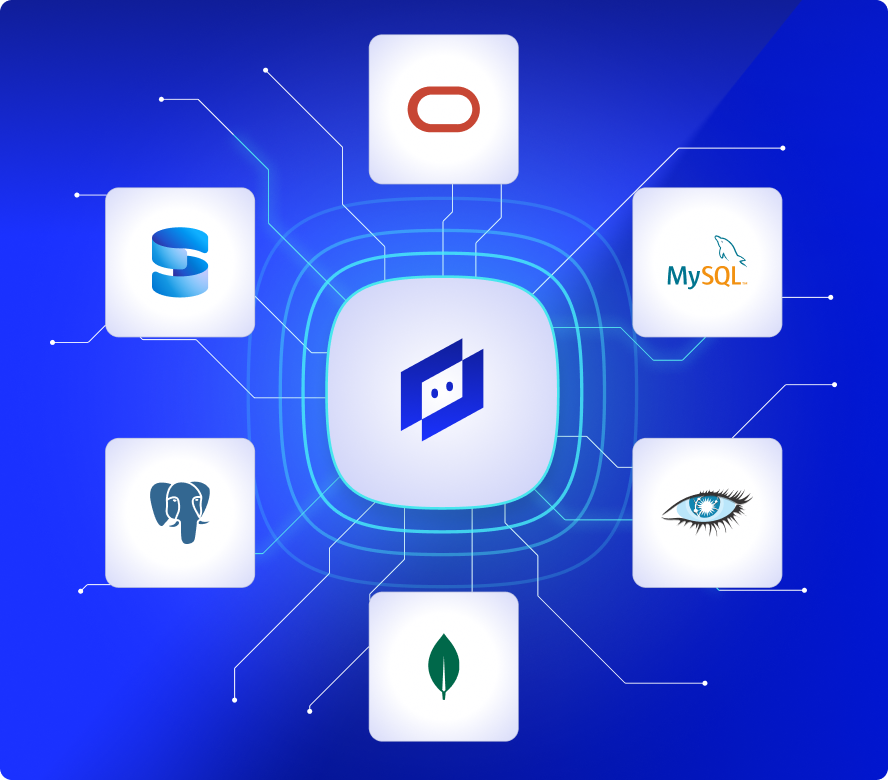
LM Envision integrates with the most widely used relational and NoSQL databases, including Oracle, MySQL, Microsoft SQL Server, PostgreSQL, MongoDB, and Cassandra. Whether on-prem or in the cloud, you’ll get full visibility without installing agents or writing custom scripts.
100%
collector-based and API-friendly
3000+
integrations and counting
AI AGENT FOR ITOPS
Edwin AI: AI that brings clarity to database chaos
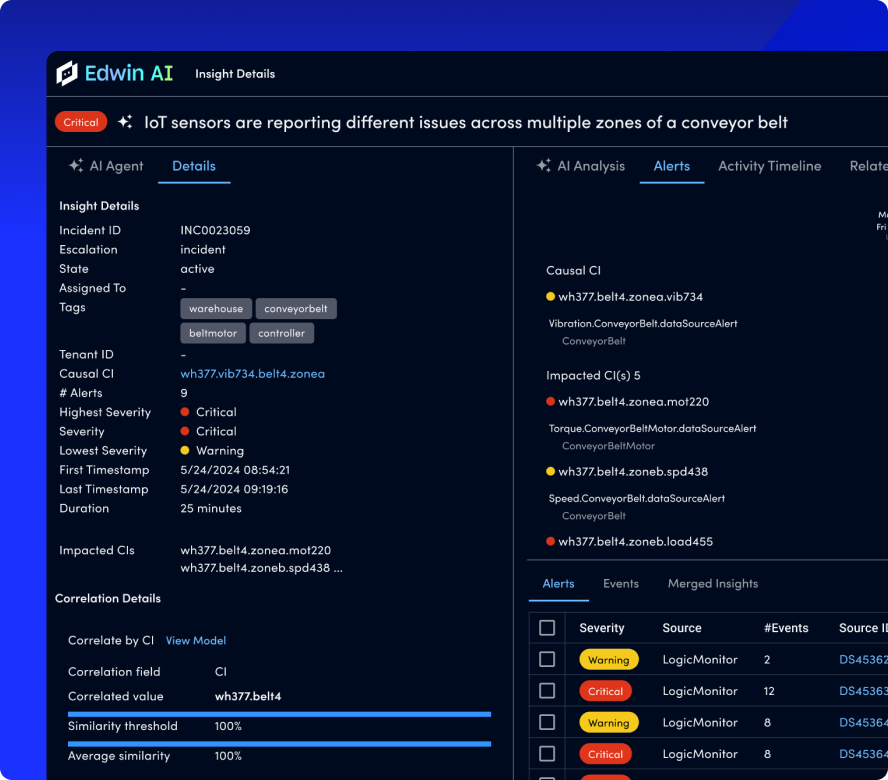
Edwin AI helps you stay ahead of database issues by automatically detecting anomalies, correlating performance trends, and summarizing incidents in plain language. Whether you’re investigating slow queries, connection spikes, or resource bottlenecks, Edwin surfaces root cause fast, so your team can focus on fixing, not digging.
67%
ITSM incident reduction
88%
noise reduction
“Edwin AI cut noise by 90% & ITSM incidents by 76%, enabling better customer service.”

“The single pane of glass across all of our regions enables us to act more proactively.”

“Edwin AI delivered value within an hour of implementation.”

“Capital Group has 1,000+ alerts/ day. LogicMonitor will eliminate that noise.”

“LogicMonitor is a valuable partner, constantly innovating and adapting to our business needs.”

BY THE NUMBERS
Database monitoring that delivers speed, stability, and visibility
GET ANSWERS
FAQs
Get the answers to the top database monitoring questions.
Which database platforms does LogicMonitor support?
LM Envision offers out-of-the-box support for Oracle, MySQL, Microsoft SQL Server, PostgreSQL, MongoDB, Cassandra, and more. You can monitor databases across hybrid environments—on-premises, in the cloud, or both.
Do I need to install agents or write scripts to start monitoring databases?
No. LM Envision uses a lightweight, agentless collector and built-in autodiscovery to monitor databases, without installing agents on individual hosts.
Can I monitor cloud-hosted databases like AWS RDS or Azure SQL?
Yes. LogicMonitor provides deeper visibility into cloud databases than native tooling, with metrics on throughput, query latency, connection counts, and resource utilization, alongside infrastructure context.
How does LogicMonitor help reduce false alerts and noise?
LM Envision uses anomaly detection and dynamic thresholds to learn what’s normal in your environment. This reduces false positives and ensures your team is only alerted when something truly impacts performance or availability.
Can LogicMonitor help us correlate database performance with infrastructure or application issues?
Absolutely. LM Envision unifies database, application, network, and infrastructure metrics into a single platform, so you can understand exactly where slowdowns originate and resolve them faster.
How fast can we get up and running?
Most teams begin monitoring databases in minutes. With agentless onboarding, prebuilt dashboards, and out-of-the-box support for top platforms, setup is fast and painless.
