Covering your bases: three ways to achieve network visibility
Explore some common challenges that network ops teams face and discuss how LogicMonitor’s platform-based approach is designed to unify teams, data, and end users.
There’s an old adage that says happy employees equals happy customers. Reputable magazines like Forbes, Harvard Business Review, and Entrepreneur have dedicated significant brainpower to dissecting this concept, and customer success leaders acknowledge its truth. Just as in business, a little “self care” in IT will go a long way. Fixing customer-facing problems will always come first, but in order to better serve those customers, network ops teams need to be equipped with the best data and the clearest picture of their infrastructure 24/7. They need full visibility to be able to minimize network service issues and optimize the customer experience. In this blog, we’ll explore some common challenges that network ops teams face and discuss how LogicMonitor’s platform-based approach is designed to unify teams, data, and end users.
Daily struggles: does a “green light” on your dashboard really mean everything is good?
On a typical day, your network engineers make upgrades and modifications to network access. Imagine adding a new router to expand capacity and performance for increased traffic. Only a holistic view of your entire hybrid cloud infrastructure shared by the network team can confirm that everything is performing well and nothing outside the network was impacted. After routine network upgrades, your teams likely won’t ask for access to syslogs to ensure there were no warnings spikes or errors with interface status changes. A routine upgrade does not warrant the time it takes to check for any new single points of failure that should be communicated, and network traffic wouldn’t be analyzed to identify slowdown, latency, or extreme bandwidth usage.
Your tools should energize your daily routine. Just like you check yourself in the mirror before an important business meeting or first date, you should check your monitoring platform after each routine upgrade to make sure everything is working like clockwork. Your monitoring platform should show every impact to your network operations after every routine change, even the ones you didn’t think to check, so you can confidently scale your network. That confidence will go a long way, both for your internal team and for your end users.
Bigger blips: it should be easy to fix a network warning without shifting priorities
Your Citrix NetScaler VPX triggers a few warning alerts, but at first glance this isn’t a P1 issue so your team must decide whether or not to divert from your scheduled project. The alert shows a packet loss increase which could make it difficult for customers to access your application. You had no scheduled downtime, and you don’t see any obvious configuration issues. So you reboot the device to temporarily alleviate the packet drop issue, knowing this isn’t the permanent solution.
This scenario presents a few challenges that hinge on a lack of visibility. You can only look at the metrics to ensure there aren’t any major outages. A complex situation like this requires full visibility into every network pathway with access to network traffic views and syslog data, correlated to the rest of your infrastructure, which is usually too time-consuming to access. Shouldn’t you be able to easily resolve any warning with clear troubleshooting workflows without making tradeoffs? Solving these network hiccups shouldn’t be an “either/or” tradeoff scenario; it should be a “yes/yes.” A unified monitoring solution should offer access to network metrics and logs for every monitor resource for streamlined troubleshooting workflows.
Your team supports a critical Windows application in an Azure VM that fails. The app stops responding to client requests, causing network congestion and packet drops. The SD-WAN controlled network also experiences disruptions and a dip in performance, making it worse for customers. Your monitoring dashboard lights up with alerts, and your support team receives more customer calls.
Full visibility across your hybrid cloud environment stops being a “nice to have” when a server failure blindsides your customers. As network operations extend beyond data centers to cloud-managed technology, integrating and connecting performance across every IT device and cloud service within a modern monitoring platform becomes critical to closing the visibility gap and reducing risk.
LogicMonitor’s unified platform lets network operations teams take complete control of their infrastructure to ensure that routine upgrades, network warnings, or critical incidents have minimal impact on the customer. Let’s look at three ways LogicMonitor mitigates these risky scenarios.
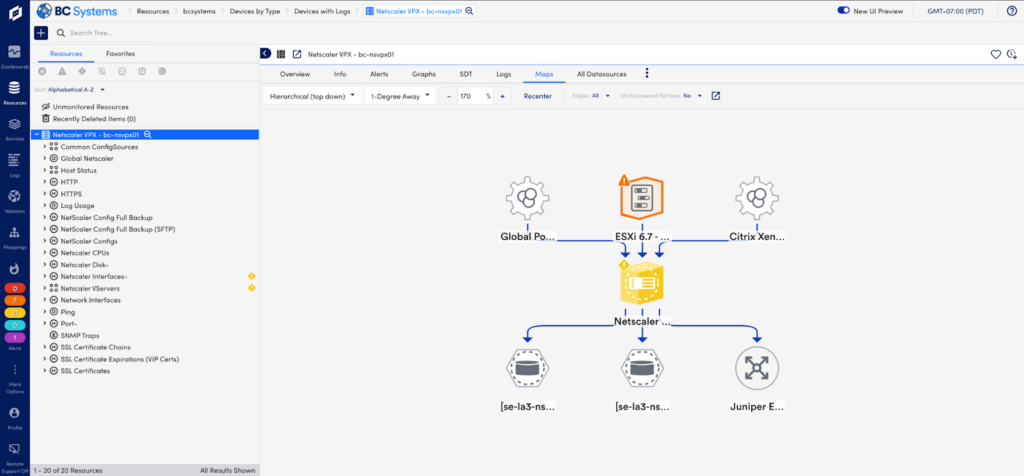
LogicMonitor’s topology mapping dynamically covers your network and the connected devices
Comprehensive network visibility
LogicMonitor discovers everything you need to know about your network. Within minutes you’ll have the monitoring, alerting, and graphs you need to maintain and optimize network infrastructure. Get the coverage you need for even the most complex networks – whether on-premises, spread across data centers, or hybrid and multi cloud managed SD-WAN devices.
Visualize your network with auto-generated topology mapping. LogicMonitor discovers and maps the relationship between critical infrastructure resources. An ongoing network discovery checks for the latest configuration and groups devices together in meaningful, dynamic groups within your platform.
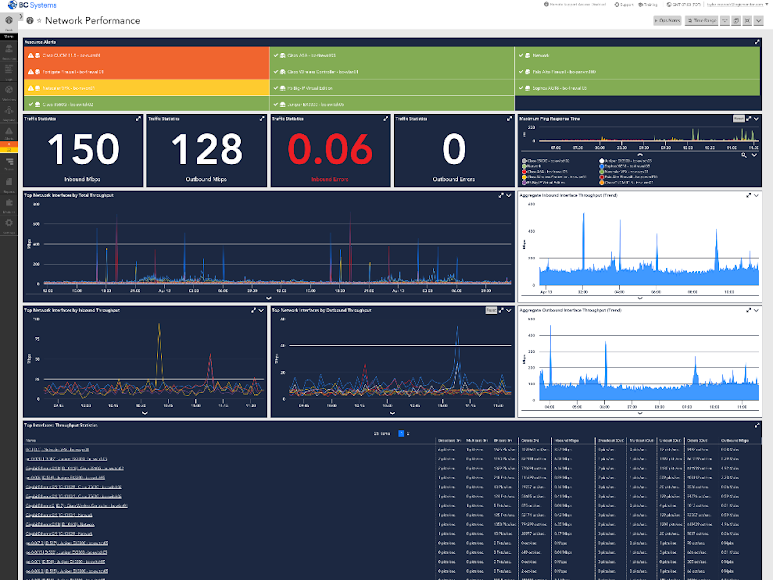
Out-of-the-box dashboards visualize network availability, health, and performance
Shared view of the entire hybrid cloud infrastructure
LogicMonitor automatically creates at-a-glance status dashboards for each of your services, making it easier to share information and keep your team informed of performance and trends.
Increase visibility and combine data from across the entire infrastructure stack to create service-specific views and collaborate on troubleshooting with built-in integrations for IT service management tools like ServiceNow, incident notification tools like PagerDuty, and enterprise communication platforms like Slack and MS Teams.
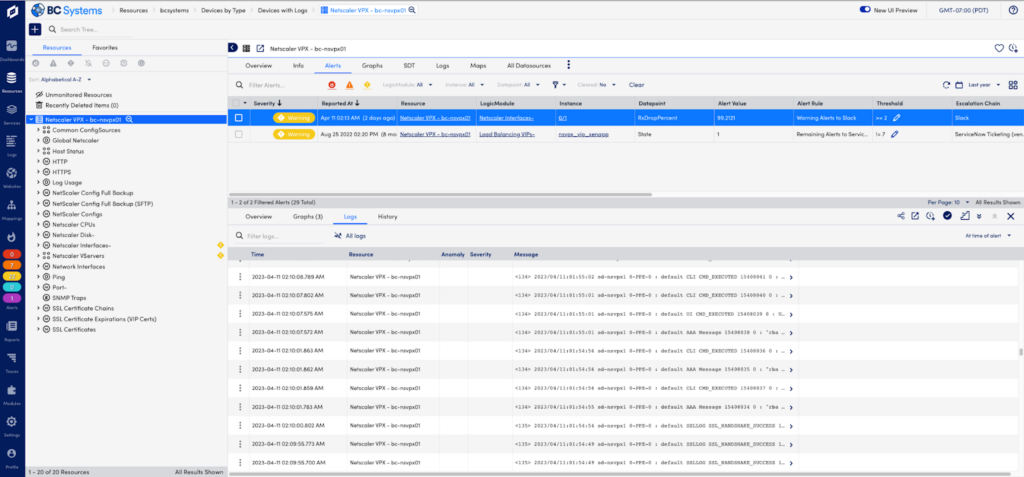
LogicMonitor automatically correlates log data with metric-based alerts
Network monitoring and troubleshooting workflows
LogicMonitor offers streamlined monitoring and troubleshooting workflows built for network teams. Access network syslog alongside metrics for every monitored device together in a single platform, with built-in anomaly detection for immediate insights
Metric-based alerts are sent to the right team with the right conditions to alert when an outlier needs investigation. Each alert offers an in-line view of network and IT logs with topology mapping showing the impacted devices.
We’re adopting that adage and modifying it for IT: empower teams with comprehensive visibility across your network, infrastructure, cloud, and apps to troubleshoot faster, reduce risk, and keep customers happy. Consider the visibility gaps you may have across your entire network operations and equip those teams with a single monitoring platform so they can collaborate to reduce MTTR and preserve your great brand experience. Get started with LogicMonitor.
Disclaimer: The views expressed on this blog are those of the author and do not necessarily reflect the views of LogicMonitor or its affiliates.