Clear and efficient IT resource management with Resource Explorer
Discover how LogicMonitor's Resource Explorer revolutionizes infrastructure monitoring tools by offering a more efficient way to manage and visualize your hybrid cloud environments.
Resource Explorer, part of LogicMonitor Envision platform, is an innovative resource management and visualization tool that helps you navigate the ever-growing number of resources in your hybrid cloud environments. In today’s dynamic IT landscape, where environments are increasingly complex and distributed, effective resource management is crucial. Resource Explorer addresses these challenges by providing a streamlined, centralized interface, empowering IT teams to efficiently manage and visualize their infrastructure.
The need for better resource management
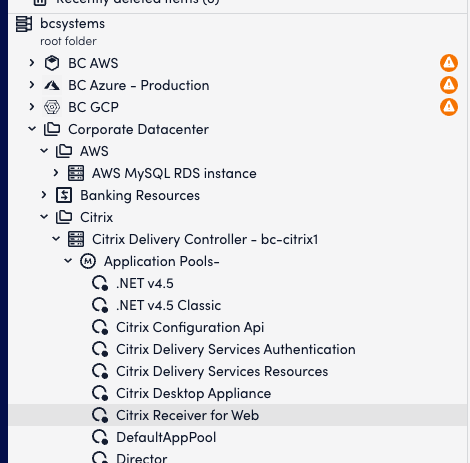
Previously, navigating resources in a portal involved using the Resource Tree, similar to the file/folder structure on your laptop. While the tree contains all resources, it requires deep organizational knowledge to know exactly where to navigate. The tree view—though not going away—is effective if you have a thorough understanding of all your systems. However, new users often lack this knowledge, making resource discovery time-consuming. Additionally, environments that change frequently add to the challenge of knowing exactly where to click.
The tree view, though trusted, can be inefficient for locating resources, especially when you don’t know the name of the resource you’re searching for. Resource Explorer solves this visibility and efficiency dilemma with a flat view of system resources that doesn’t require deep knowledge of the resources monitored. This capability is particularly useful in large, complex environments where resources are frequently added, modified, or removed, making traditional hierarchical views cumbersome.
Key benefits of Resource Explorer for IT resource management
Resource Explorer simplifies resource management by offering a centralized, visual interface that reduces the need for deep system knowledge, making it accessible to both new and experienced users. Here are some of the key benefits:
Identify performance patterns: Are today’s top performance problems happening in one place or many? Resource Explorer’s ability to visualize patterns across different resource types and locations enables teams to quickly pinpoint the source of performance issues, reducing the time spent on troubleshooting.
Comparative resource performance: How are your resources performing compared to those owned by other teams? Resource Explorer provides a clear, comparative view of resource performance, helping teams identify potential inefficiencies or underperforming assets and enabling more informed decision-making.
Analyze active alerts: What are the common themes among systems with active alerts? Resource Explorer allows IT teams to group and analyze resources with active alerts, helping to identify recurring issues and streamline the resolution process.
Assess the impact of changes: How did the latest application upgrade affect performance? Resource Explorer’s tagging and filtering capabilities make it easy to assess the impact of recent changes, such as software upgrades, on overall system performance.
Determine the root cause: Is it really the network’s fault? By isolating resources and analyzing performance metrics, Resource Explorer helps teams determine whether network issues are to blame or if the problem lies elsewhere in the infrastructure.
How Resource Explorer works to optimize resource management
Think of Resource Explorer like a pivot table for your resources, which you can view any way you like. The ‘pivots’ are selected from tags (also known as properties) attached to your resources. A single resource may have 70 or more tags from which to choose. Tags may include a device’s location, owner, manufacturer, firmware version, application names, cloud region, and virtually anything else you can think of as metadata.
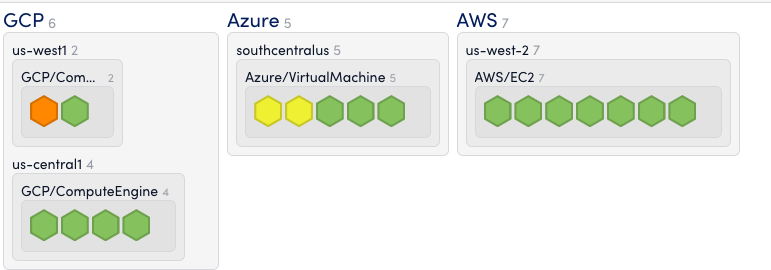
Resource Explorer displays on-prem and multi-cloud resources in a honeycomb format organized here by cloud provider, region, and service name.
These tags enable highly customized views of your environment, allowing IT teams to quickly filter and sort resources based on specific criteria. This flexibility is crucial in hybrid cloud environments, where resources are spread across multiple platforms and regions. For example, an IT administrator might use tags to view only those resources located in a specific cloud region, or to compare the performance of different application versions across the infrastructure.
Resource Explorer displays on-prem and multi-cloud resources in a honeycomb format organized here by cloud provider, region, and service name. This intuitive visual representation makes it easier to identify patterns and correlations, aiding in quicker decision-making and problem resolution.
Innovative problem-solving with Resource Explorer
Besides organizing and seeing your hybrid cloud resources in a single view, Ops teams can solve diverse problems using Resource Explorer, such as scenarios related to customer experiences. This tool goes beyond basic resource management, offering insights that drive strategic decisions across the organization. Resource Explorer can:
Display resource inventory: How many “things” are running in one part of my business compared to another? Resource Explorer’s inventory management capabilities allow teams to assess resource distribution across the organization, helping to identify potential areas for optimization or reallocation.
Discover if you have larger resources running workloads in one area compared to another similar area of your infrastructure. This insight is crucial for balancing workloads and ensuring efficient resource utilization across different departments or regions.
With this information, teams can make informed decisions about reallocating workloads, adjusting resource sizes, or redistributing applications across teams. These actions lead to better resource utilization, cost savings, and optimized infrastructure based on real-time data.
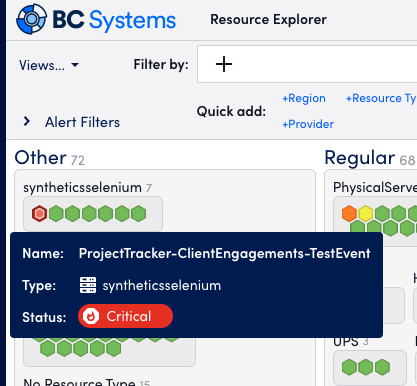
Isolate degraded application performance: Synthetics are directly tied to end-user experience. By analyzing synthetic monitoring data within Resource Explorer, teams can quickly isolate performance issues that impact user experience. This ensures that critical applications remain performant and reliable, enhancing overall service quality.
Synthetics can be visualized in Resource Explorer alongside other environments.
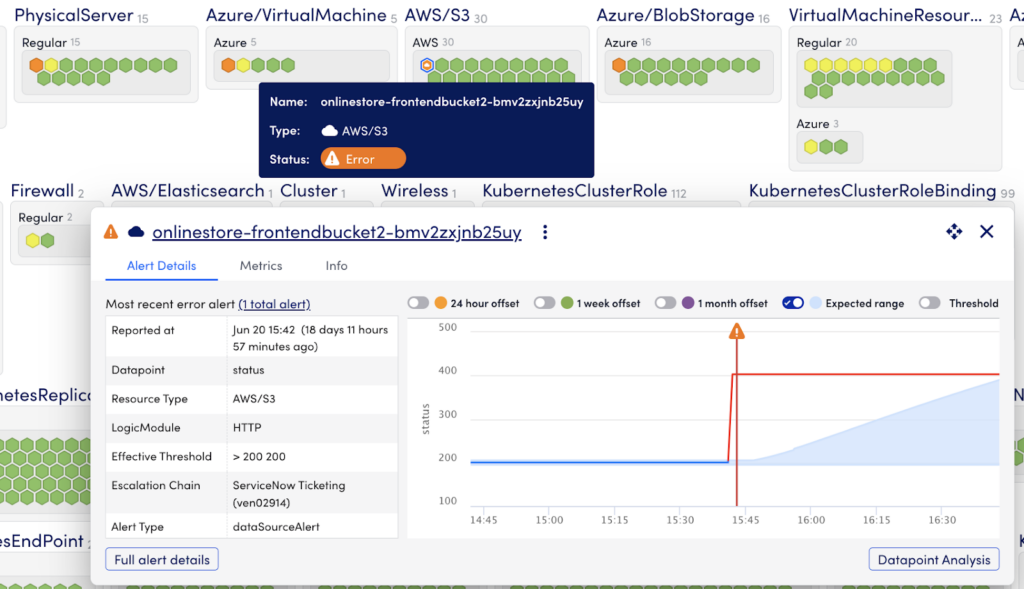
Provide context around a resource: Diagnosing an alert often requires additional information before a team can act. Resource Explorer allows users to quickly apply filters, pinpoint where issues are originating, and take action on resources that require immediate attention.
Clicking on a resource opens up additional context, such as metrics and tags, helping teams to identify root causes, prevent downtime, and maintain service continuity. This proactive approach enables faster issue resolution and sustained business availability.
Resources contain contextual details around the alert.
Key features of LogicMonitor Resource Explorer
Hybrid resource visibility
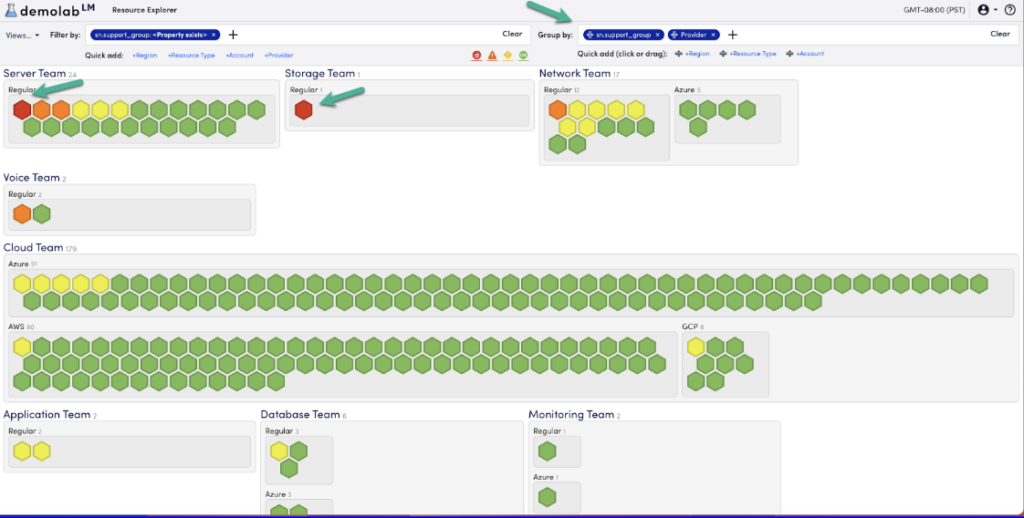
LogicMonitor provides an intuitive view of hybrid cloud resources that surfaces critical alerts when filters and groups are applied. In the example below, ServiceNow support groups are displayed along with the Provider for a complete view of hybrid resources whether they are located in a local datacenter (Provider=Regular) or in a Cloud Service Provider (Azure, AWS, GCP). This view lets users see that there are no critical alerts for resources managed by the Network, Voice, Cloud, Application, Database, or Monitoring Team. The user can focus on the two resources displayed as red hexagons owned by the Server and Storage Teams that require immediate attention.
Property normalization
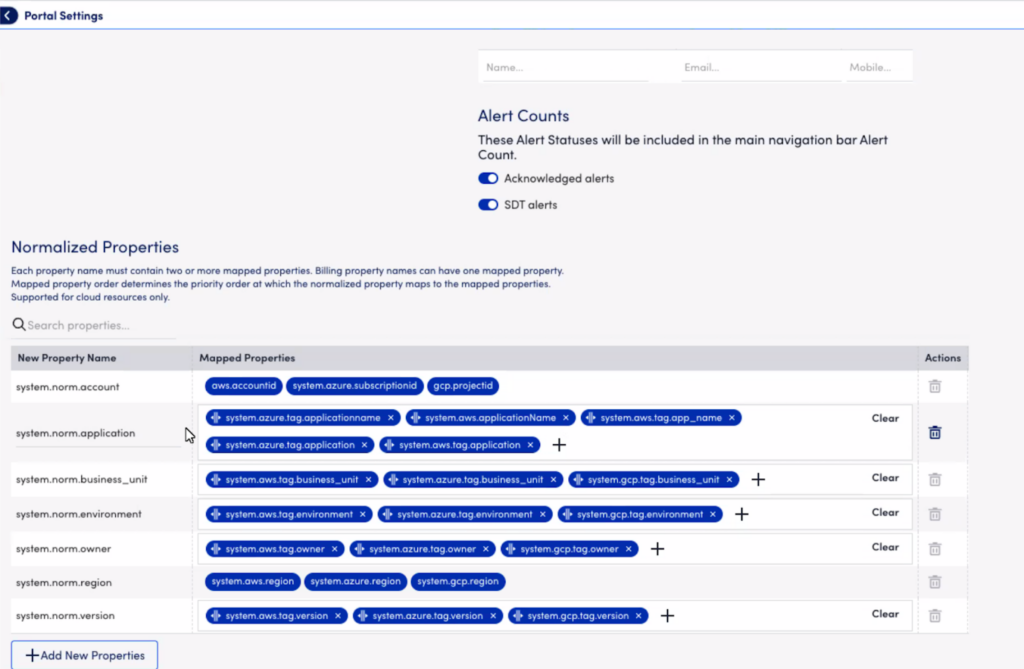
While other vendors have resource visualization tools, LogicMonitor displays the tags across ALL hybrid and multi-cloud environments. This means on-prem and cloud resources can be organized in a single unified format. LogicMonitor features a “normalizing” system that simplifies user organization. This makes multi-cloud resource organization incredibly easy and fast.
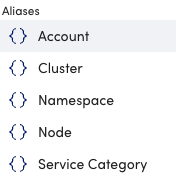
For example, a tag in Azure might be called system.azure.application_name, and a similar resource in AWS might be called aws.appname. CMDB data may use a different naming structure. LogicMonitor normalizes all these names into an “alias” called Application Name. Aliases noted in the portal can be found with { } brackets. Users can create and manage additional aliases.
Aliases help group multi-cloud tags into normalized aliases for easier resource organization.
Flexible organization options
Additionally, Resource Explorer lets users organize resources by ANY tag or property, including inherited properties. They can be organized by owner, location, name, or other tags in the system. This is helpful for those who lack deep knowledge of an environment.
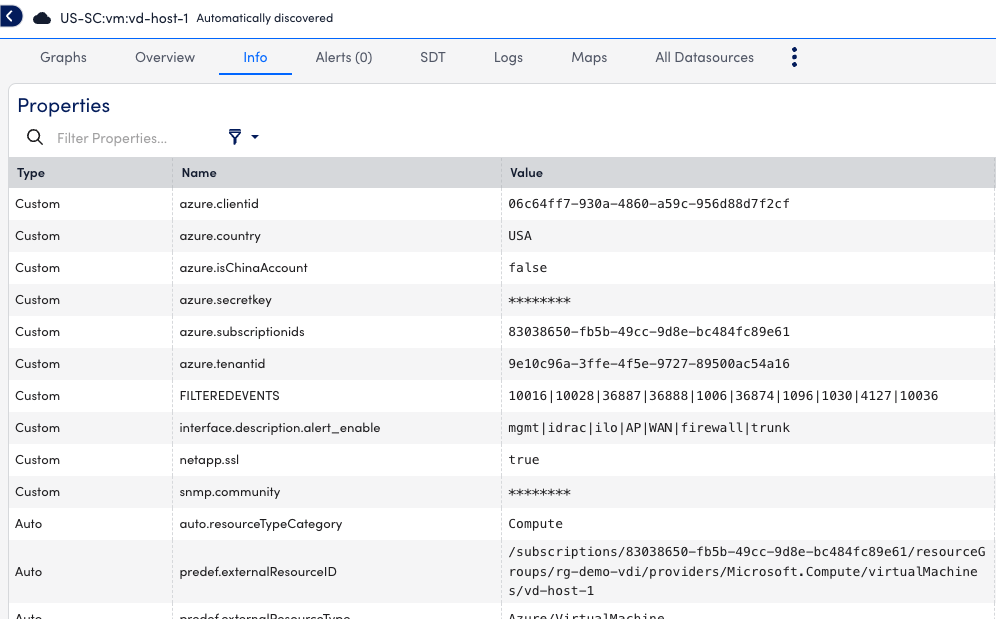
For example, an Azure resource might have over 70 different tags or properties as metadata. This is a rich source of context and correlation to solve problems, and visually organizing resources together quickly sheds light on patterns and makes discovery easier.
Sample Azure tags/properties are organized in the Info tab.
Start using Resource Explorer today
Resource Explorer helps Platform Engineering and CloudOps teams align on the same data to make better decisions. With LogicMonitor, your teams can easily visualize and organize hybrid multi-cloud resources on a single platform eliminating the need to switch between multiple windows or monitoring tools. This streamlined approach allows teams to quickly organize information, ensure optimal performance of migrated resources, and solve problems quickly. Contact us to learn how you can deploy better visualization and organization strategies across your hybrid multi-cloud environments with Resource Explorer.