Managing observability across hybrid and multi-cloud environments is like flying a fleet of planes, each with different routes, altitudes, and destinations. You’re not just piloting a single aircraft; you’re coordinating across multiple clouds, on-premises systems, and services while ensuring performance, availability, and cost-efficiency. AWS customers, in particular, face challenges with workloads spanning multiple regions, data centers, and cloud providers. Having a unified observability platform that provides visibility across every layer is critical.
This is where LogicMonitor Envision excels. Its ability to seamlessly integrate observability across AWS, Azure, Google Cloud, and on-premises systems gives customers a comprehensive view of real-time performance metrics and logs, such as EC2 CPU utilization or Amazon RDS database logs. Additionally, LM Envision delivers visibility before, during, and after cloud migrations—whether you’re rehosting or replatforming workloads.
Let’s dive into how LogicMonitor makes managing these complex environments easier, focusing on features like Active Discovery, unified dashboards, and Cost Optimization.
Key takeaways
Gain complete visibility into AWS, Azure, Google Cloud, and on-premises systems with a single platform, ensuring seamless monitoring of performance and availability across all environments.
Automatically detect and monitor new cloud resources in real-time with Active Discovery, eliminating blind spots and enabling faster incident response.
Utilize real-time cost optimization tools to identify underutilized resources, forecast cloud spending, and prevent budget overruns in multi-cloud setups.
Monitor every stage of your cloud migration journey, ensuring minimal downtime and optimal performance with real-time alerts and insights.
The challenge of hybrid and multi-cloud: Coordinating your fleet across complex skies
Hybrid and multi-cloud environments are like managing multiple aircraft, each with its own systems and control panels. AWS workloads, on-prem servers, and Azure or Google Cloud applications have their own monitoring tools and APIs, creating silos that limit visibility. Without a unified observability platform, you’re flying blind, constantly reacting to issues rather than proactively managing your fleet.
Working at LogicMonitor, I’ve seen many customers struggle to manage hybrid environments. One customer managed 10,000 assets across multiple regions and cloud providers, using separate monitoring tools for AWS, on-prem, and their private cloud. They described it as “trying to control each plane separately without an overall view of the airspace.” (The analogy that inspired this blog!) This led to constant reactive management. By switching to LM Envision, they eliminated blind spots and gained complete visibility across their entire infrastructure, shifting to proactive management—the dream for ITOps teams everywhere.
Active Discovery: The radar system for automatically detecting new resources
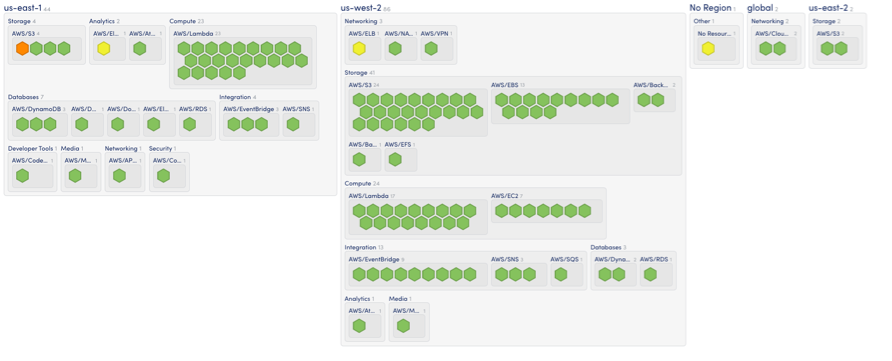
Think of your infrastructure as an expanding airport. New terminals (services), planes (instances), and runways (connections) are constantly being added or modified. Manually tracking these changes is like trying to direct planes without radar. LM Envision simplifies this by automatically discovering AWS resources, on-prem data center infrastructure, and other cloud providers like Azure and Google Cloud. This visibility provides a comprehensive real-time view across services like Amazon EC2, AWS Lambda, and Amazon RDS.
A view of AWS resources that have been auto-discovered and grouped by region, resource type, and service.
Now, think of LM Envision’s Active Discovery as the radar system that continually updates as new planes enter your airspace. For example, when you’re spinning up new AWS EC2 instances for a major campaign, you don’t have to worry about manually adding those instances to your monitoring setup. LM Envision automatically detects them, gathers performance metrics, and sends real-time alerts. It’s like flying a plane—LM Envision is the instrument panel, providing instant feedback so you can make quick decisions. You’ll always have a clear view of performance, allowing you to react immediately and prevent potential outages, ensuring smooth operations from takeoff to landing.
Unified dashboards: The control tower for complete IT visibility
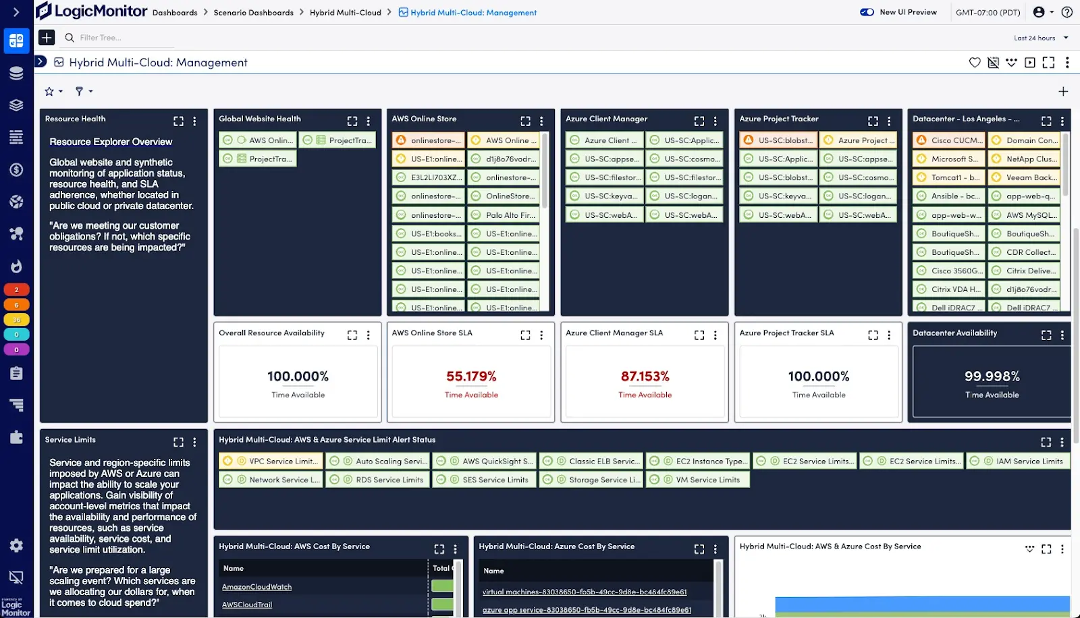
In any complex environment, especially hybrid or multi-cloud setups, visibility is key. LM Envision’s unified dashboards act like the control tower for your fleet, offering a single pane of glass across AWS, on-premises systems, Azure, and Google Cloud. These customizable dashboards allow you to track key performance metrics such as CPU utilization, database performance, and network latency across all your environments.
Combined AWS, hybrid, and multi-cloud workload performance in a LogicMonitor Dashboard
Think of these dashboards as your control tower. In a large airport, planes constantly land, take off, or taxi, and the control tower ensures everything runs smoothly. With LM Envision’s dashboards, you can monitor the health of your entire infrastructure in real time, from AWS EC2 instances to on-prem database health.
I’ve seen first-hand how these dashboards can transform operations. In one case, application latency spiked across multiple regions, but a customer’s traditional monitoring tools were siloed. They couldn’t easily tell if it was a network issue, a load balancer problem, or an AWS region failure. Once they implemented LM Envision, they built custom dashboards that provided insights into each layer of their stack, from the application down to the server and network level. When this issue happened again, within minutes, they isolated the root cause to an AWS load balancer misconfiguration in one region, drastically cutting troubleshooting time.
Cost optimization: The fuel gauge for efficient cloud spending
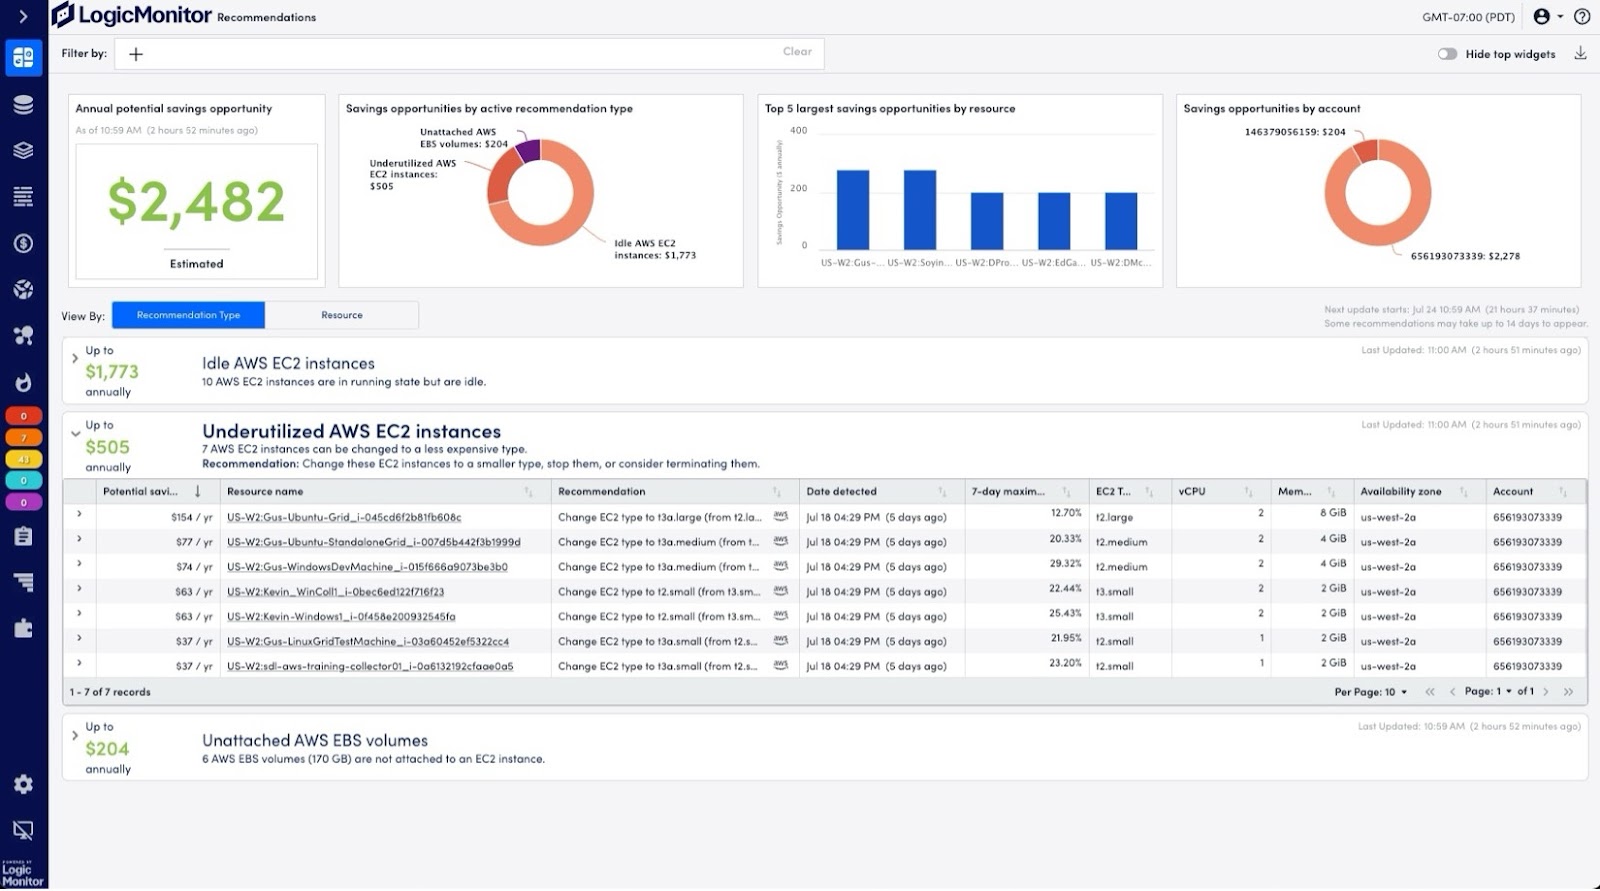
Managing costs in multi-cloud environments is like monitoring fuel consumption on long-haul flights—small inefficiencies can lead to massive overruns. AWS and Azure bills can quickly spiral out of control without proper visibility. LM Envision’s Cost Optimization tools, powered by Amazon QuickSight Embedded, provide a real-time view of your cloud spending. These dashboards enable you to identify idle EC2 instances, unattached EBS volumes, and other underutilized resources, ensuring you’re not wasting capacity.
AWS Recommendations Dashboard with LogicMonitor Cost Optimization
LogicModules—with over 3,000 pre-configured integrations for technologies such as HPE, Cisco, NetApp, and AWS services—help monitor your infrastructure for the latest efficiencies. This allows you to right-size your cloud infrastructure based on real-time usage data.
In fact, a customer identified thousands of dollars in savings by using LM Envision’s cost forecasting tools, which provided actionable insights into resource usage. It’s like ensuring your planes fly with just the right amount of fuel and optimizing their routes to avoid costly detours.
Monitoring cloud migrations: Navigating turbulence with real-time insights
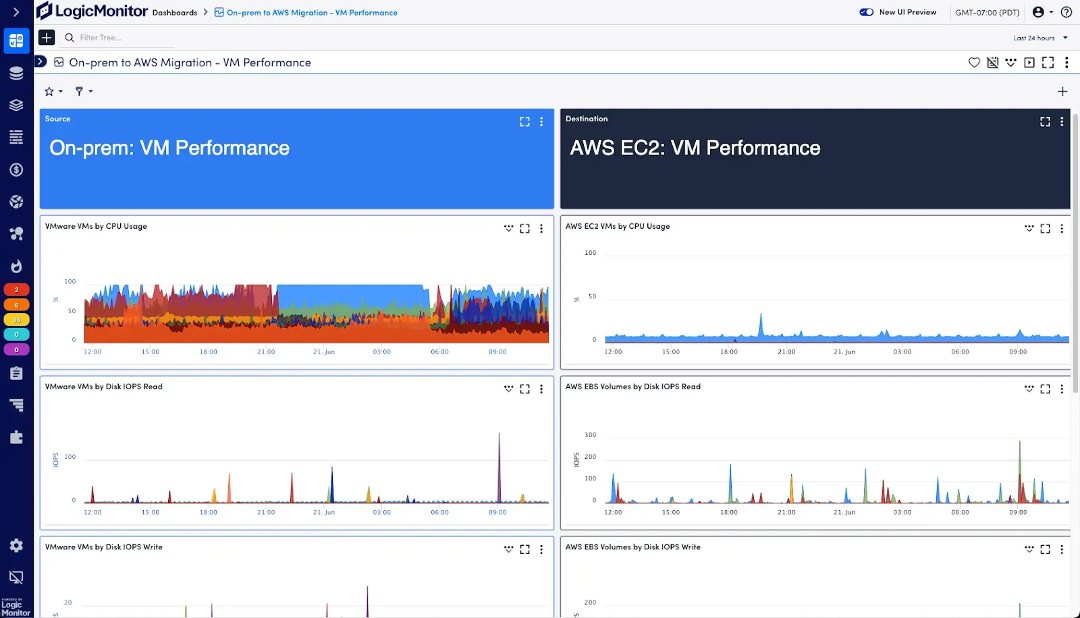
Cloud migrations can feel like flying through turbulence—downtime, cost overruns, and performance degradation are some common challenges. With LM Envision, you can monitor each step of the migration process, whether you’re rehosting or replatforming workloads to AWS.
I’ve seen multiple cloud migrations where resource usage spiked unpredictably. In one migration to AWS, a customer saw sudden increases in EC2 CPU usage due to unexpected workloads. LM Envision allowed them to monitor the migration in real-time and adjust instance types accordingly, avoiding major downtime. The system’s real-time alerts during migration help you navigate smoothly, much like flight instruments helping pilots adjust their routes during turbulence.
Wrapping up
Managing hybrid and multi-cloud environments is now the standard, and effective management requires an observability platform that scales with your infrastructure. LM Envision not only provides real-time visibility and cost optimization but also reduces complexity, making it easier for IT teams to manage distributed workloads proactively.
With LM Envision, you transition from being a reactive firefighter to a skilled pilot managing your fleet from the control tower. It ensures you keep your operations running smoothly, whether monitoring performance, scaling your infrastructure, or optimizing costs.