What do you see in the clouds?


Proactively manage modern hybrid environments with predictive insights, intelligent automation, and full-stack observability.
Explore solutionsExplore our resource library for IT pros. Get expert guides, observability strategies, and real-world insights to power smarter, AI-driven operations.
Explore resourcesOur observability platform proactively delivers the insights and automation CIOs need to accelerate innovation.
About LogicMonitor
Remember being a carefree kid? Laying down in a field on a warm spring day, gazing up at the sky, and imagining shapes in the clouds. Maybe you saw a lion or an elephant dancing across the sky. You felt grounded and safe, enjoying the breeze while listening to cheers from the football game in the distance.

But could you see the rain forming on the horizon threatening to distort your animal shapes and send the football team running for cover? Could you see the impending storm jolting your sense of security? Would it be a sprinkle or a downpour? How long will the rain last?
Fast forward to what those memories mean today. You’re leading migration and modernization across your IT environments, shifting workloads to the cloud, and monitoring your cloud activities while maintaining your on-premises deployments. You might be using CSP-provided monitoring tools from AWS or Azure or various tools to keep tabs on cloud and on-prem components. Your teams add new monitoring capabilities when implementing new solutions. Your teams might not know that they’re approaching utilization limits, incurring overages, or see impending outages. Locating the root cause of problems becomes challenging when you’re digging through multiple data points across different tools. You don’t know how long remediation will take.
Without a comprehensive monitoring platform that can derive insights from lots of data, the storm will surprise you, leaving you scrambling for solutions.

Now imagine laying down in the grass, but this time you’re armed with knowledge about weather patterns and trends that can help you predict a future downpour. You still see dancing animals in the clouds, but you know about the impending rain and exactly when and how it will stir your skies. You know how the cloud patterns will change, how long the football team should delay their game, when to dart home and stay dry, and when you can play outside again.
You have a plan.
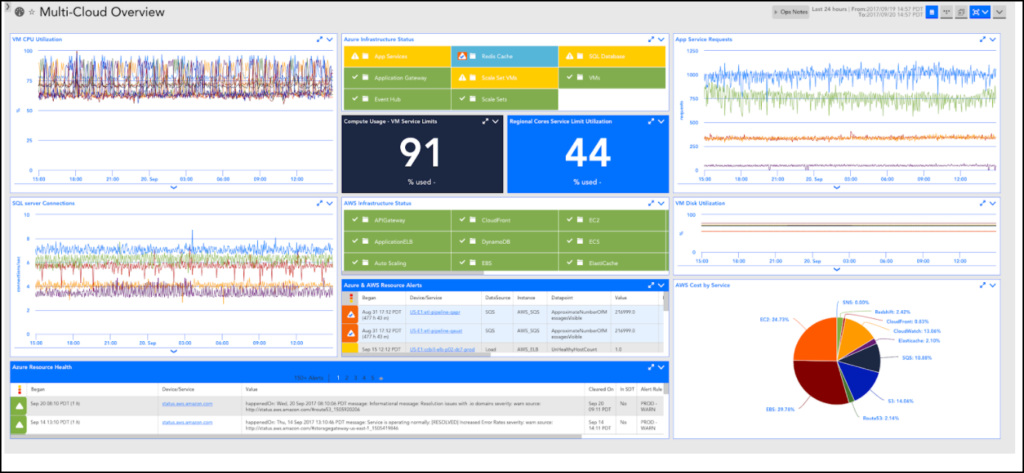
LogicMonitor helps you visualize your overall IT landscape. LogicMonitor allows IT and Cloud Ops teams to view on-premises and multi cloud deployments together, and quickly discovers and applies insights so you can act fast. You can gain both high-level and deeper contextual technical insights into AWS, GCP, and Microsoft Azure together with other infrastructure on one unified platform for hybrid cloud.

LogicMonitor’s cloud monitoring solution includes three crucial components to measure the overall health and performance of cloud infrastructure:
1. Resource Monitoring
2. Cloud Provider Availability Monitoring
3. Return On Investment (ROI) Monitoring
With LogicMonitor, you can monitor data for these three components alongside any monitored data for on-premises infrastructure using our auto-generated dashboards, making it easy to get started and see insights right away. LogicMonitor’s Cloud monitoring platform centralizes monitoring, alerting, and reporting and provides granular data retention up to two years.
Now, you can put your plans in action. Prevent outages, see utilization, spot overages, save time and money, and confidently migrate knowing that you can visualize your overall IT operations on one platform. We help you manage your existing IT infrastructure and efficiently manage your cloud deployments when your business grows.

Watch our demo to learn how you can reduce MTTR and gain additional context from AWS data alongside your on-premises resources.
© LogicMonitor 2025 | All rights reserved. | All trademarks, trade names, service marks, and logos referenced herein belong to their respective companies.
