

Virtual memory in Linux allows the operating system to use part of the hard disk as extra RAM, effectively creating the illusion of having more memory available, but before diving into monitoring techniques, it’s crucial to understand the basics of virtual memory. This process involves two key mechanisms: swapping and paging.
- Swapping: Entire processes are moved from RAM to disk when physical RAM memory is full.
- Paging: Only specific pages of memory are moved to disk, allowing more granular control over memory usage. More information about these mechanisms is available in The Linux Documentation Project’s guide on swap space. For a beginner-friendly explanation of swap space, see PhoenixNAP’s article on what swap space is and how it works.
LogicMonitor’s article What is Virtual Memory Anyway provides a deeper look into these concepts.
Key takeaways
Essential commands for monitoring Linux memory usage
Monitoring a system’s available memory is critical to ensuring it operates efficiently. Here’s how to get started:
1. Physical memory: free and top commands
Using the free command provides a quick snapshot of memory usage, including total, used, and memory allocation. The top command offers real-time memory usage stats, making it invaluable for ongoing monitoring.
[demo1.dc7:~]$ free -g
             total       used       free     shared    buffers     cached
Mem:            47         45          1          0          0         21
SaaS-based server view
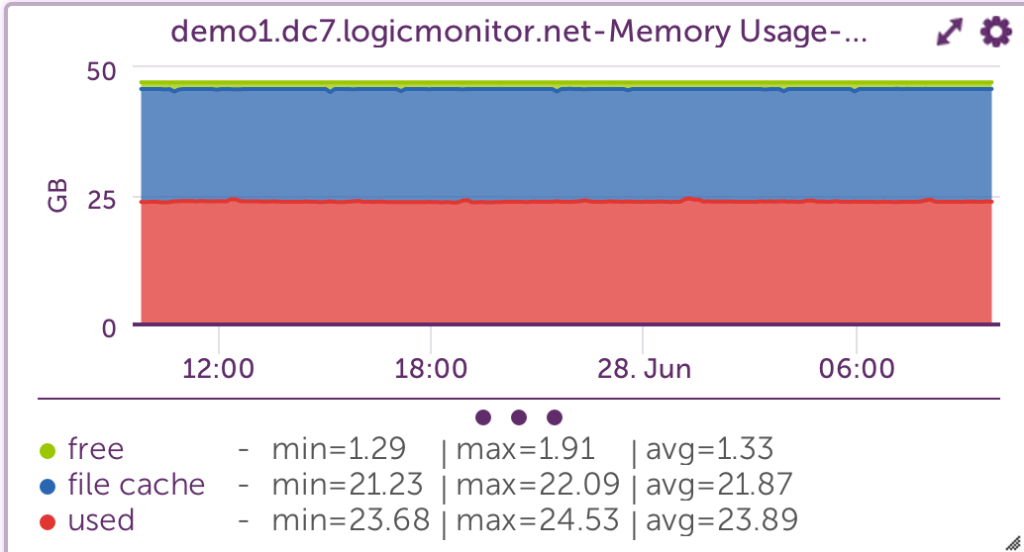
In Linux, ‘free memory’ is just memory that hasn’t found a purpose yet.
Linux uses all physical memory that is not needed by running programs as cache files. When programs need physical memory, the Linux kernel will reallocate a file cache memory to programs. So, memory addresses used by the file cache is free, or at least allocatable to programs, and serves its purpose until needed by another program.
It’s ok if all Linux memory is used, little is free, or is in use as a file cache. It’s better to have some file cache, except in these two instances:
- When running large Java programs where maximized heaps are necessary
- Needing databases, rather than the OS, to manage disk caching
As long as there is free virtual memory, and not active swapping, most systems will run efficiently with physical memory. More information about Linux memory is available in LogicMonitor’s blog article The Right Way to Monitor Linux Memory, Again.
2. Virtual memory usage: free -t command
Using free -t provides detailed information about swap memory usage, which is critical for understanding how much virtual memory is in use.
Example
free -t
[demo1.dc7:~]$ free -t
total used free shared buffers cached
Mem: 49376156 48027256 1348900 0 279292 22996652
-/+ buffers/cache: 24751312 24624844
Swap: 4194296 0 4194296
Total: 53570452 48027256 5543196
Monitoring view
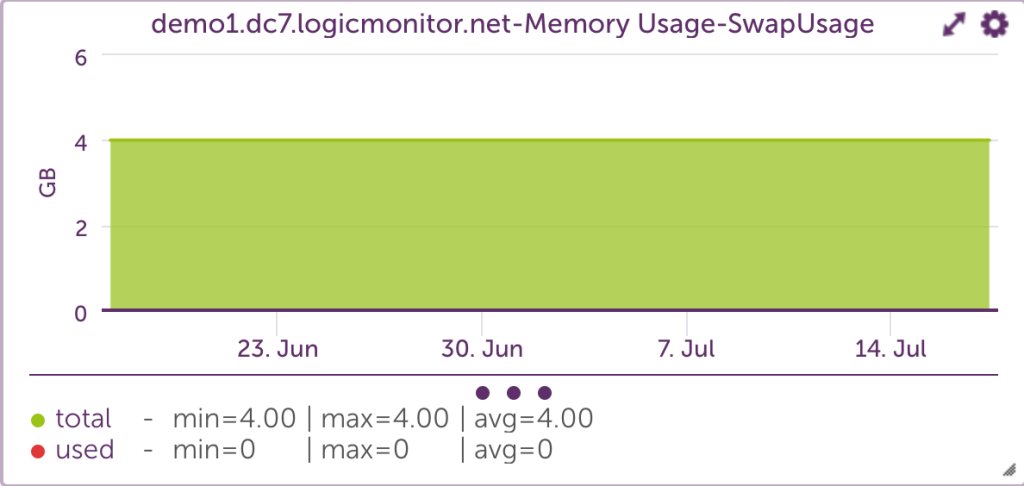
According to the outputs above, the system has used zero swap space. So, even though 90% of the total swap and physical virtual memory space is in use, the system never ran low enough on physical memory.
High swap usage can be dangerous, as it means the system is close to exhausting all memory. When programs need more main memory and are unable to obtain it, the Out Of Memory (OOM) Killer will begin killing processes based on the amount of memory initially requested, among other criteria. The server process, which sets the entire function of a server, will likely be one of the first to be killed.
While high swap usage is not recommended, low to moderate swap usage of inactive memory is no cause for concern. The system will shift inactive pages from physical memory to disk to free memory for active pages.
Knowing if swaps are being used is key to keeping usage low.
High swap usage isn’t just a warning sign; it’s a performance killer.
Monitoring virtual memory paging rate
One of the most critical indicators of memory issues is the rate at which memory pages are moved from physical memory to disk. This can be monitored using the vmstat command, specifically the si (pages swapped in) and so (pages swapped out) columns.
Example
vmstat
dev1.lax6:~]$ vmstat 1
procs -----------memory---------- ---swap-- -----io---- --system-- -----cpu-----
r  b   swpd   free   buff  cache   si   so    bi    bo   in   cs us sy id wa st
8 17 2422376 122428   2520  24436  952  676  1796   904 10360 4421 41  0 33 26  0
9 17 2423820 123372   2524  24316  732 1716   752  1792 12259 4592 43  0 25 32  0
8 17 2425844 120408   2524  25044  416 2204  1616  2264 14675 4514 43  0 36 21  0
7 19 2427004 120532   2568  25640  608 1280   764  1308 12592 4383 44  0 36 20  0
8 24 2428816 121712   2572  25688  328 1880   500  1888 13289 4339 43  0 32 25  0
Server monitoring view:
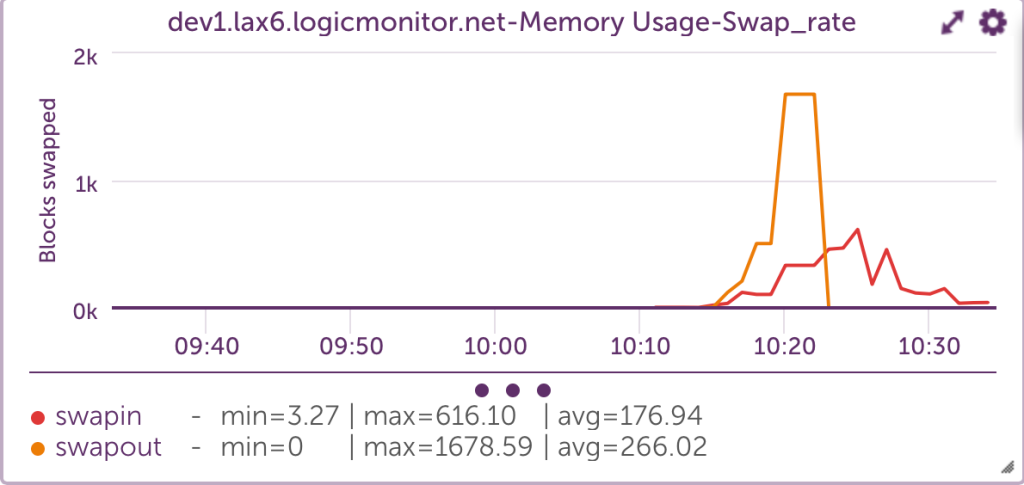
Swapping out a large number of blocks is the main indicator that a system is running low on memory. Swapping blocks at a high rate causes bottlenecks to performance because systems must look for needed codes on disk, rather than on physical memory, to run efficiently. This “hunt-and-switch” process slows performance.
In reviewing this graph, the sustained spikes in the page-in and page-out rates could be an indication of memory contention. Occasional spikes may be normal under heavy workloads, but frequent or prolonged activity often indicates the need to optimize memory usage, increase physical memory, or investigate memory leaks.
Additionally, the relationship between page-in and page-out rates can provide insight into system performance. For instance, a high page-in rate with a relatively low page-out rate may suggest that the system is successfully recovering from a temporary spike in memory usage. However, if both metrics are high over a long period, the system is likely thrashing — constantly swapping memory in and out, leading to performance issues.
Best practices for Linux memory management
To keep your system running efficiently, it’s essential to follow these best practices:
- Minimize swapping: Ddjust the swappiness parameter to reduce swapping frequency, especially on systems with ample RAM.
- Optimize swap space: Ensure swap space is appropriately sized for workloads.
- Monitor file cache usage: Understand that Linux uses available RAM for file caching, which can improve performance but may need adjustments depending on applications.
For more insights on how Linux manages memory, including tips on free memory and file cache, read LogicMonitor’s article More Linux Memory: Free Memory That Is Not Free Nor Cache.
“High memory usage in Linux isn’t a problem unless it leads to active swapping—what matters is how efficiently the system uses available resources.”
Conclusion
Monitoring and managing virtual memory effectively is crucial for maintaining optimal performance in Linux systems. By using the right tools and following best practices, IT managers can be confident that servers will handle even the most demanding workloads without missing a beat.
A full range of Linux monitoring resources is available on the LogicMonitor blog. In particular, LogicMonitor offers reliable Linux monitoring capabilities via SSH, which can collect critical metrics such as CPU, memory/shared memory, filesystem utilization, user space, uptime, and network throughput. This method is especially useful for systems where SNMP is not configured. LogicMonitor’s suite of DataSources allows IT managers to monitor Linux environments comprehensively without the need for special permissions or SNMP setup.
For more details on configuring SSH-based Linux monitoring, and how to import LogicModules for full coverage, explore LogicMonitor’s Linux (SSH) Monitoring package.


