LogicMonitor seeks to disrupt AI landscape with $800M strategic investment at $2.4B valuation to revolutionize data centers.

Learn More

Configuration Monitoring

LogicMonitor’s configuration monitoring allows you to view, monitor, manage and alert on device configurations all within a single platform. Correlate configuration file monitoring and storage with infrastructure performance across networks, data centers and customer locations.
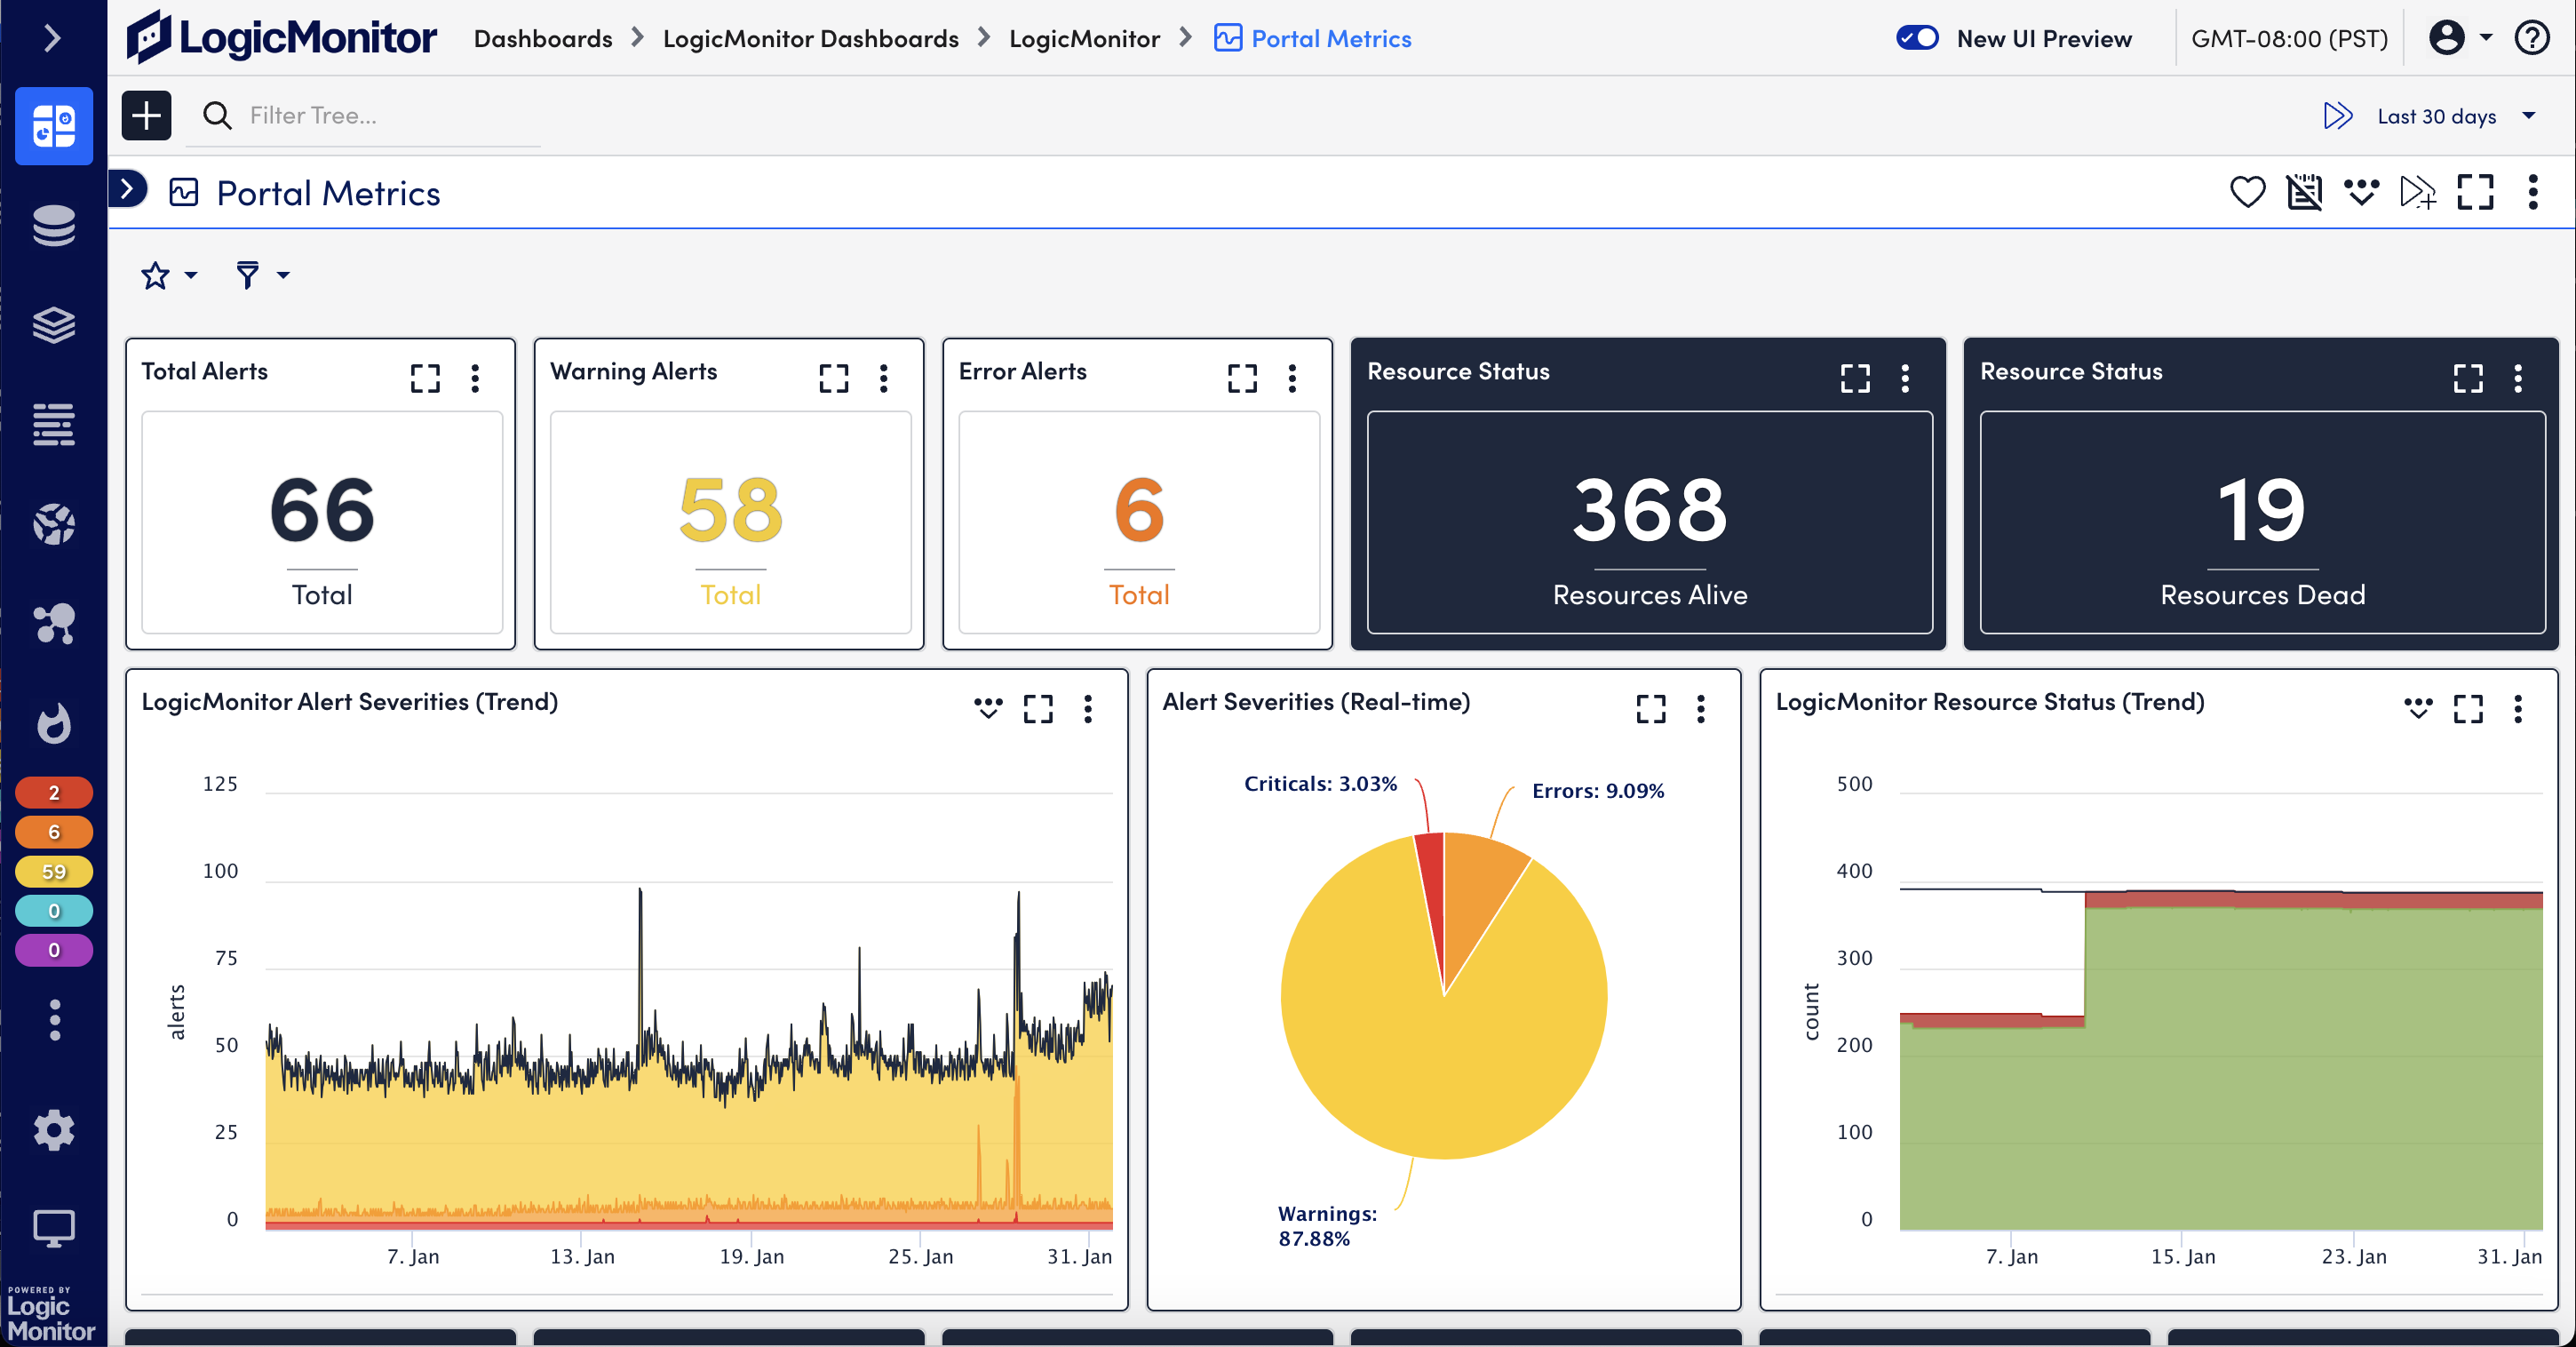
portal metrics dashboard

Configuration monitoring without the hassle

Configuration monitoring with LM Envision integrates configuration monitoring directly into LogicMonitor’s infrastructure platform using a combination of active discovery, change detection, customizable alert checks, and automatic storage of configuration file history. Out-of-the-box support for Groovy and Powershell scripts give visibility into performance and availability while speeding up service problem resolution and freeing up resources.
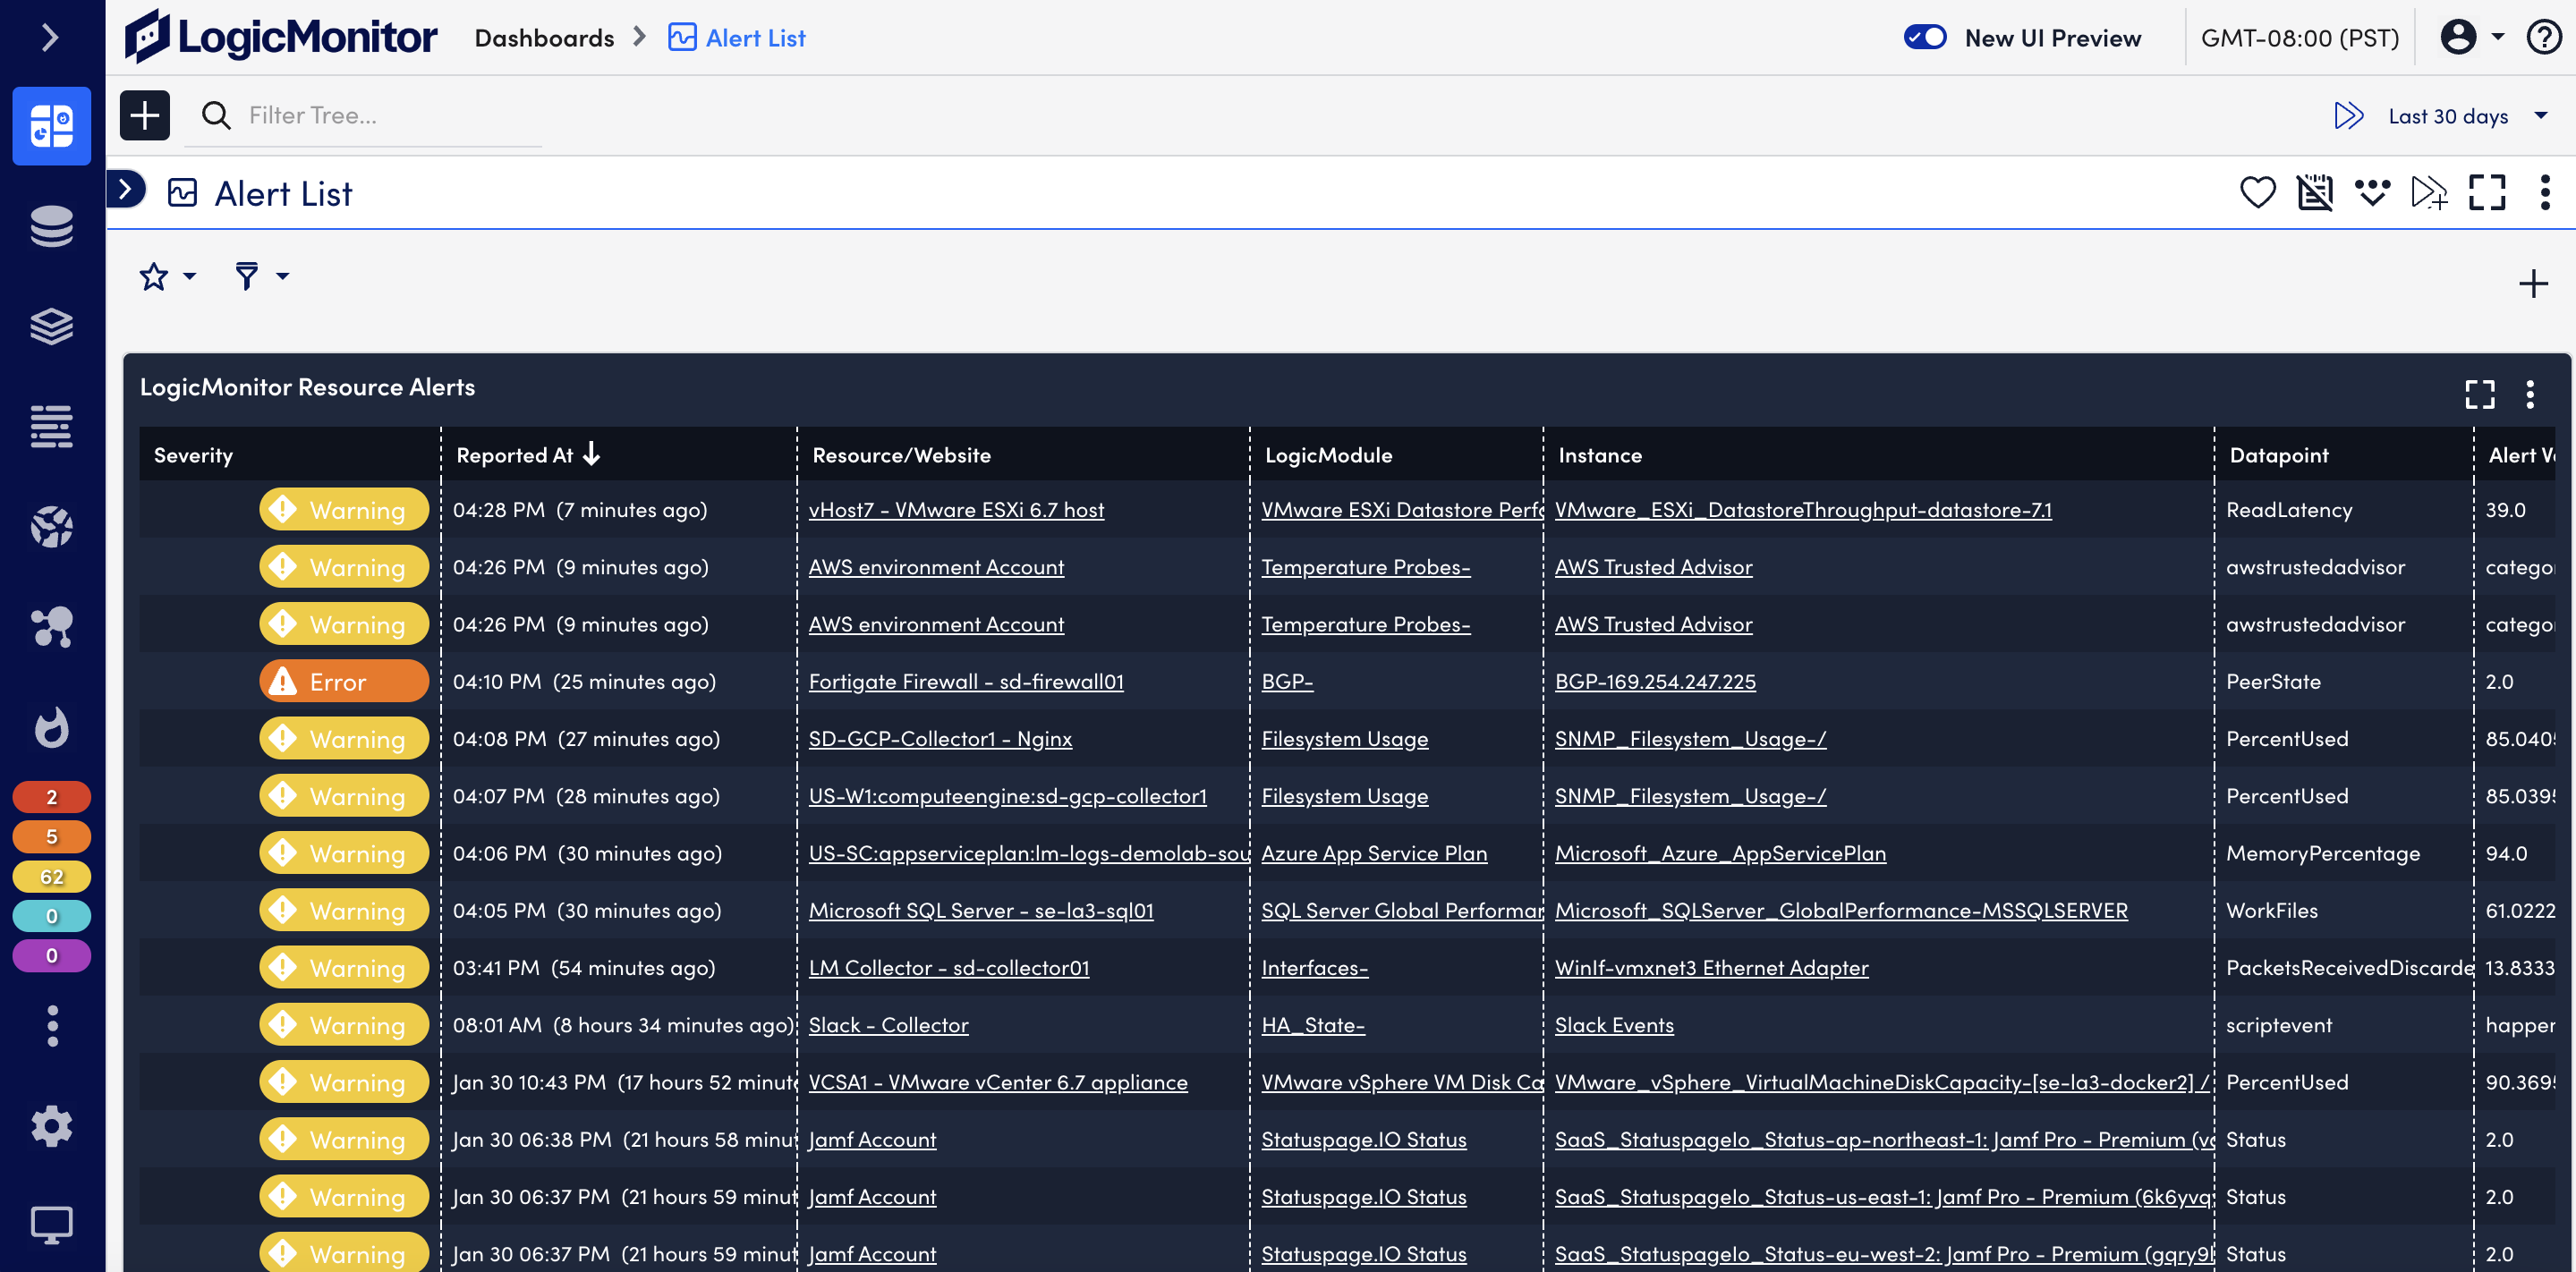
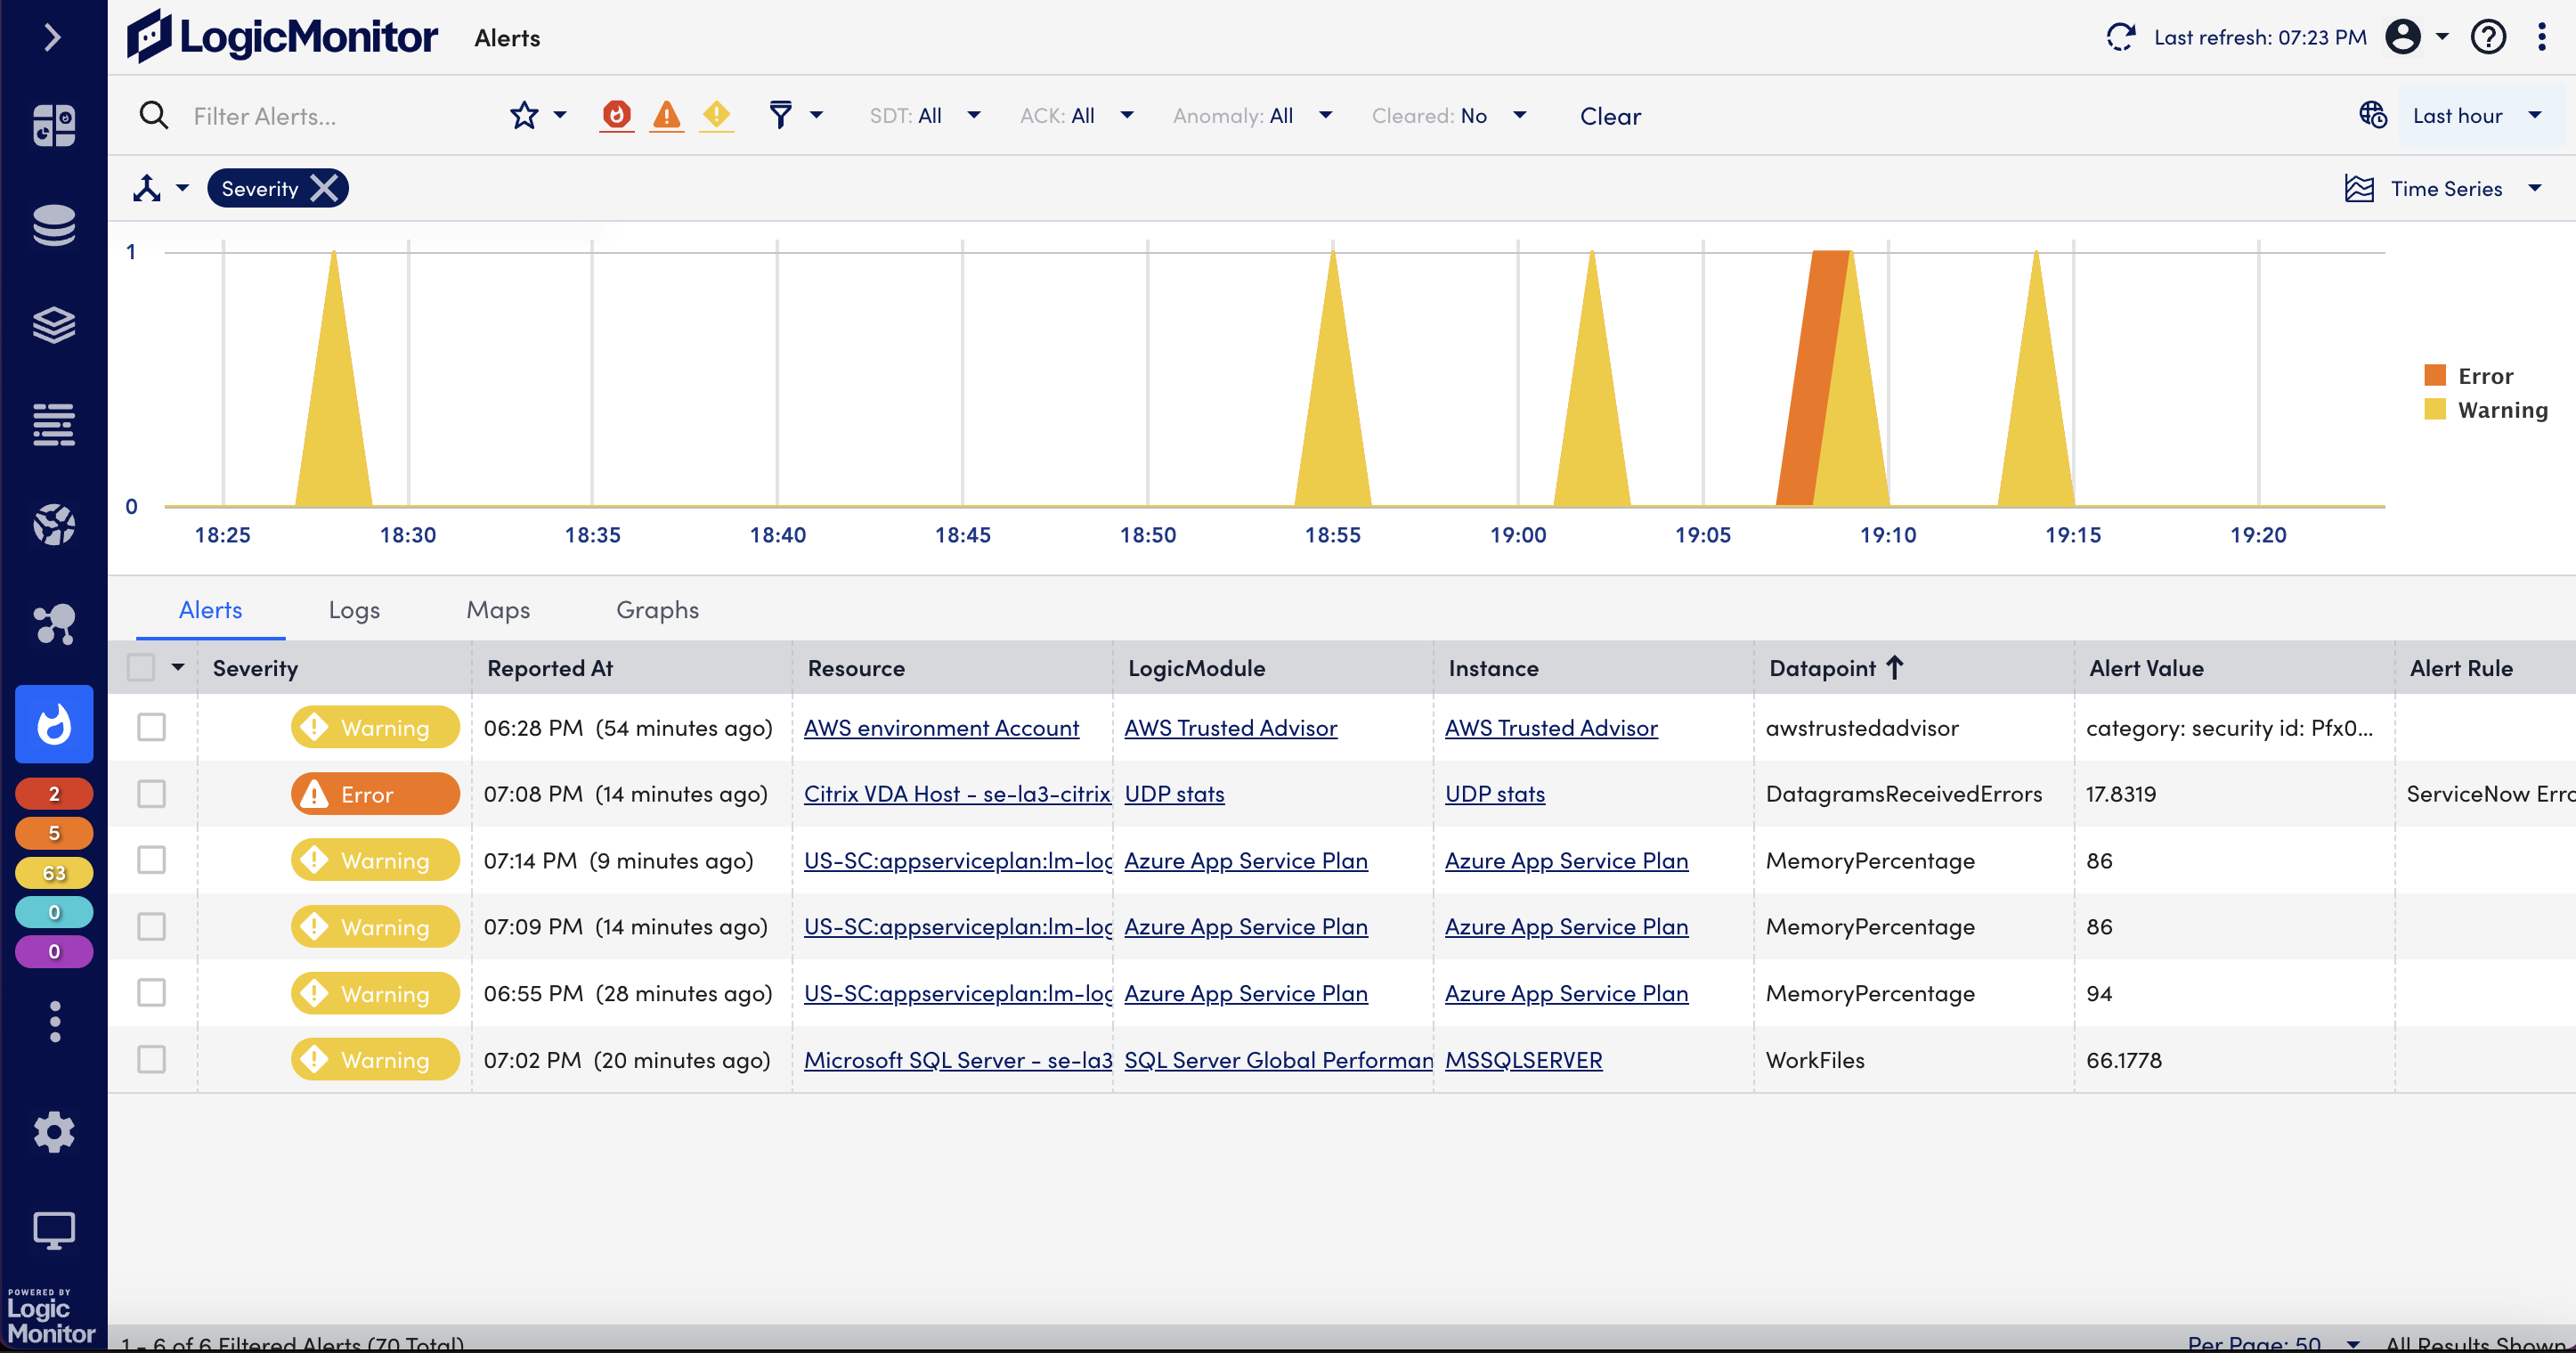
alert list

Understanding how it works

ConfigSources

ConfigSources (a type of LogicModule) tell a collector how to gather the configuration file from a particular device, how often to retrieve the file, and when to generate alerts using Groovy or PowerShell scripts.

ConfigChecks

ConfigSources use an “Applies To” expression to determine which devices are associated with the ConfigSource, an active discovery section to identify instances, and a collection section to retrieve device data. ConfigSources rely on ConfigChecks to determine when alerts should be generated.

Troubleshooting

Correlate any changes in your environment with device configuration files. With immediate alerts anytime a configuration file changes, troubleshooting becomes a focused an effecient process.

LM Config fits with the whole mindset of why iVision uses LogicMonitor in the first place: its flexibility.

GREG LASKEY NETWORK ANALYST/SECURITY, ECUMEN
string(5) "light"

Seamlessly correlate performance to configuration changes in your IT environment

  • Understand how infrastructure performance is affected by configuration changes to ensure the changes have the desired impact.
  • The LM Envision platform stores configuration files for up to one year, ensuring access to previous configurations regardless of device status.
  • Compare and download previous configuration versions; restore downloaded configurations via LogicMonitor or through the application of your choice.

Improve configuration management efficiency

Configuration monitoring doesn’t have to be difficult. Reduce your dependency on multiple device-specific tools. LM Envision collects, visualizes, and alerts on configuration devices across your entire environment.

  • Automatic discovery and storage for all device configurations
  • Seamlessly monitor changes to device configurations with intelligent alerting
  • Visualize resources and device changes across device types
  • Manage configurations with built-in automation and intelligence on a platform that scales and evolves with your business

Prevent outages and reduce MTTR with customizeable configuration alerts

Accelerate service problem resolution by correlating configuration changes with performance data. Use configuration alerts to reduce time spent troubleshooting config files.

    Customize alerts to ensure that any configuration changes are authorized and comply with security policies.
    View and manage configuration alerts, differences, and history alongside device performance metrics.
    Easily identify when a configuration change is related to a health or performance issue on a dependent device.
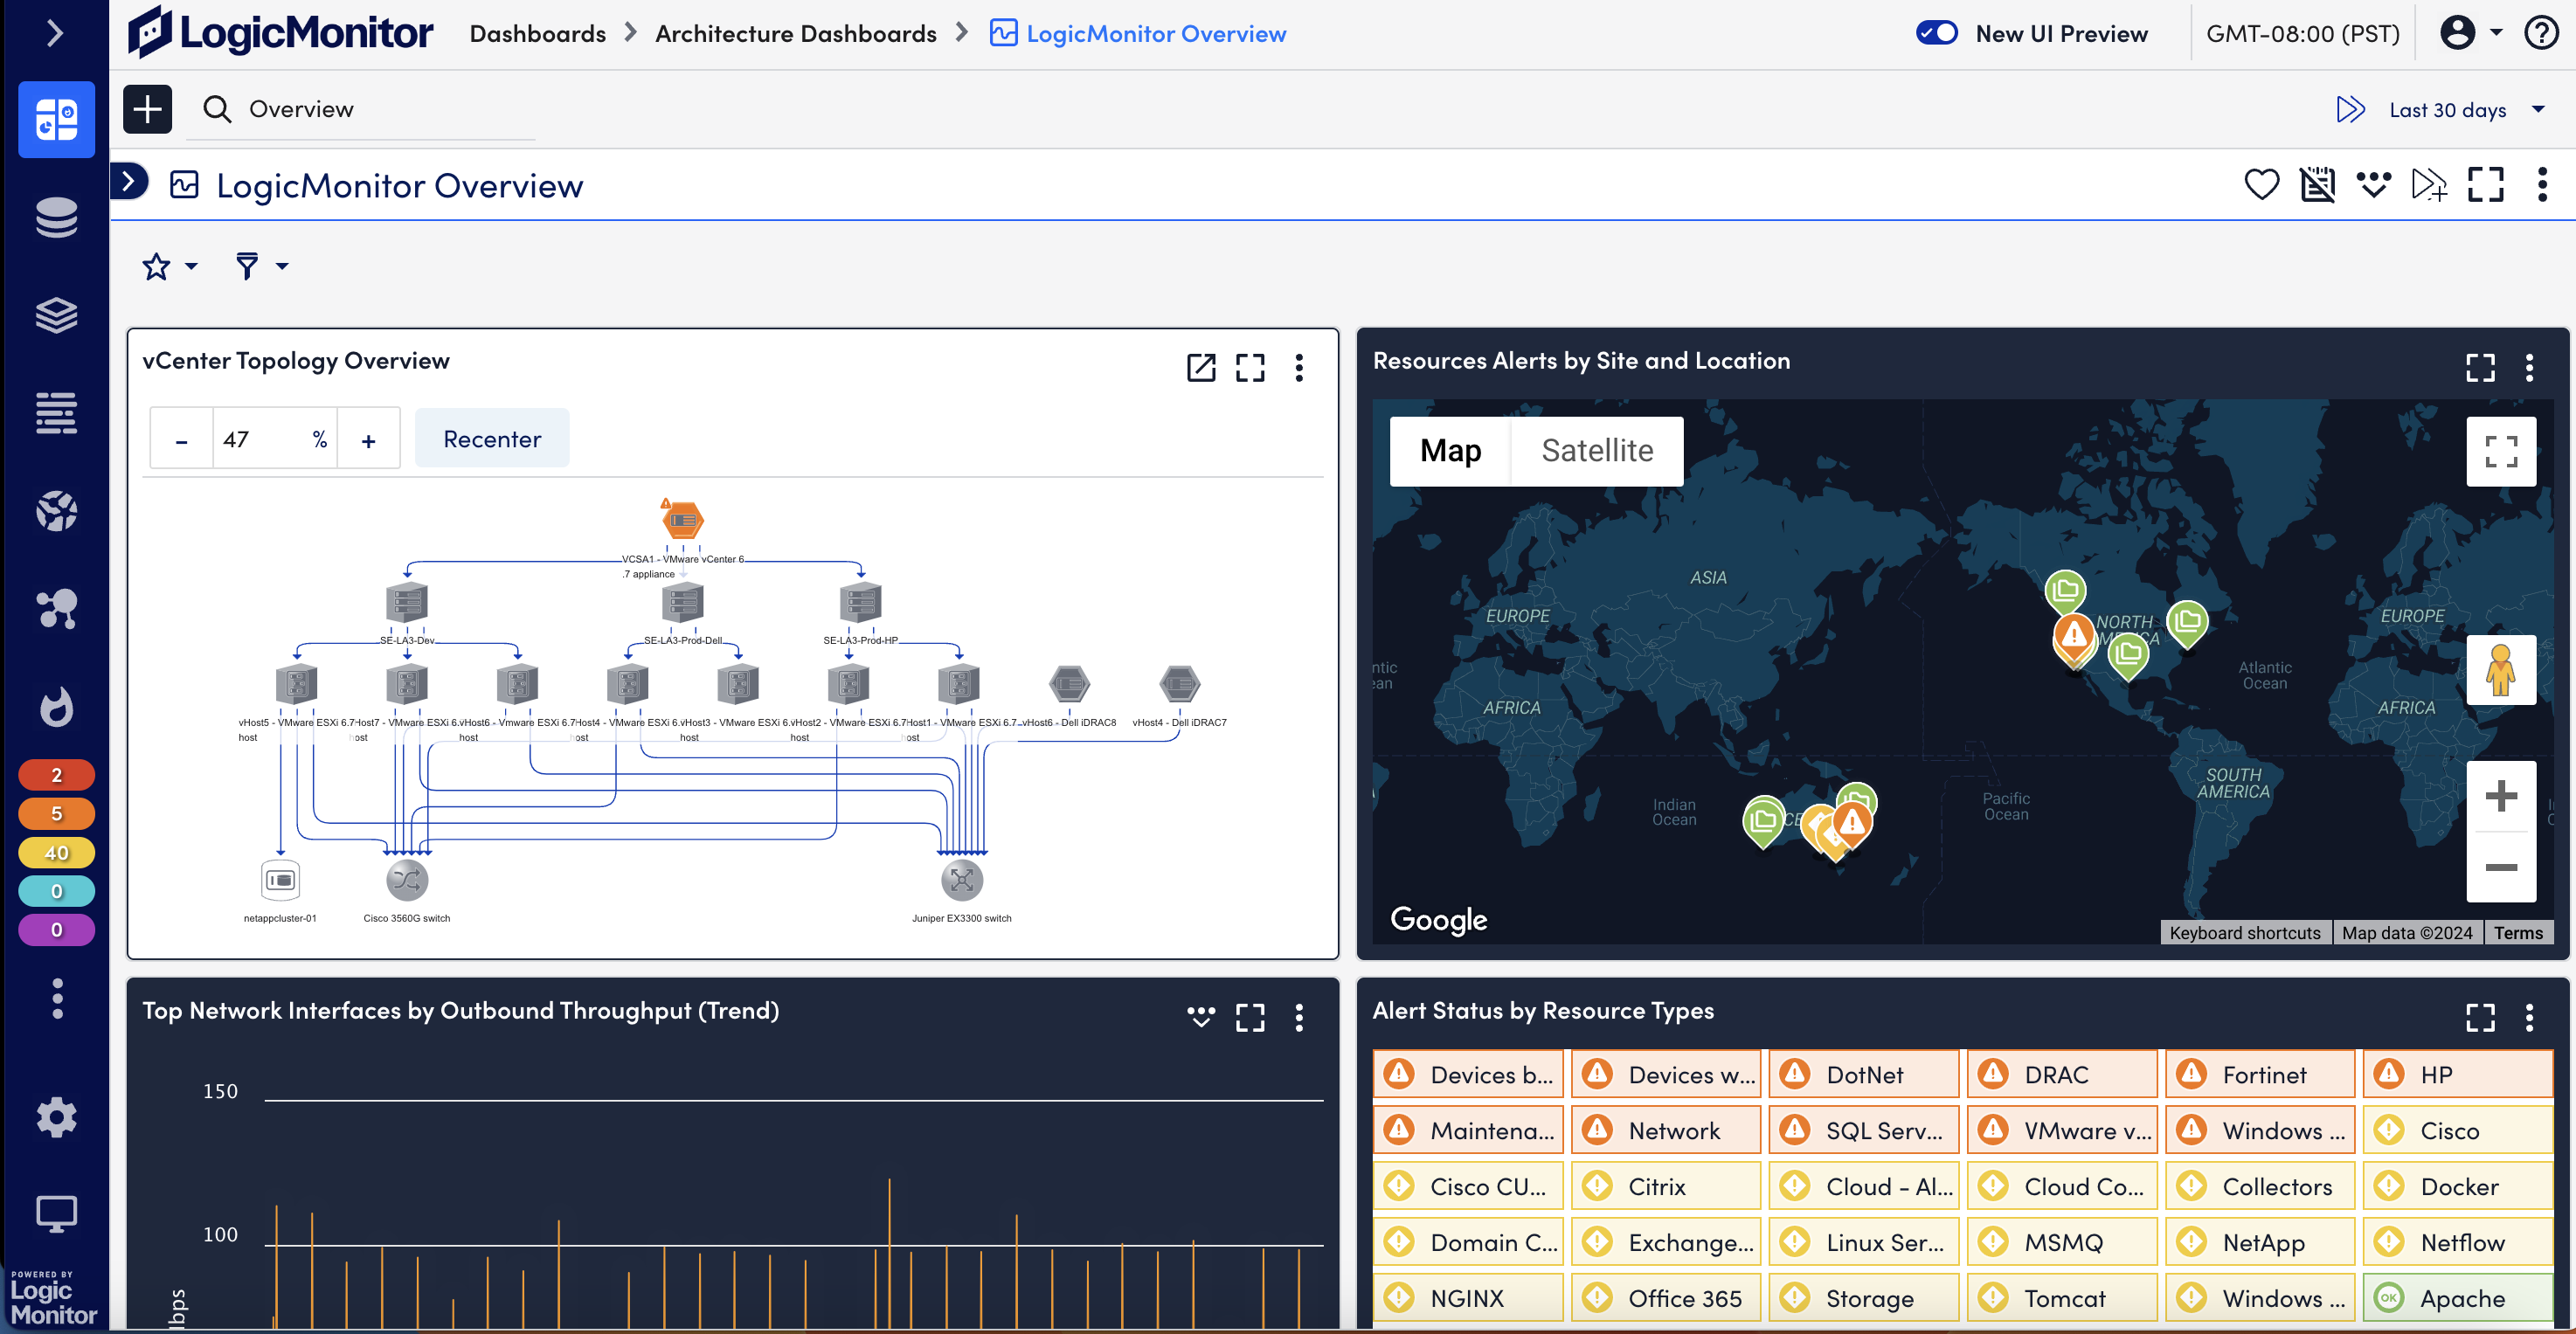
logicmonitor overview dashboard
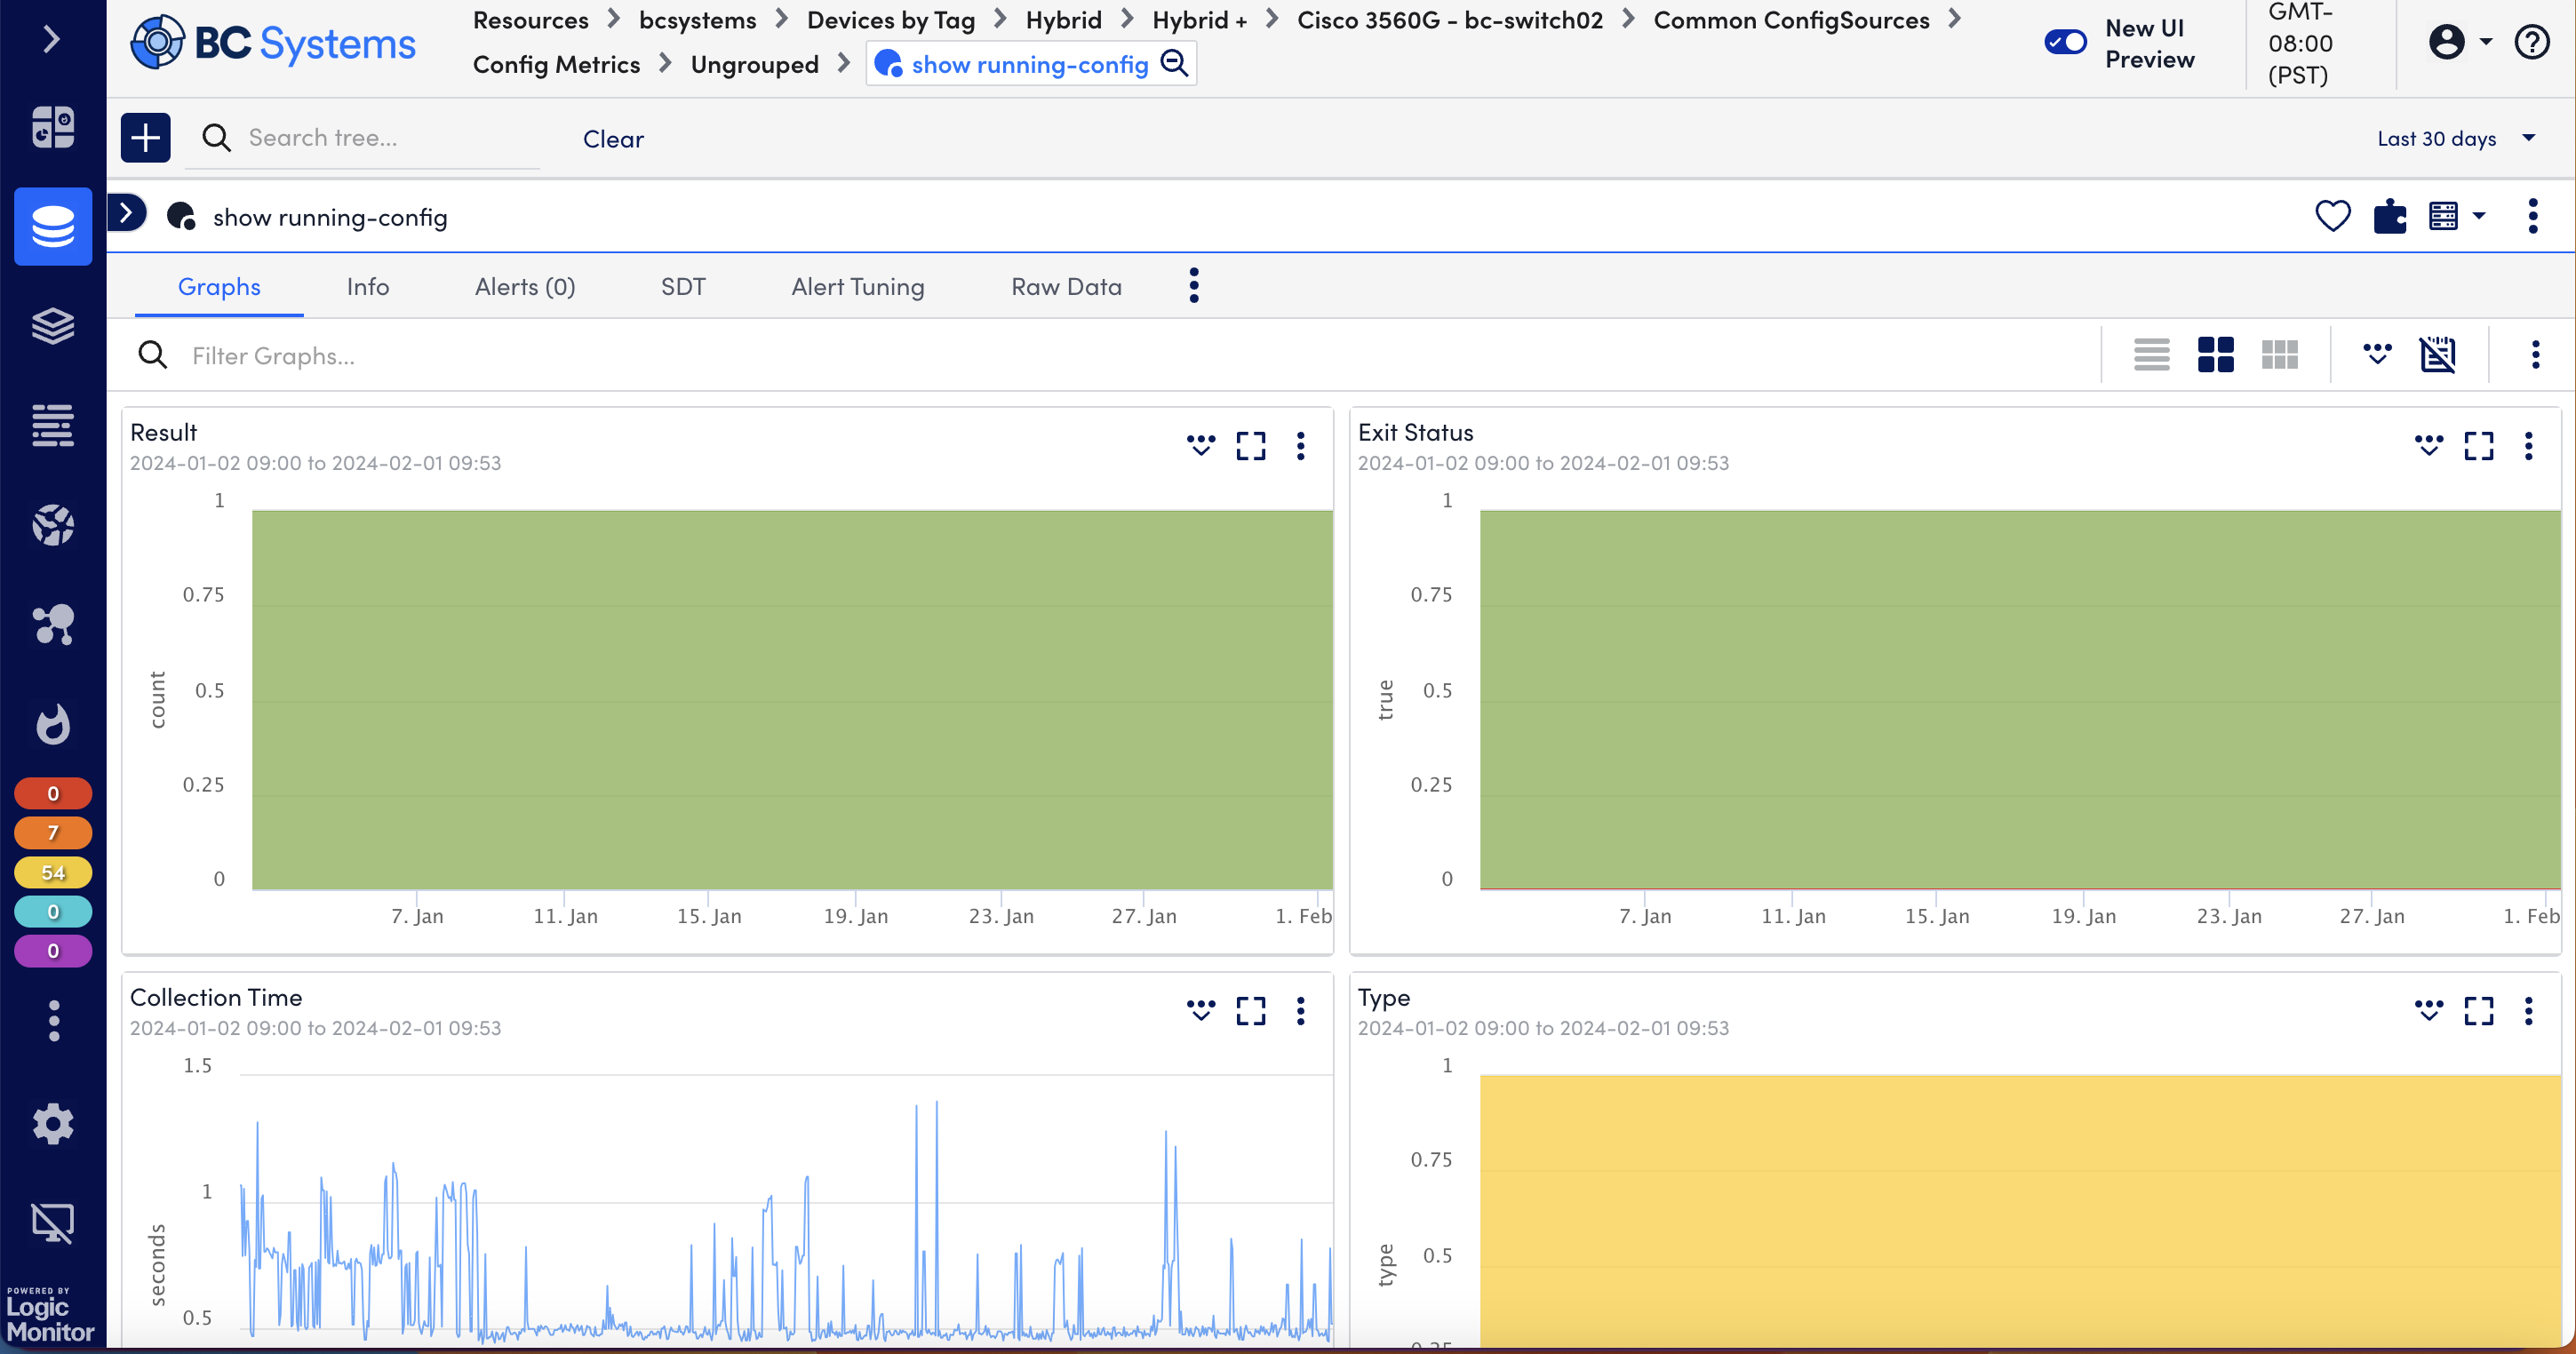
config dashboard

Configuration Monitoring Benefits

logicmonitor overview dashboard

Correlate performance to configuration

In addition to increasing compliance and consolidating tools, putting configuration and infrastructure monitoring in the same platform allows teams to correlate performance data with changes to device configurations.

alert list

Enable DevOps with an IaC approach

Alert on configuration changes the same way you alert on performance metrics.
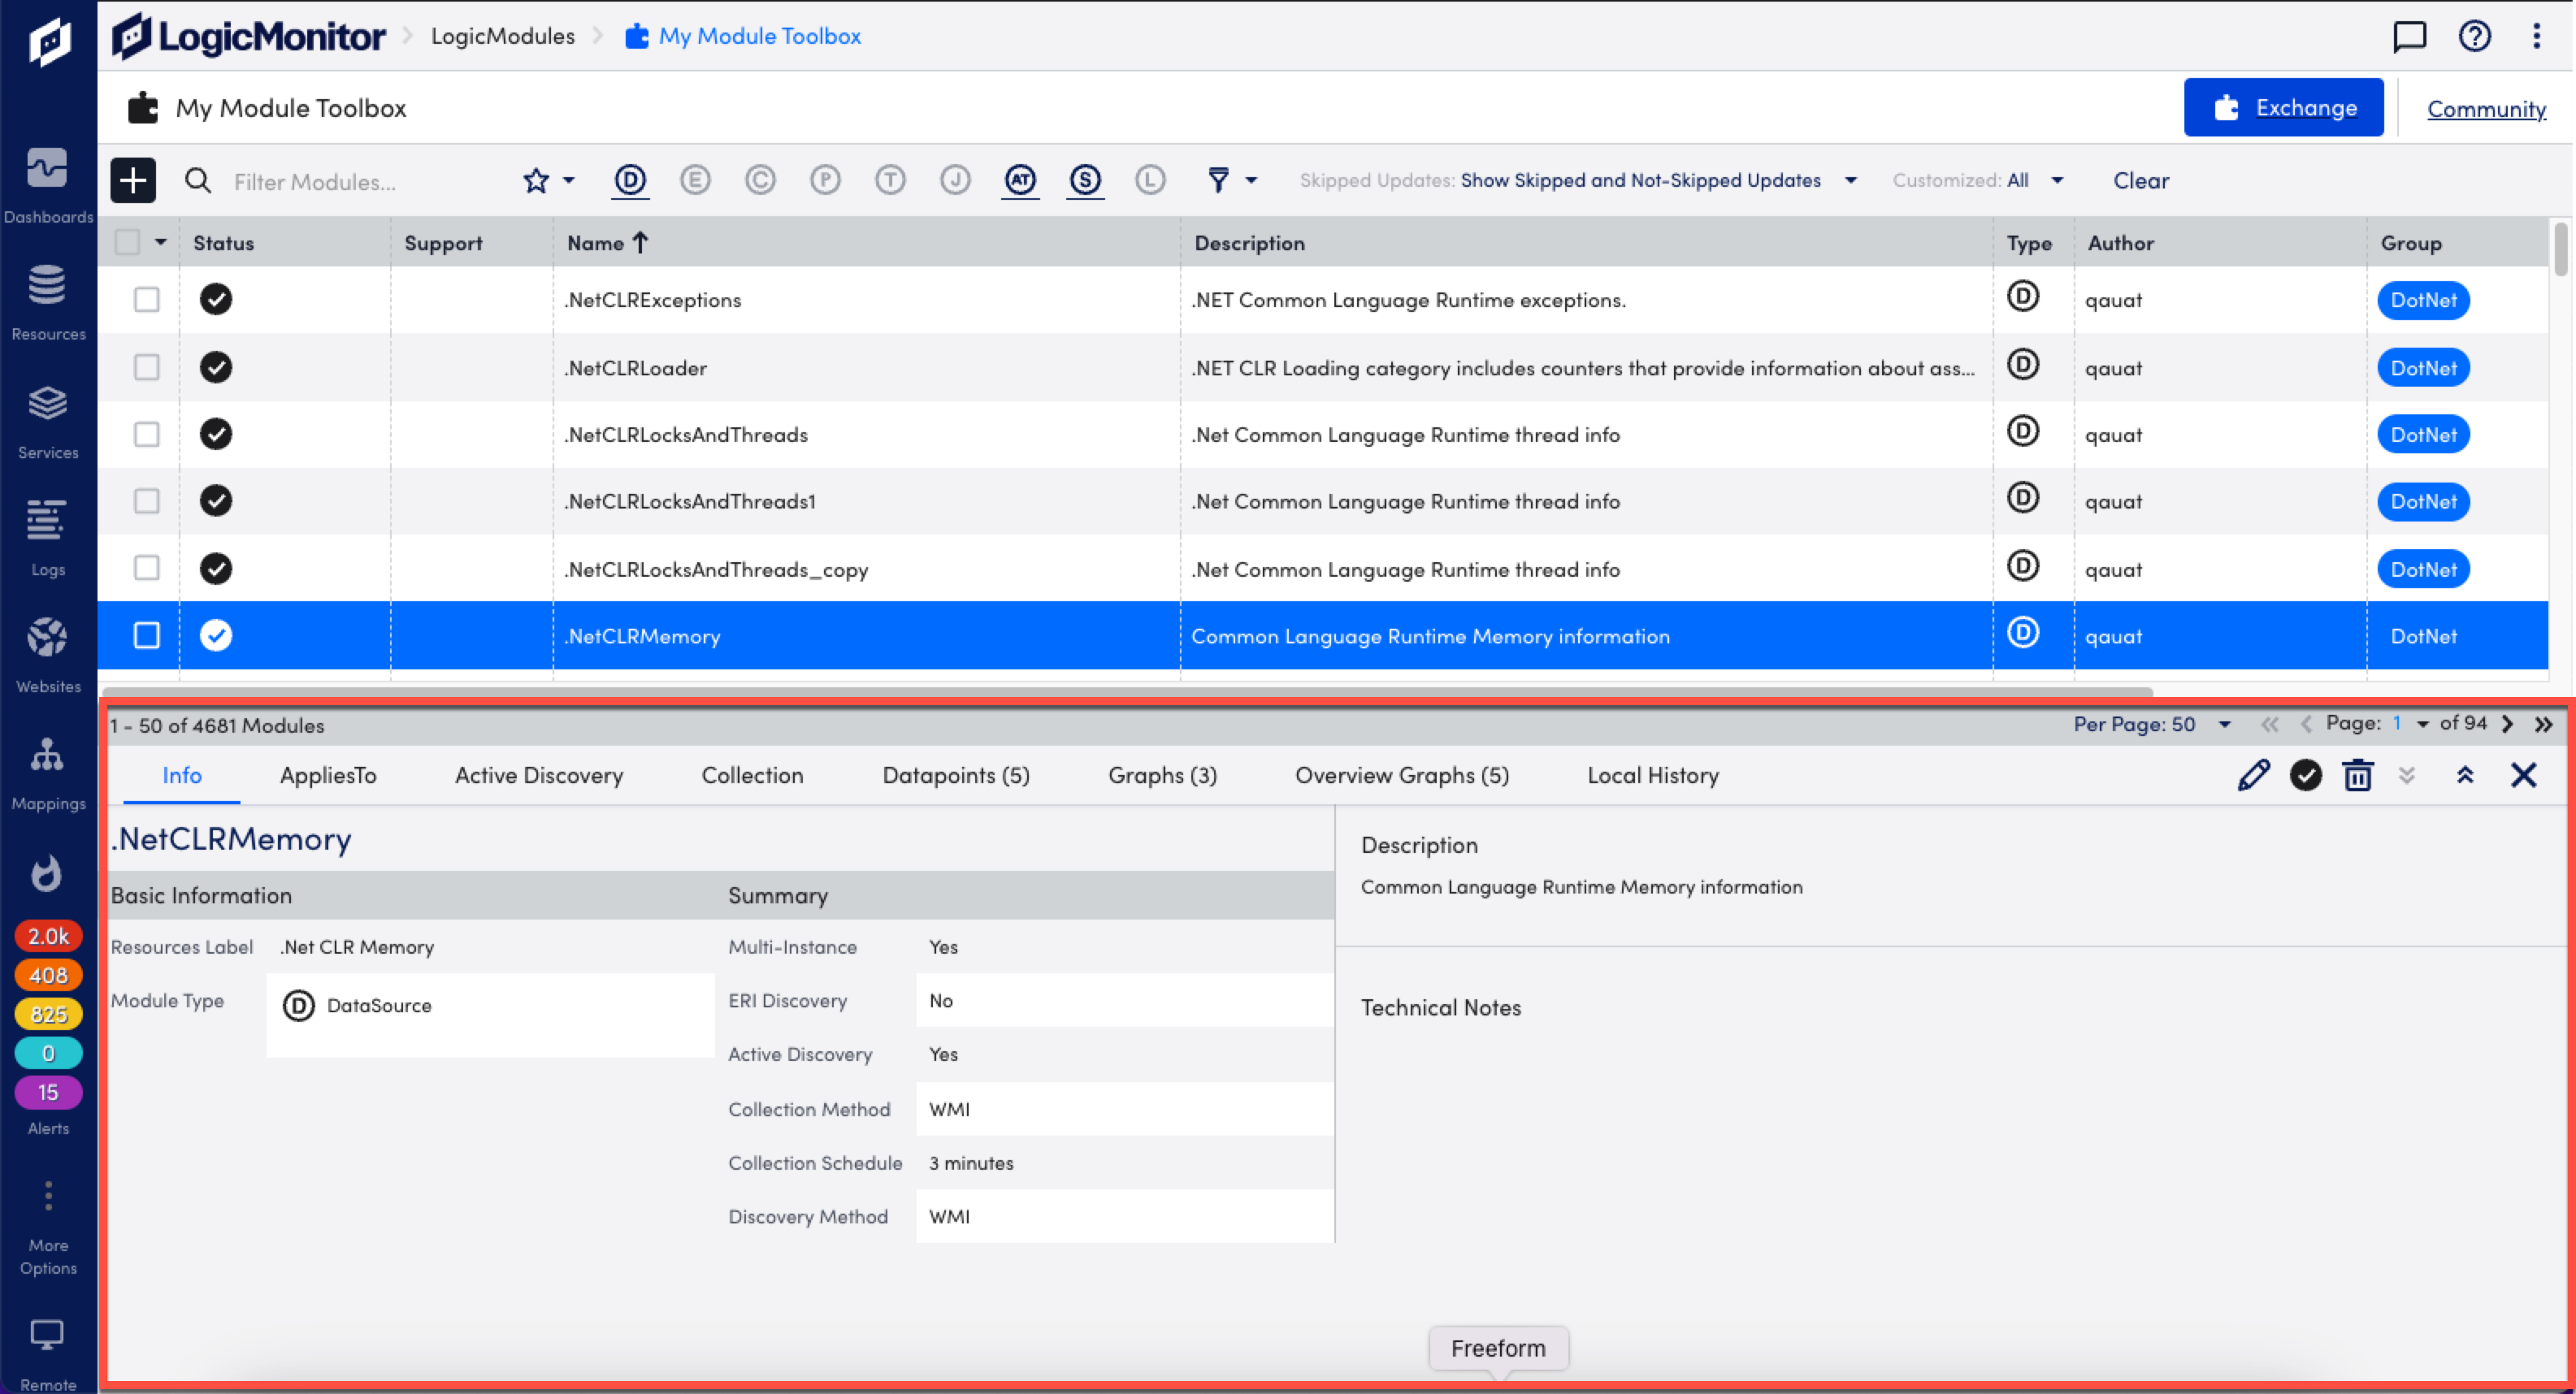
Consolidate tools

Consolidate tools and put configurations in the same window as your infrastructure monitoring.

portal metrics dashboard

Eliminate complexity

Maintain standardization and compliance policies even as your business scales in size and complexity.
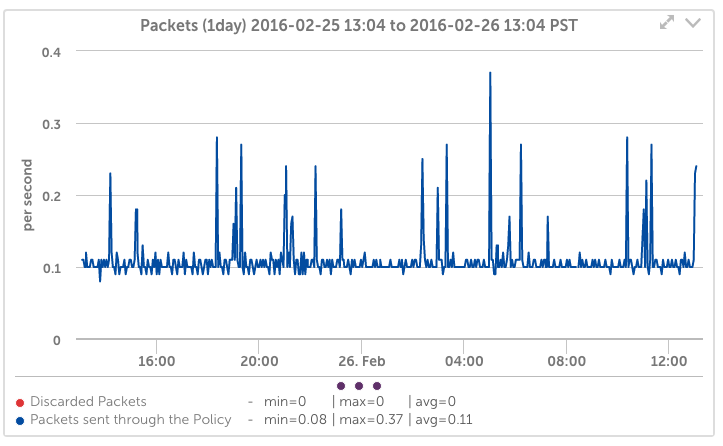
Streamline development

Flag policy violations when they happen and update configurations on the fly without bringing development to a standstill.
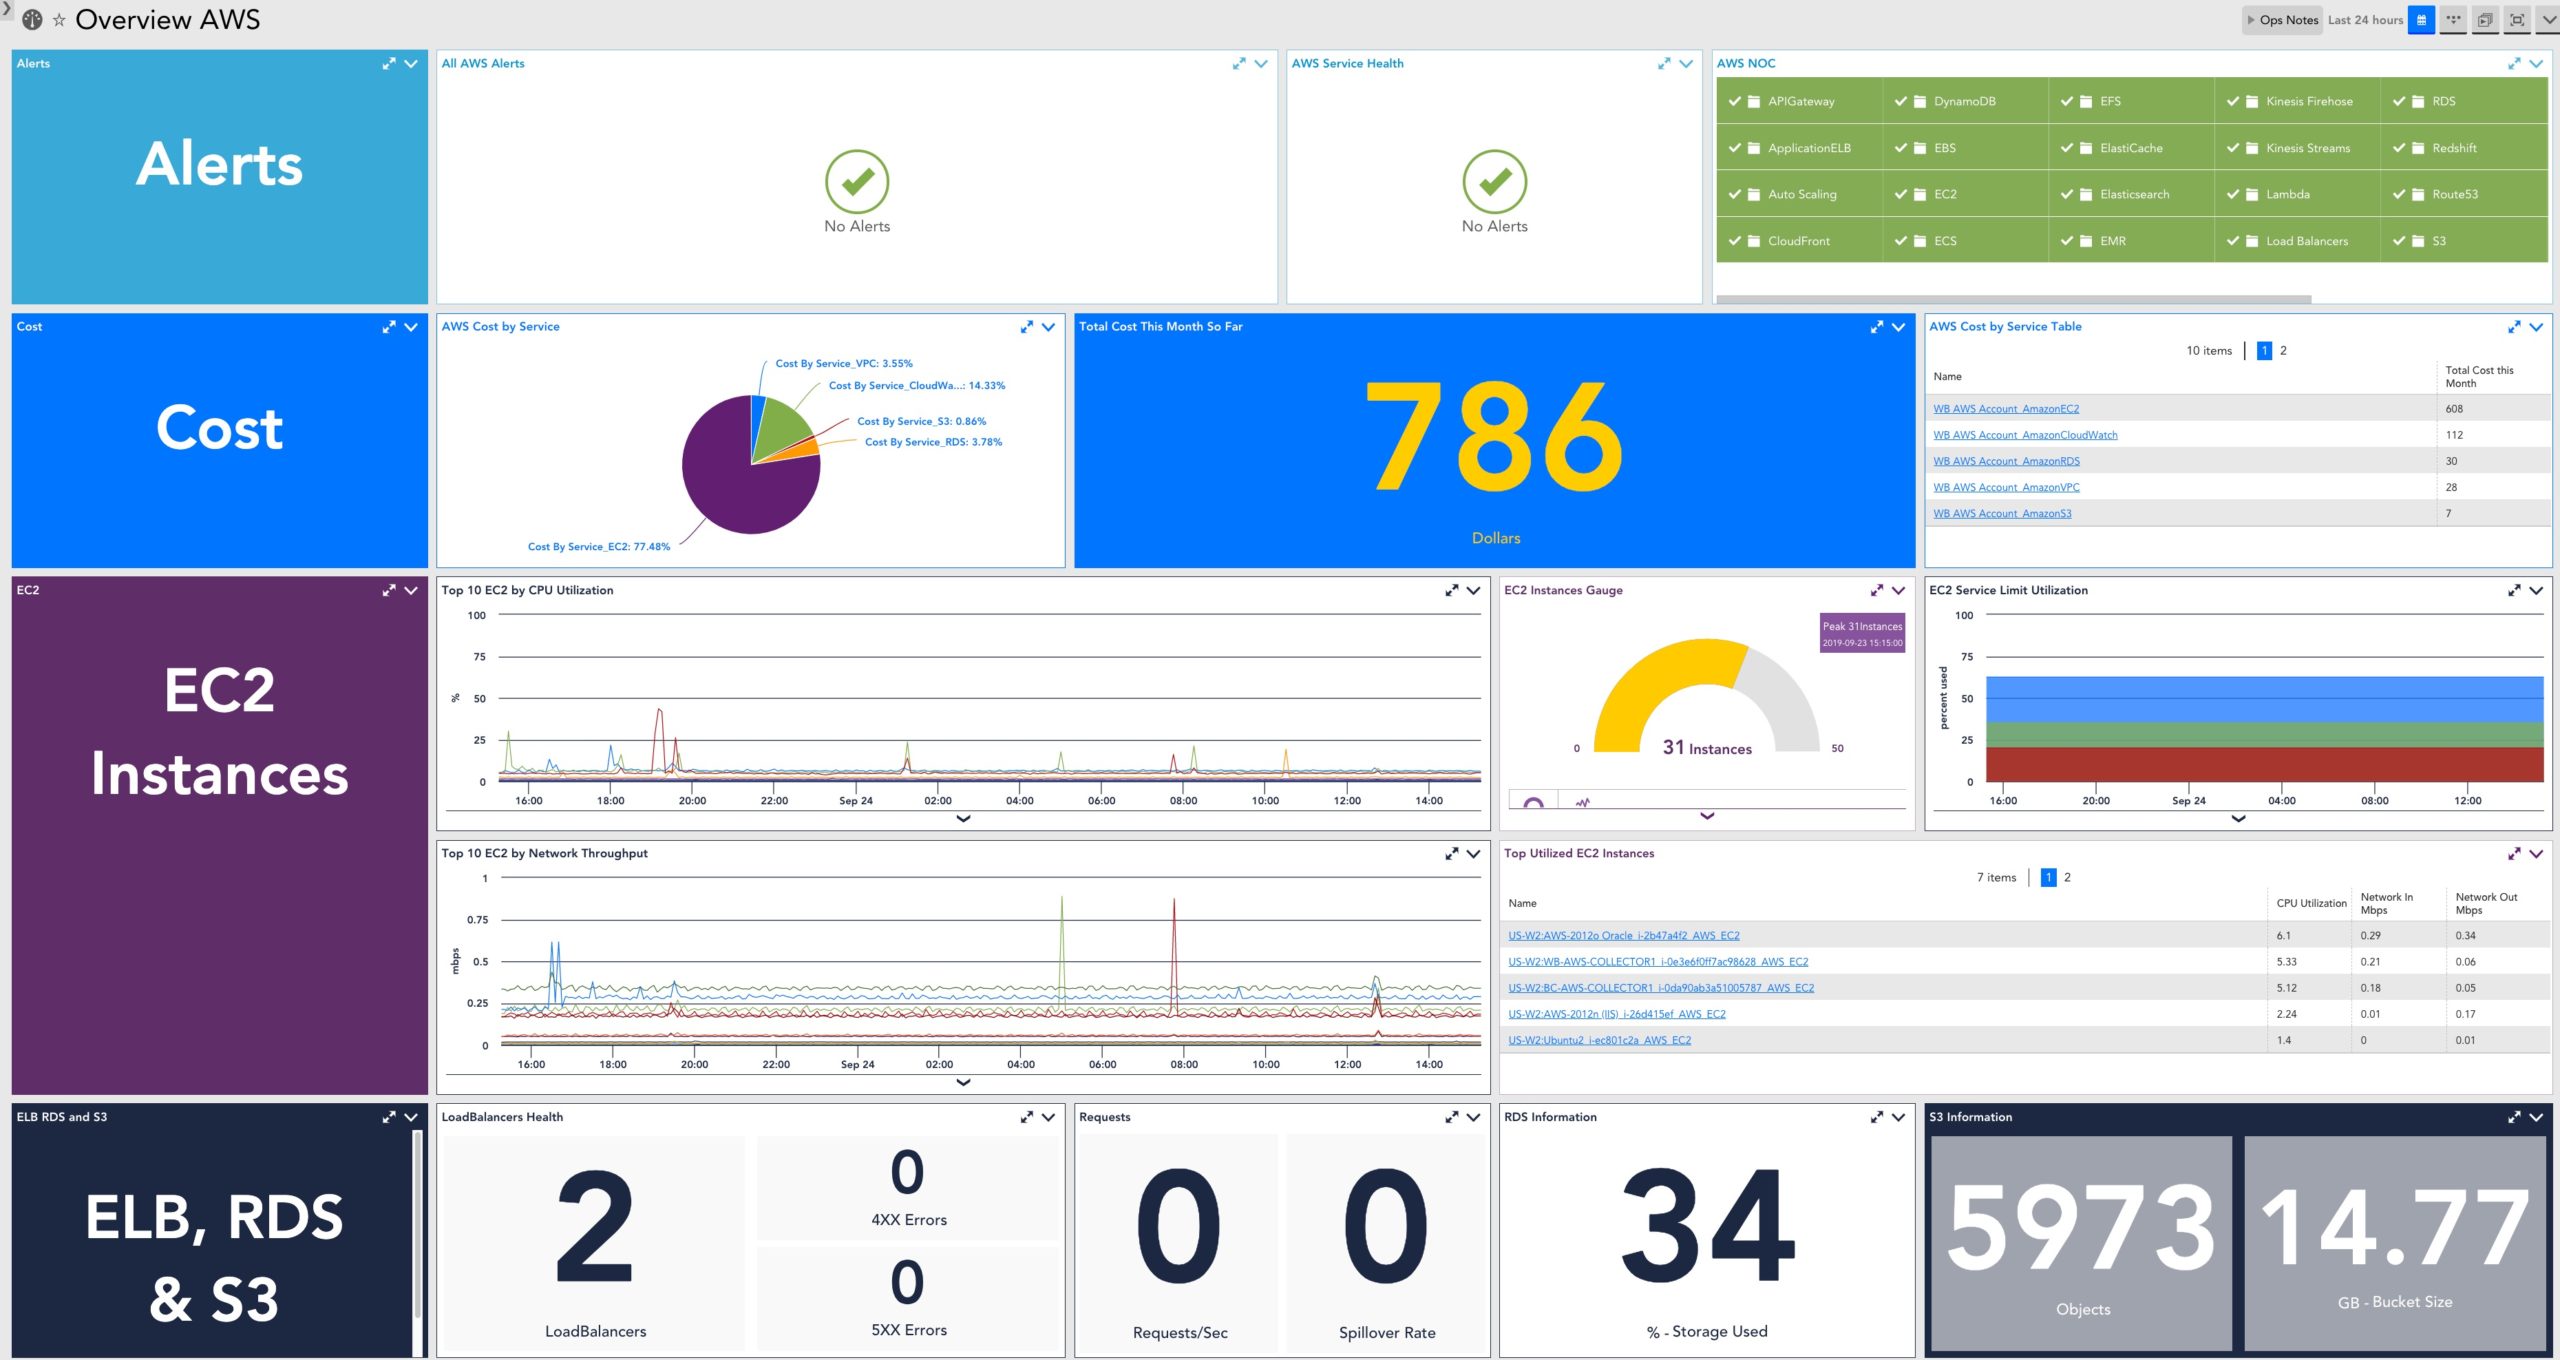
AWS LogicMonitor Dashboard

Scale effortlessly

Partner with the only monitoring solution that drives transformation and scales with you. Our configuration monitoring ensures your infrastructure stays healthy as infrastructure complexity grows.

Configuration Monitoring FAQs

What is LM Config?

A feature which provides configuration file monitoring and storage directly in the LogicMonitor platform using a combination of Active Discovery, change detection, customizable alert checks, and automatic storage of configuration file history.

What are ConfigSources?

ConfigSources define how the LM Collector should retrieve data from a monitored device, as well as which devices should be monitored.

Why are config files important?

A configuration file tells a device how it should function. These files are often highly customized for a particular application and changes to them can have profound effects on an IT environment. A misconfigured configuration file on a single device can bring down an entire network.

What kinds of devices use config files?

Primarily network devices such as routers, switches, and firewalls. But also applications like Apache, MySQL, and our own Collector.

What Is Configuration Management?

A systems engineering process for establishing and maintaining consistency of a product’s performance, functional, and physical attributes with its requirements, design, and operational information throughout its life.

Sign up for your free 14-day trial

Go beyond website monitoring with full access to the LogicMonitor platform. Comprehensive monitoring and alerting for unlimited devices and the full suite of core platform features.
Features include:
  • AIOps early warning system
  • Automated device discovery
  • Alerting and escalation chains
  • 2000+ monitoring integrations
  • 100+ pre-built dashboards
  • Comprehensive training modules
  • 24/7 chat support

Sign up today

Related Solutions

Get full stack visbility with infrastructure monitoring

Gain full-stack observability across cloud, on-premises, and hybrid environments with cloud-based infrastructure monitoring. Cut down your MTTR and make informed decisions with AI-powered intelligence for IT Operations.

Explore infrastructure monitoring
infrastructure monitoring 3D icon

Configuration monitoring across clouds

Whether you’re building a EC2 Instance in AWS or clusters in Azure, correlate changes in configuration with performance trends and availability events. View resources and cofigurations across cloud services in a single resource pane.

Explore Cloud Monitoring

Understand how your network is affecting service delivery

With over 2000 integrations, LogicMonitor has your cloud, on-premises, and hybrid IT environments covered and has the power to drill into your applications, servers, storage arrays and more. Out of the box integrations with Netflow, sFlow, jFlow, WMI, Cisco, firewalls, routers, switches and thousands more give you the comprehensive solution you need to see more faster.

Explore integrations

More resources

Automating IT Operations with Ansible

automation

Automating IT Operations with Ansible

Master IT automation with Ansible. Streamline operations, enhance productivity, and reduce errors. Learn how Ansible can transform your business by focusing on strategic IT tasks.

Learn More
What are the 4 DORA metrics, and what do they mean for Ops teams?

automation

What are the 4 DORA metrics, and what do they mean for Ops teams?

Explore what exactly DORA metrics are, how they work, and why companies should be paying attention to them if they want to set up an effective environment.

Learn More
Ansible Key Terms: Getting Started

configuration monitoring

Ansible terminology: Key terms for getting started

Learn an overview of Ansible, from its origins to the latest features, as well as key terminology associated with Ansible so you can start using it effectively immediately.

Learn More

It’s almost like magic. Let’s chat.