LogicMonitor seeks to disrupt AI landscape with $800M strategic investment at $2.4B valuation to revolutionize data centers.

Learn More

LogicMonitor for Software

Software companies can drive rapid change and continuous innovation with LogicMonitor’s hybrid observability powered by AI platform.

Software industry: IT trends, challenges and solutions at LogicMonitor

Eliminate information silos and correlate signals between ITOps & DevOps to speed up execution of digital transformation initiatives.
One platform for hybrid observability

Logs

Log intelligence at scale– instant access to contextualized and correlated logs and metrics in a single, hybrid cloud-based platform. With tiered retention options (including unlimited retention) and hot storage to optimize data hygiene and internal compliance initiatives.

Metrics

Single platform for ITOps and DevOps that eliminates data silos and tracks metrics that matter. Built on OpenTelemetry and OpenMetrics allowing for a vendor-neutral approach to better understand the user experience and accelerate business transformation.

Traces

Never miss an application error, improve code quality, and diagnose and fix issues faster. Gain insight into the performance of the entire app stack, from code to cloud, to ensure a flawless customer experience in agile environments.

We’ve found LogicMonitor to be an extremely user-friendly monitoring solution. It makes the configuration that you are trying to achieve very clear and easy to understand. And it’s the only solution available that provides the Kubernetes and containerization monitoring that we require. These features simply aren’t available on other tools.

BALAJI JEEVA, CLOUD OPERATIONS HID GLOBAL
string(3) "mid"

Drive innovation through consolidation and standardization of on-prem and cloud environments

LogicMonitor provides the comprehensive visibility software companies need into dynamic IT environments for networks, cloud, applications, servers, log data, and more. Data correlation provides insights for intelligent troubleshooting and predicting bottlenecks to scale IT investments and control operational costs for maximum enterprise productivity.

Rapid, automatic deployment and configuration for efficient monitoring

Get the answers you need to solve problems faster with LogicMonitor’s fully automated platform. Our agentless collectors automatically discover, map, and set baselines for complex and distributed infrastructure in a matter of minutes. Put the manual configuration and expensive hardware behind you with monitoring built for the modern age.

Intelligently reduce MTTR with contextual analysis

Reduce your MTTR when service issues arise with unified logs and metrics workflow to provide contextual analysis across your IT environment.

Maximize uptime with log alerts built around historical data to prevent future impacts affecting customers. Uncover insights about your performance with full visibility into connected services powering your business applications.

ITOps and DevOps to partner in business modernization

LogicMonitor eliminates application and information silos between ITOps & DevOps and prevents context switching with a single view of application services, performance, and infrastructure. Execute and achieve digital transformation initiatives by empowering ITOps & DevOps teams to correlate signals across application and infrastructure with business outcomes.

Intelligent observability for modern applications

Software companies can gather, track, trace and measure application performance across hybrid and multi-cloud architectures. Optimize user experience, detect application latency and identify bottlenecks to resolve issues faster, maximize application resiliency and eliminate application silos – delivered via LogicMonitor’s Hybrid Observability powered by AI Platform.

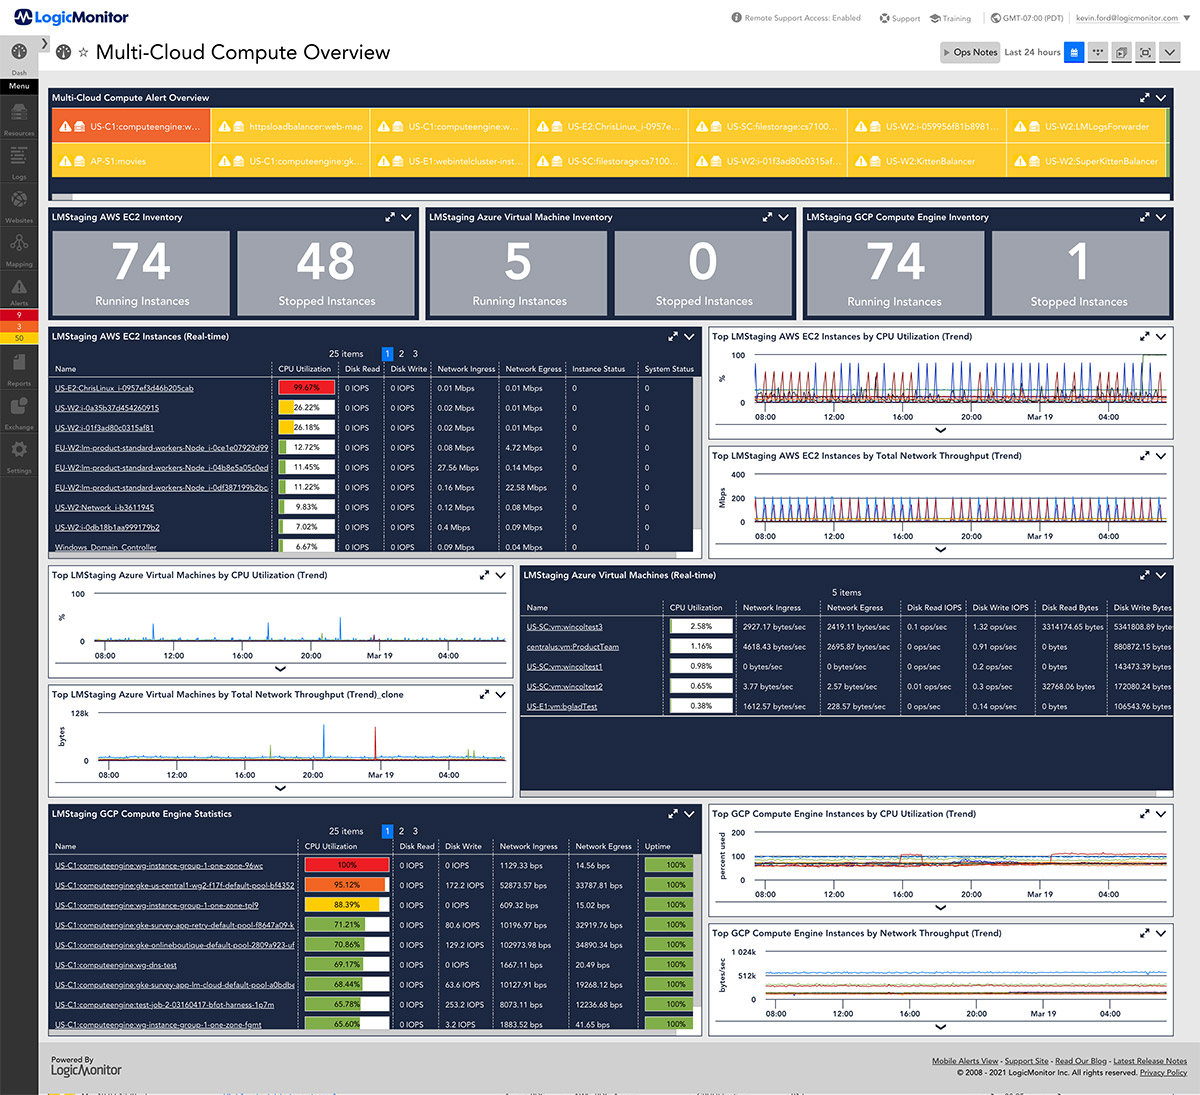
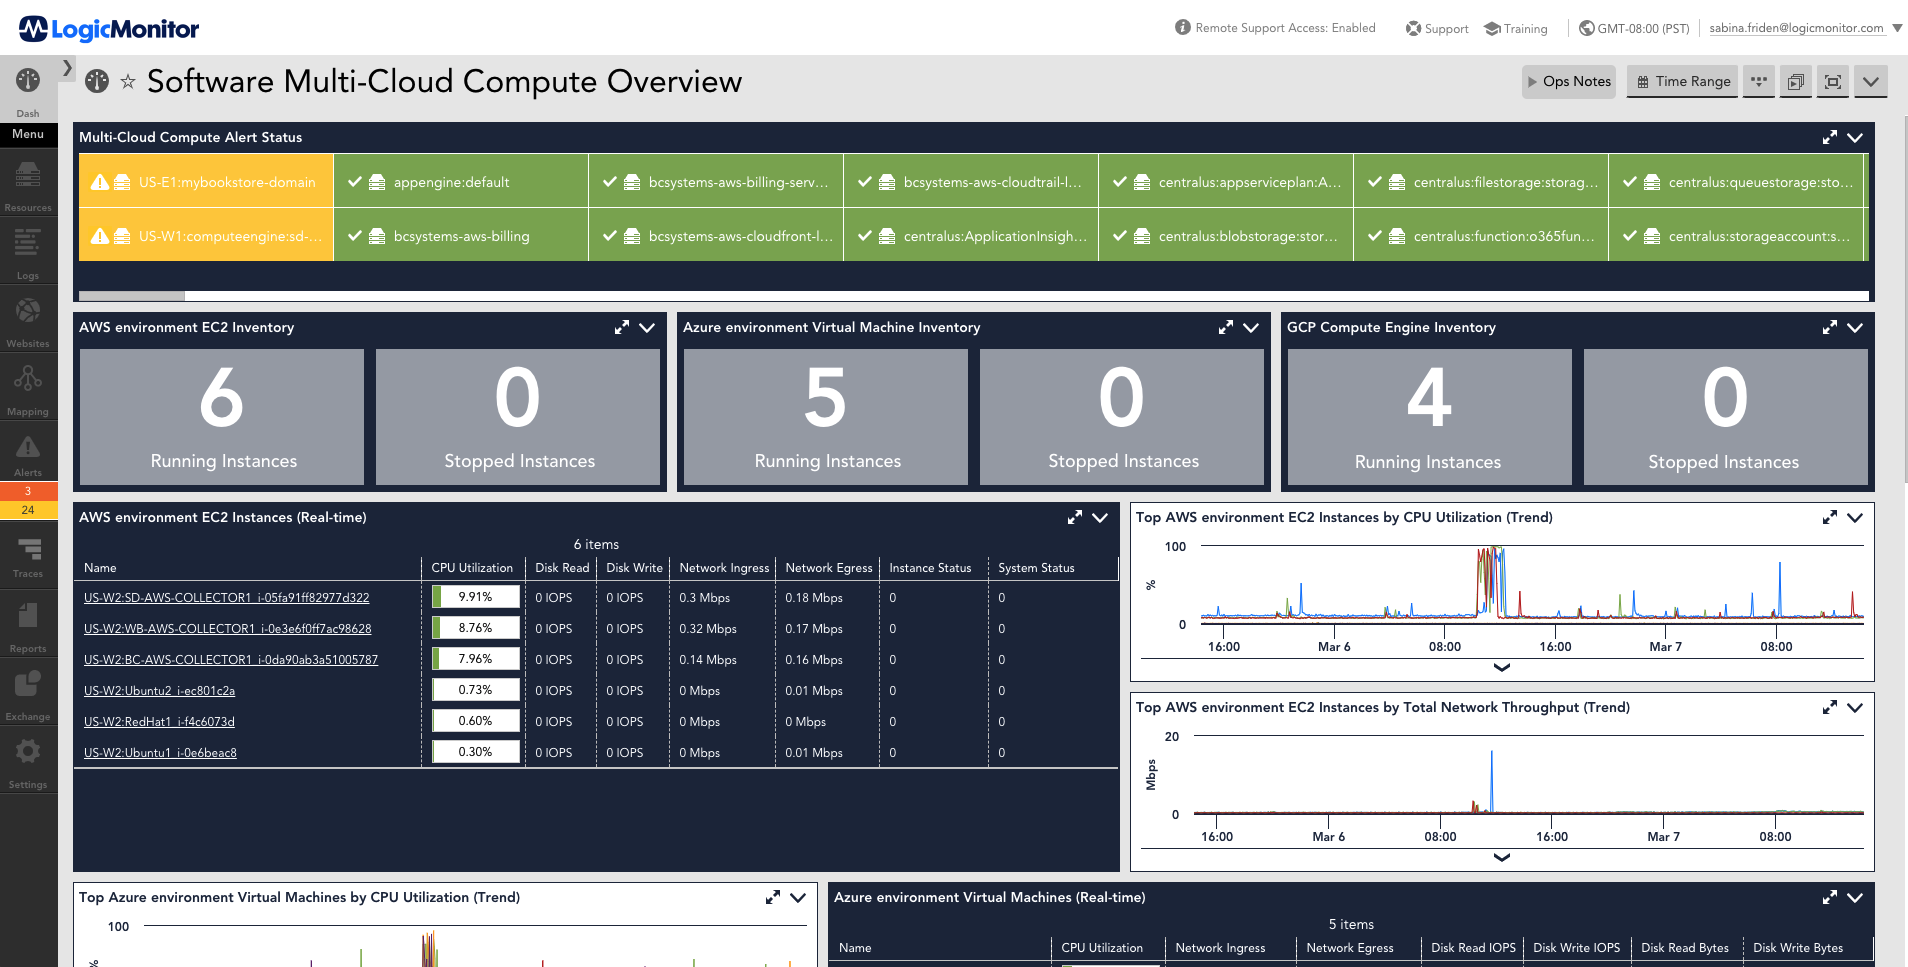
multi cloud overview dashboard showing GCP and AWS performance inside of LogicMonitor
This dashboard provides an a listing of various metrics that are monitored for Linux servers using SNMP or SSH. The metrics displayed are status, real-time CPU utilization, real-time memory utilization, real-time storage utilization, CPU utilization over time, memory utilization over time, storage utilization over time.
Beating the odds: How log data helps detect and lower MTTR
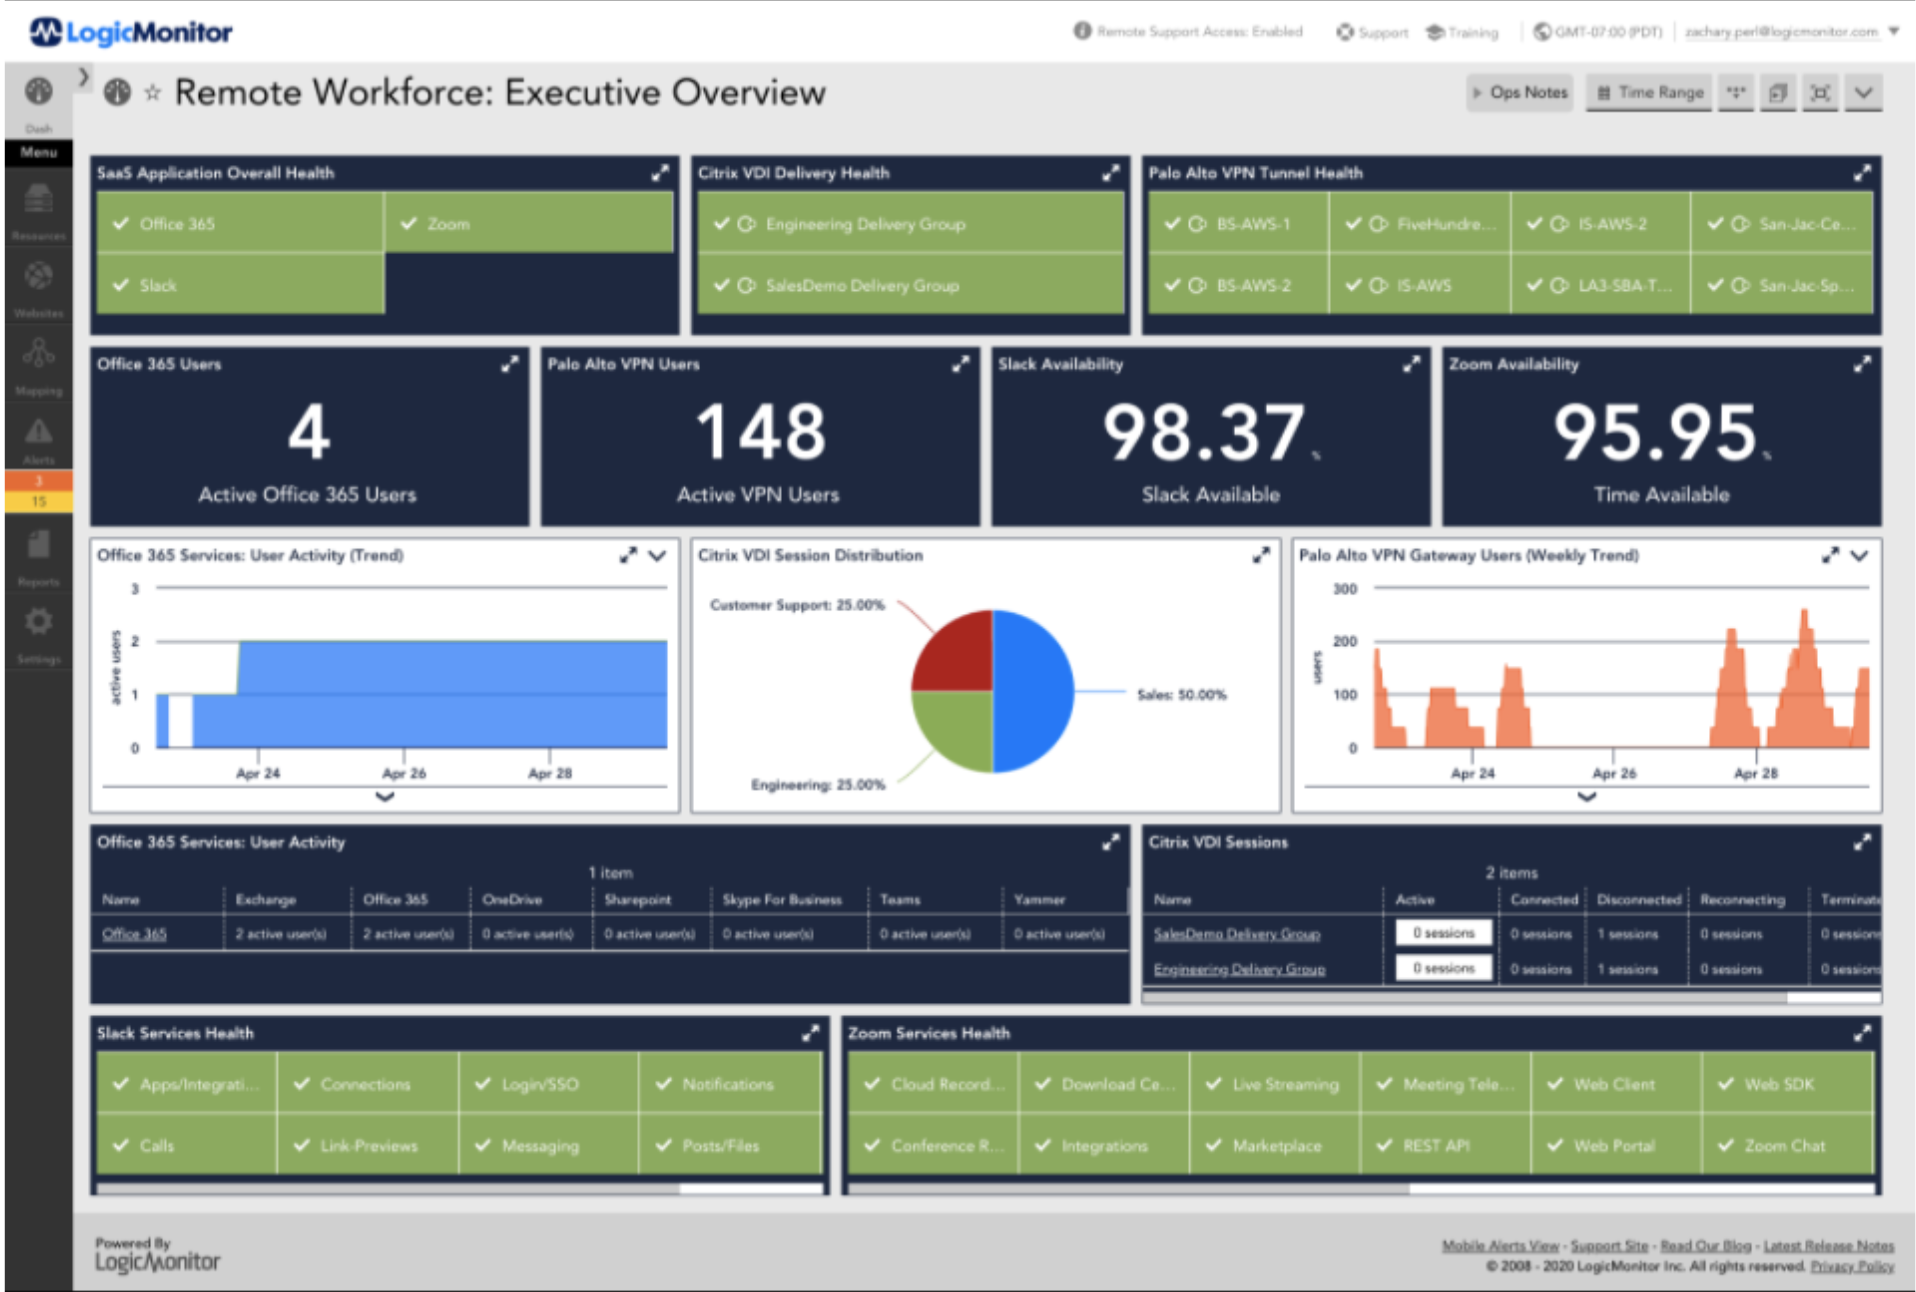
Remote Workforce: Executive Overview Dashboard
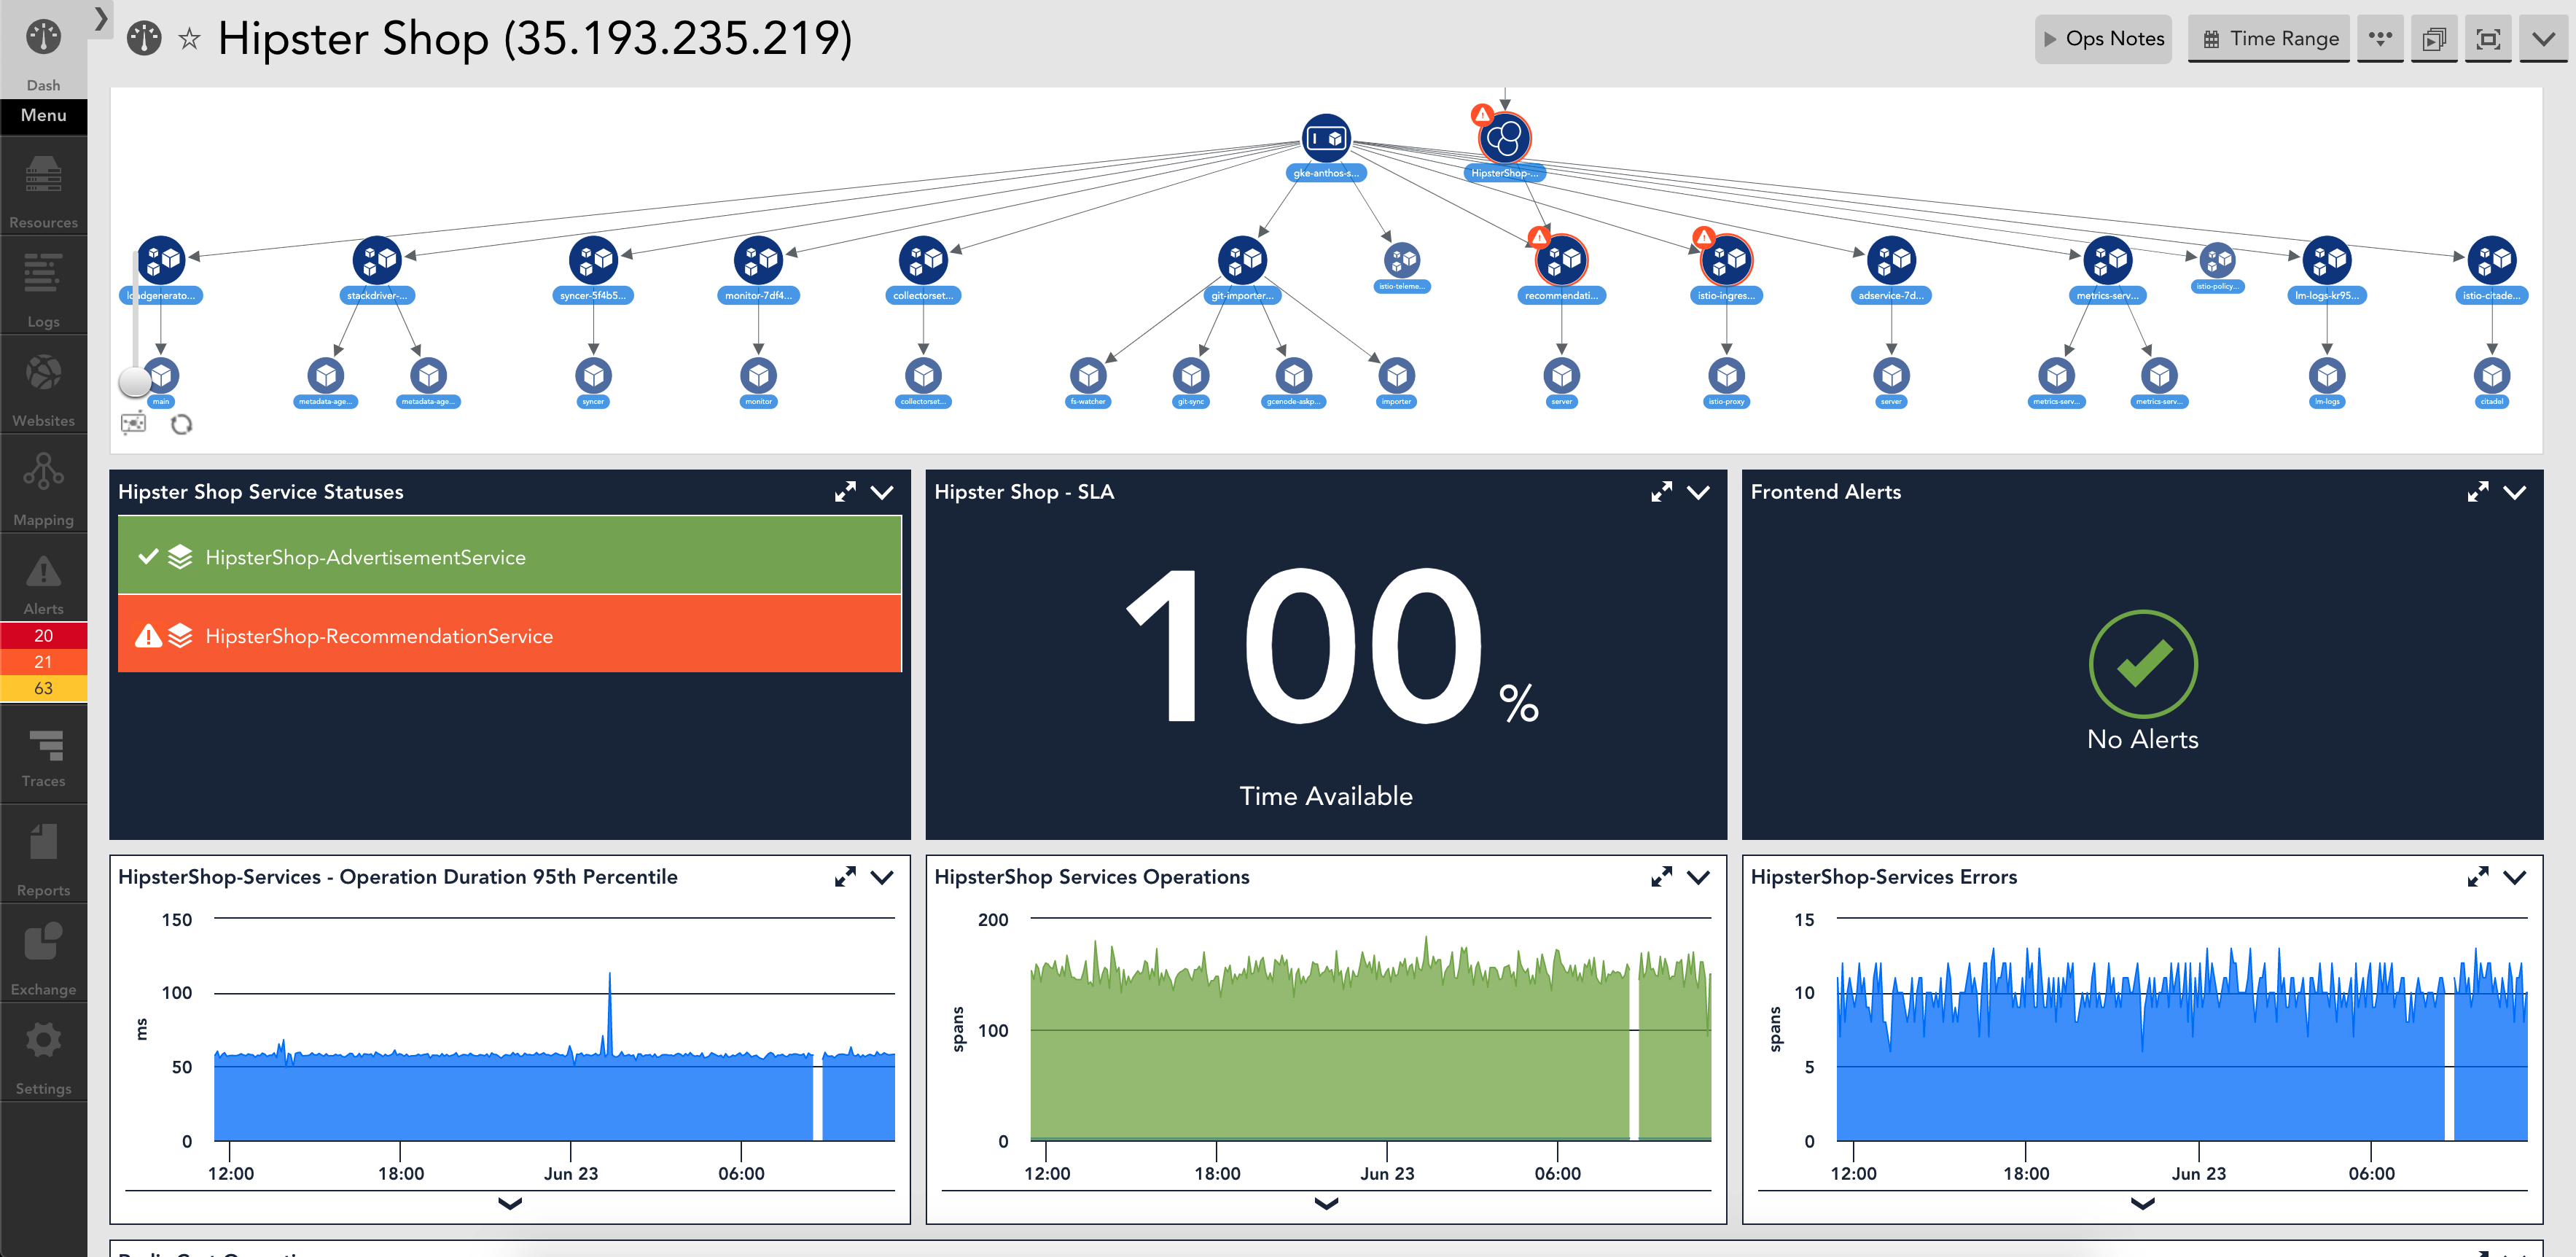
Hipster Shop Dashboard

Trusted by:

Secure by design

LogicMonitor’s platform is secure. The following are just some of thernways LogicMonitor ensures user and systems security:

Secure architecture

RBAC, 2FA, Encryption of data in transit and at rest

Secure data collection

Only outbound comms allowed from LM Collector, data encrypted with TLS, LM Collectors securely locked to your environment.

Secure operations

Collectors based on hardened Linux with perimeter and host-based IPS, operated out of top tier DCs and AWS regions, all with top security measures in place.

Secure practices

Minimal personal data stored, device access credentials stored in memory and never written to disk, salted one way hashes used in place of user passwords.

Secure standards

Constant penetration testing ensures maximum security, SOC2 validates our controls for security, high availability and confidentiality.

LogicMonitor has given us the power of full-stack observability and the ease of a SaaS product. We’ve got a set of dashboards that are focused on specific products and tell us everything that we need to know.

AL HEPWORTH, SENIOR DIRECTOR OF ENGINEERING PEACH
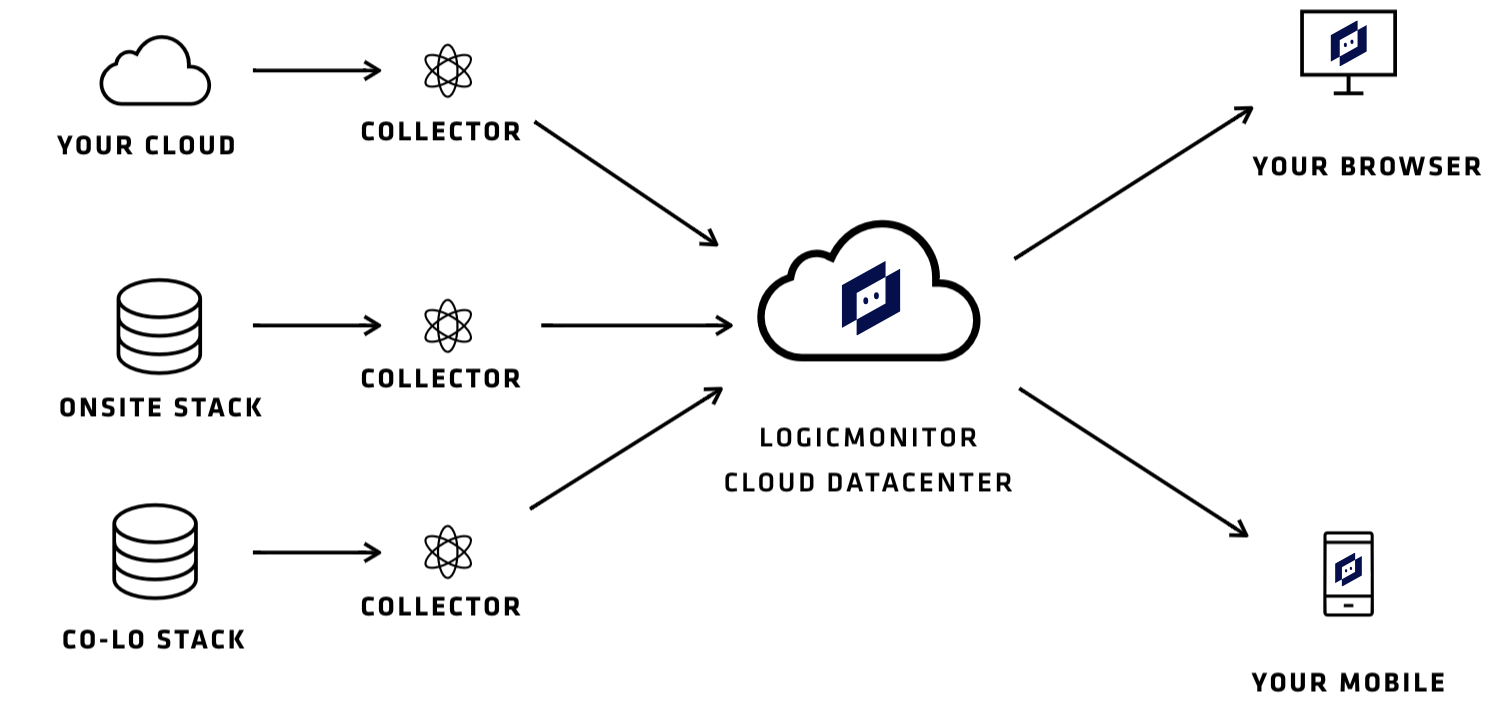
Single pane of glass for IT and OT

LogicMonitor marries visibility into your traditional and cloud workloads with your IOT and production systems to allow you to troubleshoot and optimize the system as a whole.

Extensive breadth of coverage across on-prem, cloud and containers

  • 2,500+ integrations
  • Rapid release cycle
  • 350+ new or updated data sources released last year
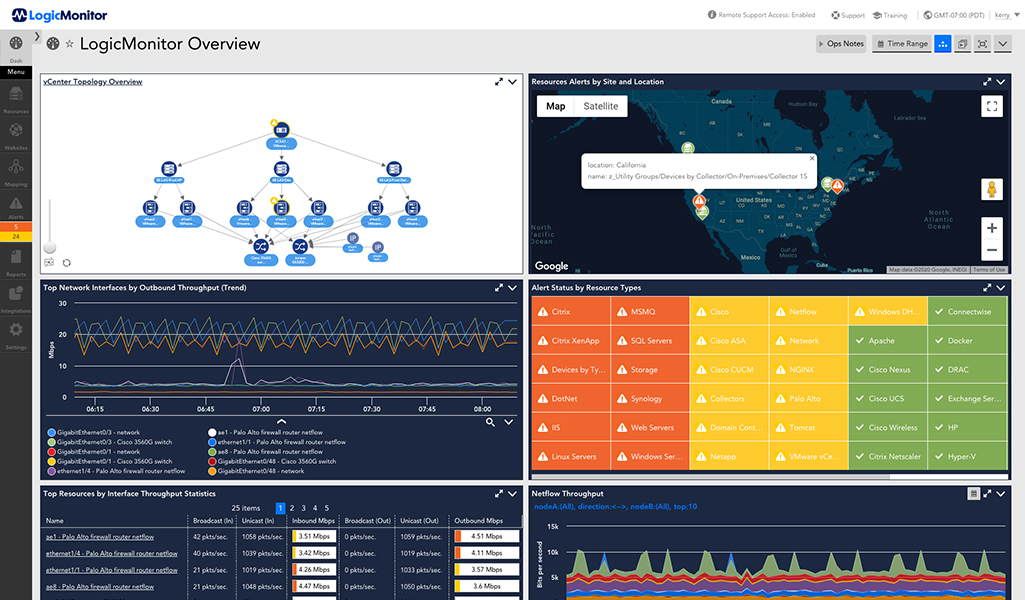
LogicMonitor Overview Takeout View

Simplified extensibility into IOT

  • LM Exchange offers a library of integrations to bring you out-of-the-box monitoring for networking devices, applications, databases and services
  • A centralized view of integrations available in LogicMonitor’s global repository
  • Custom monitoring templates with rapid protyping capabilities

AIOps to forecast and identify anomalies

  • Intelligently detect service-impacting signals from noise, making signals more actionable
  • Ensure the right team members are informed via SMS, email, chat or ITSM integrations
  • Identify the root cause of an outage and put an end to alert storms
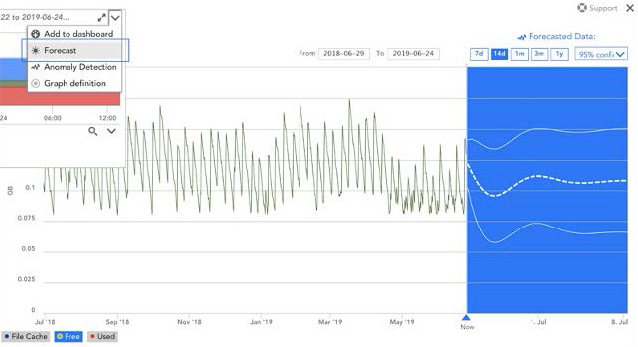
AIOps to Forecast and Identify Anomalies

Related resources

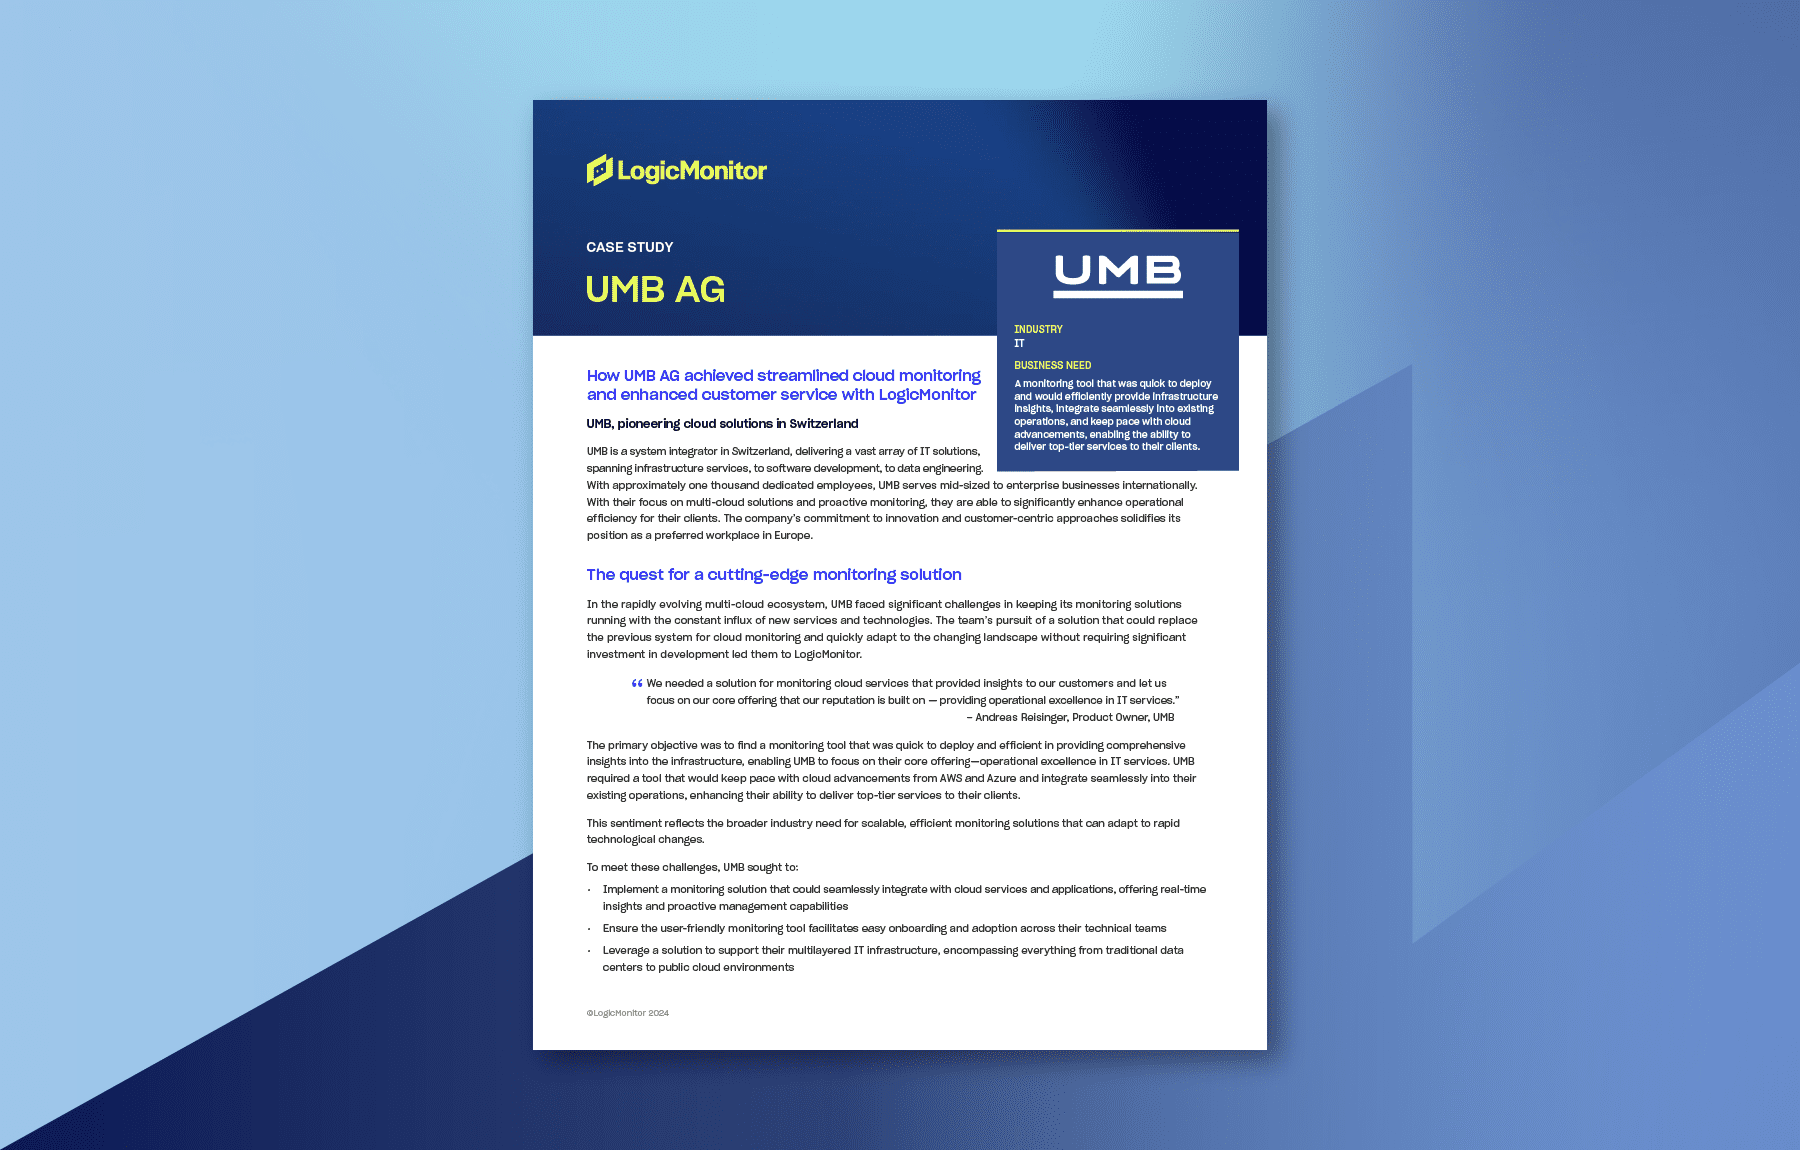
UMB AG case study

case study

How UMB AG achieved streamlined cloud monitoring and enhanced customer service with LogicMonitor

Discover how UMB AG, a leading Swiss IT system integrator, enhanced its cloud monitoring capabilities and customer service through LogicMonitor. Learn about UMB’s journey to streamline multi-cloud management, achieve proactive monitoring, and deliver top-tier IT services efficiently and effectively.

Learn More
california

accelerate growth

LogicMonitor Secures Software Licensing Program Contract to Deliver Hybrid Observability Solution to Public Sector Agencies

LogicMonitor secures a software licensing program (SLP) contract with the state of California to enable customers to conveniently adopt their SaaS-based hybrid observability platform to optimize IT infrastructure monitoring

Learn More
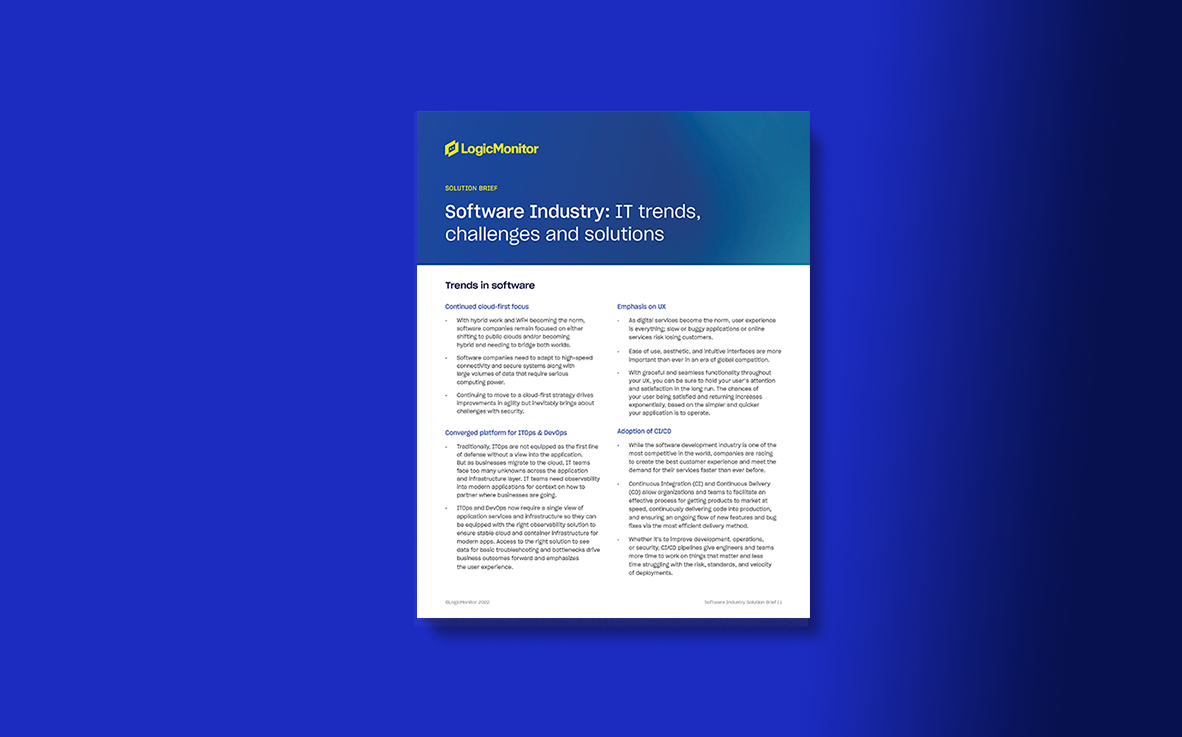
Software Industry: IT Trends, Challenges & Solutions Solution Brief

aiops

Software Industry: IT Trends, Challenges & Solutions 

Software companies need to innovate at a rapid pace. Investing in an observability platform that consolidates and standardizes on-prem and cloud environments and eliminates information silos between ITOps and DevOps is key.

Learn More