One thing we frequently say is that you need to be monitoring all sorts of metrics when you do software releases, so you can tell if things degrade, and thus head off performance issues. You need to monitor not just the basics of the server (disk IO, memory, CPU, network), and the function of the server (response time serving web pages, database queries, etc), but also the in-between metrics (cache hit rates, etc).
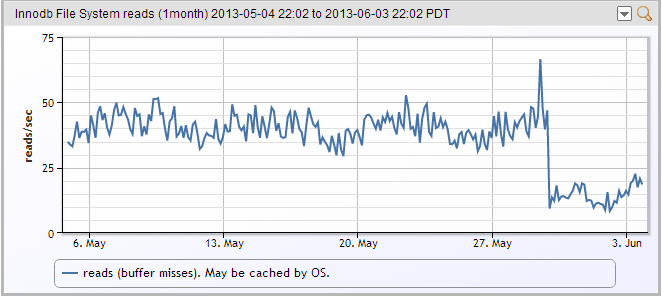
This also provides visibility into when things improve, as well as get worse. For example, in a recent release, we changed the way we store some data in an internal database, and reduced the number of records in some tables by thousands. As you can see, this dropped the number of times Innodb had to hit the file system for data quite a bit:

Now, if we were running on SAS disks, instead of SSDs, we would have just regained a sizable percentage of the maximum IO rate of the drive arrays back, with one software release. (Purists will note that the drop in what is graphed is InnoDB disk requests – not OS level disk requests. Some of these requests will likely be satisfied from memory, not disk.)
If I were a developer, and was on the team that effectively allowed the same servers to scale to support twice as much load with a software release….I’d want people to know that.
Just sayin…
Subscribe to our blog
Get articles like this delivered straight to your inbox


