In today’s complex IT environments, logs are the unsung heroes of infrastructure management. They hold a wealth of information that can mean the difference between reactive firefighting and proactive performance tuning.
What is log analysis?
Log analysis is a process in modern IT and security environments that involves collecting, processing, and interpreting log information generated by computer systems. These systems include the various applications and devices on a business network.
From security breaches to system performance optimization, log analysis is indispensable for IT operations and security teams alike. However, understanding how to efficiently leverage this wealth of data is no small feat.
Based on my decades of experience managing IT environments, I’ve seen firsthand the critical role of effective log analysis in maintaining system health, security, and compliance. Over the years, this discipline has evolved—from manual log parsing in the early days to today’s AI-powered insights that help teams manage vast amounts of data in real-time.
In this guide, I’ll walk you through core log analysis concepts, share advanced techniques, and provide real-world insights to help you understand how to extract actionable information from your logs.
Key takeaways
Log analysis is a critical part of modern IT infrastructure that helps teams identify issues, security rewards, and performance issues.
Effective log analysis involves collecting data from various sources, processing it through techniques like indexing and normalization, and analyzing it with advanced tools.
Advanced log analysis, such as pattern matching, correlation, and visualization, helps reduce the number of false positives and quickly surface actionable insights.
Advancements in AI, real-time processing at scale, and integration with emerging technologies are shaping the future of log analysis.
Core concepts of log analysis
At its essence, log analysis is a step-by-step process that involves collecting data from various devices and ingesting it into monitoring applications for review.
You can break it down into several steps:
Data collection
Effective log analysis begins with collecting data from various sources like servers, applications, and network devices. This process is often underestimated, but it’s the foundation for everything that follows. One common pitfall I’ve seen is missing log sources, leading to incomplete analyses and delayed troubleshooting.
I once missed a critical log source in a third-party vendor’s server, which delayed our root cause analysis by hours. After adding that missing source, we finally pinpointed the issue—a simple configuration error that could have been caught earlier with proper log collection.
By ensuring complete coverage of all devices and systems, you can prevent major issues from going undetected, simplifying later steps in the process.
PRO TIP
Configure all data sources properly to avoid gaps in your log data.
Data processing
Once logs are collected, the next challenge is processing them effectively. Raw logs contain a lot of noise—irrelevant data that can cloud your analysis. In my experience, indexing and normalizing logs is crucial for reducing this noise and ensuring you can focus on the actionable data.
Many teams make the mistake of assuming they can get away with analyzing raw logs. Unstructured logs often lead to information overload, making it hard to extract meaningful insights. Structuring your data through normalization makes things far easier, allowing you to search, analyze, and correlate events across your systems more easily.
Data analysis
Now comes the part that used to be the most time-consuming—analyzing the logs. In the past, IT teams would spend hours manually combing through logs, looking for patterns. However, this approach is neither practical nor scalable in today’s complex hybrid environments. Tools that leverage AI and machine learning have become essential in detecting patterns and anomalies in real-time, significantly improving troubleshooting and incident detection efficiency.
I remember an incident where AI flagged a series of login attempts across multiple devices. It appeared normal on the surface, but on closer inspection, these were part of a coordinated brute force attack. Without AI’s pattern recognition abilities, this might have slipped through the cracks. The takeaway here is that manual log analysis is outdated. AI-powered tools are essential to keep up with the volume and complexity of modern IT environments.
Data visualization
Log data is only valuable if you can quickly interpret it, which is why visualization is crucial. Dashboards and reports help surface trends and anomalies, helping your team make quicker decisions with a real-time system health and performance overview.
I’ve seen poorly designed dashboards cost teams hours—if not days—of productivity. One time, I was dealing with performance issues, but our dashboard wasn’t set up to visualize the right metrics. It took hours to isolate the problem. After redesigning the dashboard to prioritize key performance indicators (KPIs), we identified issues in minutes. The right visualization tools make the difference between proactive monitoring and reactive firefighting.
PRO TIP
Executives appreciate dashboards that help them understand what they care about most in one quick-to-digest view.
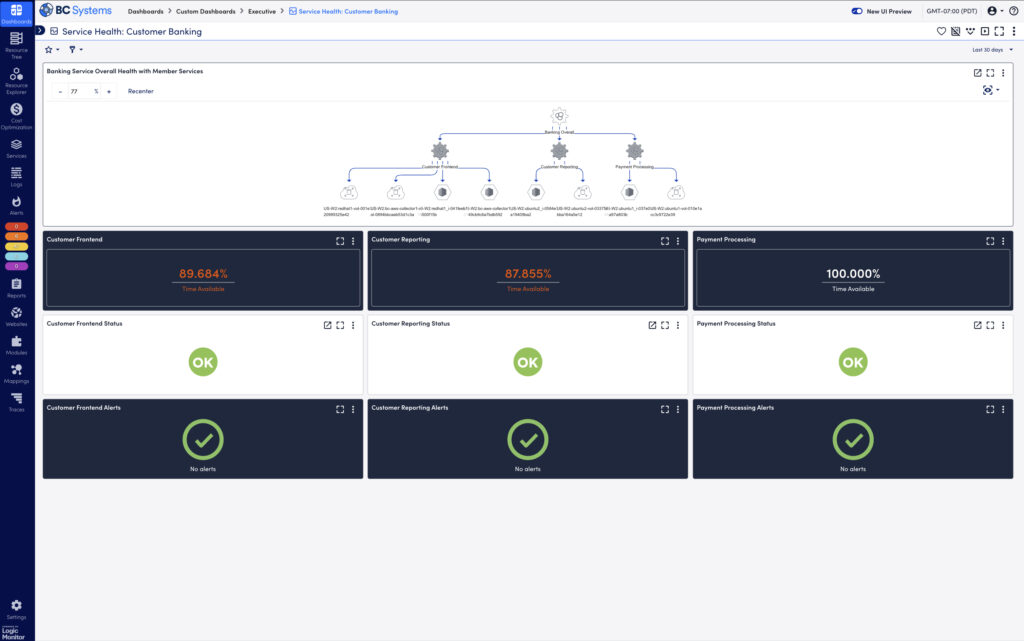
Visualizing the health of customer banking services: A comprehensive dashboard overview, highlighting real-time availability and status for Customer Frontend, Reporting, and Payment Processing, ensuring optimal performance and alert-free operations.
What is log file analysis?
Log file analysis involves examining logs generated by IT systems to understand events, detect issues, and monitor performance. This step is critical in maintaining a healthy IT infrastructure. Proper log parsing can reveal invaluable insights about what’s happening under the hood, whether you’re troubleshooting or investigating security incidents.
In my experience, the biggest challenge is often dealing with unstructured log files. We already discussed how overwhelming raw logs can be, and finding a single root cause can feel like searching for a needle in a haystack. Here’s where techniques like parsing, filtering, and time-based analysis come into play:
Parsing: This breaks down log files into structured data fields, making categorizing and understanding events easier. For example, during a major outage, we used log parsing to quickly identify misconfigurations in a load balancer, which helped resolve the issue in minutes rather than hours.
Filtering: Effective log filtering isolates relevant log entries, helping you narrow your focus. I recall a scenario where we filtered out hundreds of benign logs to zero in on suspicious activity linked to unauthorized access attempts.
Pattern matching: Recognizing recurring patterns in log files is crucial for detecting repeated failures or malicious activity. For example, we once identified a repeated log entry pattern that pointed to intermittent system crashes caused by a faulty update.
Time-based analysis: This technique examines log entries within specific time frames to understand event sequences and dependencies. In one incident, we used time-based analysis to trace a system outage back to scheduled network maintenance that conflicted with other critical processes. By analyzing logs in the hours leading up to the issue, we discovered that overlapping changes caused a cascade of failures. This approach is especially useful for troubleshooting complex incidents where timing plays a key role.
These techniques allow you to break complex, individual files into manageable components to structure data, quickly sort it, and surface relevant information. They also structure data to allow it to be imported into a central server, helping you gain a bird’s-eye view of a computer network and its individual components from a central location.
PRO TIP
A centralized monitoring solution streamlines log analysis by aggregating logs from multiple sources, applying filters and analysis techniques to surface relevant information faster. This reduces team overhead and response times, while enabling advanced features like cross-system correlation, simplifying the resolution of complex issues.
What is security log analysis?
Security log analysis is a specialized form of log analysis that your security team can use to examine logs to mitigate security threats. With cybersecurity now a top priority for organizations, effective log analysis has become a critical component of a robust security posture. From my experience, analyzing security logs effectively requires more than just looking for unusual activity—it’s about correlating events across different log sources. Here’s how security log analysis can help:
Detect unauthorized access: Monitoring logs for failed login attempts, suspicious IP addresses, and privilege escalations can help identify malicious activities. I’ve seen how correlating these seemingly isolated events can reveal larger coordinated attacks.
Investigate security breaches: When a breach occurs, log analysis plays a pivotal role in understanding what went wrong. In one case, analyzing logs helped us trace back a data exfiltration event to a compromised user account, allowing us to mitigate the damage.
Real-time threat detection: Advanced security log analysis tools leverage AI and machine learning to detect anomalous behavior automatically. For instance, we once identified malware attempting lateral movement in our network thanks to real-time anomaly detection. Without this, the malware could have spread unnoticed.
Compliance monitoring: In regulated industries (e.g., healthcare, finance), security log analysis helps ensure compliance with frameworks like GDPR, HIPAA, and PCI DSS by maintaining thorough audit logs and generating compliance reports. In my experience, failing to configure security logging properly is a common mistake that can lead to compliance violations.
Integrating log analysis with Security Information and Event Management (SIEM) tools, which automate threat detection and correlate events across the network, is essential to reduce response times and improve overall security posture.
What is event and network log analysis?
Both event and network logs are critical for understanding system health, application behavior, and network traffic flow. Event logs come from individual devices and detail what happens on the systems and any errors. Network logs look at network devices (such as switches, modems, and hardware firewalls) and help network engineers understand traffic flow.
Analyzing these logs can help IT teams ensure system reliability and network performance while preempting potential issues.
Event log analysis
Event logs provide detailed information about system events and application behavior. These logs are invaluable when it comes to:
Troubleshooting application errors: Event logs are the first place I look when diagnosing application failures. For instance, when an internal CRM system crashed intermittently, the event log helped us pinpoint a memory leak causing the issue.
Monitoring system health: By regularly analyzing event logs, IT teams can identify issues before they lead to system outages. I’ve used this to detect disk failures in advance, allowing us to replace faulty hardware without downtime.
Tracking user activity: Event logs can track user activity, including authorization events. This helps ensure that only authorized personnel access critical systems, adding an extra layer of security.
Network log analysis
On the other hand, network log analysis focuses on network devices like routers, switches, and firewalls, helping you understand traffic flow and network health:
Network performance: In my experience, analyzing network logs is essential for spotting bandwidth issues or network bottlenecks. For example, network logs helped us detect and troubleshoot a bandwidth hog disrupting our video conferencing services.
Detecting network anomalies: Network logs can reveal unusual traffic patterns or suspicious connections. A few years ago, a spike in network traffic during off-hours prompted us to investigate. Network logs confirmed data exfiltration attempts, allowing us to take immediate action.
Connectivity issues: Network logs provide crucial insights when diagnosing connectivity problems. They can help you verify whether issues are caused by misconfigured devices, ISP problems, or internal hardware failures.
CONSIDER THIS SCENARIO
You’ve just implemented a routine firmware update on your firewall, and suddenly, your network connectivity starts behaving erratically. It’s a situation that can quickly escalate from a minor inconvenience to a major problem affecting your entire organization.
In these moments, network logs become an invaluable troubleshooting resource. They act as a detailed record of your network’s behavior, offering crucial insights into the root cause of the problem. Here’s what to look for:
TIMING CORRELATION:
Your logs will pinpoint exactly when the issues began, often aligning perfectly with the update’s timestamp.
ERROR MESSAGES:
Keep an eye out for specific error codes related to the new firmware. These can indicate compatibility issues or problems with the update itself.
TRAFFIC ANOMALIES:
Unusual patterns in packet handling or connection resets can signal that your firewall isn’t processing traffic correctly post-update.
CONFIGURATION CHANGES:
Sometimes, updates can inadvertently alter firewall rules. Your logs might reveal these unexpected changes.
PERFORMANCE METRICS:
Sudden spikes in CPU usage or memory consumption on the firewall can indicate that the new firmware is causing resource issues.
By carefully analyzing these log entries, you can quickly identify whether the firmware update is the culprit and take appropriate action. This might involve rolling back to a previous version or applying additional patches to resolve the issue.
Combining network and event log analysis gives a comprehensive overview of your IT environment, helping you maintain end-to-end visibility across both systems and networks. This integrated approach is particularly useful when investigating complex issues, as it lets you see how events in one system may affect network performance and vice versa.
Advanced techniques in log analysis
While basic log analysis can provide immediate insights, the real value comes from using advanced techniques to uncover patterns, correlations, and trends.
Pattern recognition and anomaly detection
Pattern recognition goes beyond manual analysis by using tools to analyze log files—whether individual log files or network logs—to find patterns. It uses machine learning (ML) and statistical algorithms to establish a baseline for “normal” behavior across your systems. Comparing new log entries against this baseline through tools like ML can detect anomalies that might indicate a security breach, performance issue, or other critical event. I’ve found that implementing these tools has significantly reduced false positives, allowing teams to focus on real threats rather than sifting through noise.
For instance, pattern recognition once helped my team identify a recurring issue in a distributed application. We could predict system crashes hours before they occurred, enabling us to implement preventative measures and avoid costly downtime.
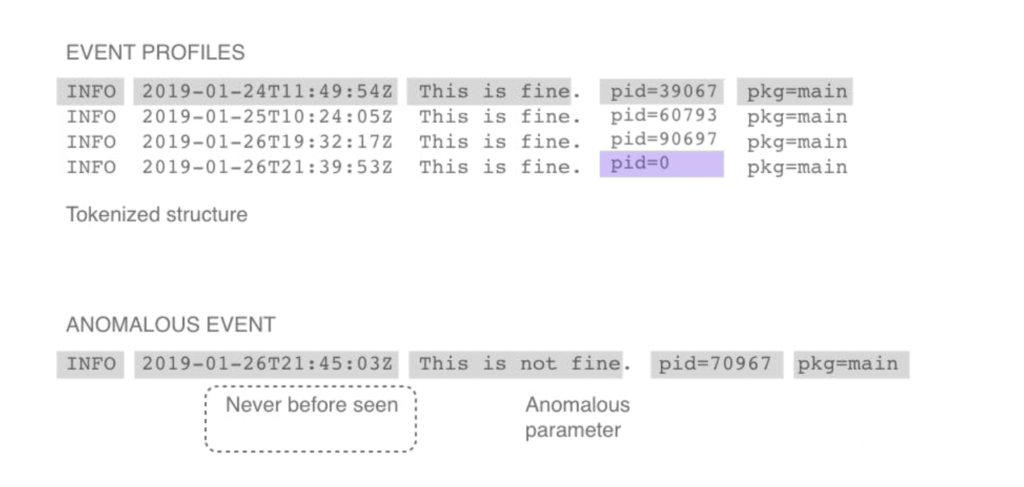
Anomaly detection in log events: Identifying irregularities through tokenized structures, highlighting a never-before-seen parameter in an otherwise consistent event pattern.
Correlation and event linking
Correlation and event linking work by connecting log events across different sources, helping you to piece together the full scope of incidents. For example, a single failed login might not raise alarms, but it could indicate an attempted breach when it’s correlated with similar events across multiple devices. This technique helps teams track the path of attacks and identify the root cause of complex issues.
In one memorable case, event correlation allowed us to stop a malware infection before it spread to critical systems. Multiple unrelated log events pointed to what seemed like minor issues, but once correlated, they revealed the early stages of a significant security incident.
Visualization and dashboards
When dealing with tens of thousands of log events, it’s easy to miss the bigger picture. Data visualization tools can help you spot trends, anomalies, and potential issues in real-time. For example, using a historical performance graph, I’ve been able to visually track performance metrics over time, which was critical in pinpointing an issue. We noticed that performance would degrade noticeably every day at a specific time. This led us to investigate correlated events in the logs, revealing a recurring resource contention issue with a background task that coincided with peak user activity. Without these visualizations, that pattern might have gone unnoticed.
Well-configured dashboards allow for faster incident response and allow both technical teams and executives to make informed decisions based on real-time insights. This empowers informed decision-making for proactive system maintenance or strategic infrastructure planning.
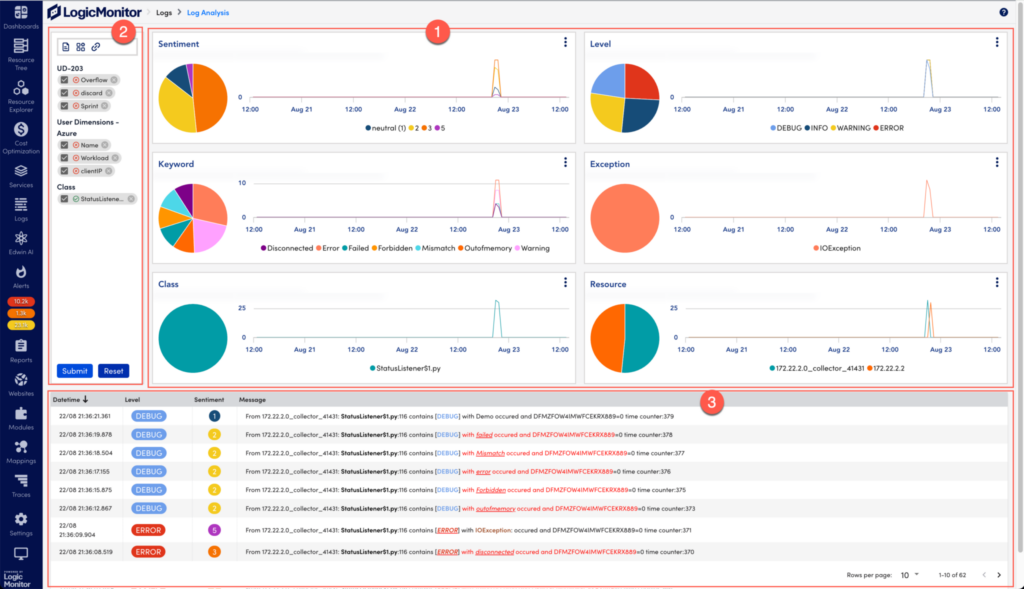
An in-depth log analysis visualization providing real-time insights into log levels, sentiment, keyword occurrences, exceptions, and resources, featuring 1. interactive widgets, 2. customizable filters, and a 3. comprehensive logs table.
Common challenges in log analysis
While the benefits of log analysis are clear, there are also significant challenges to overcome.
Data volume and complexity
The sheer volume and variety of data collected with logs—especially in large enterprises—can be overwhelming.
A few things I recommend are:
Implement efficient log aggregation and storage solutions to ensure only actionable information surfaces
Use scalable platforms to avoid storage problems, lost data, and proper log retention
Use intelligent filtering and prioritization techniques to help you find the necessary information
Focus on what’s critical first so you’re not drowning in unnecessary data.
PRO TIP
Ensure redundancy in log management by implementing backup strategies with both on-premises and cloud systems. This protects against data loss, supports compliance, and guarantees audit trails and log accessibility during storage failures.
False positives and real-time analytics
Another challenge is false positives. I’ve seen teams waste time chasing down harmless events because of poorly tuned alerting systems. Your team can address this challenge in a few ways:
Fine-tune alerting thresholds and rules to surface the most relevant information. In one instance, after tuning our alert thresholds and adjusting the conditions under which alerts were triggered, we reduced false positives by over 50%. By narrowing down the scope of what triggered alerts, we were able to filter out events that were normal system behaviors and focus on genuinely anomalous activity.
Use machine learning algorithms with monitoring software to help isolate the most relevant alerts. These algorithms help isolate the most relevant alerts by learning what normal operational patterns look like over time. In one case, after implementing machine learning-based monitoring, we saw a 60-70% reduction in false positives, as the system became better at recognizing typical behavior and flagging only outlier events.
Use context-aware analysis to improve alert accuracy. For example, a CPU spike might trigger an alert, but context-aware analysis could recognize that the spike coincided with a scheduled batch job, preventing an unnecessary alert. With this method, we managed to trim down our false positive rate even further, leading to a more streamlined and effective incident response process.
Alerting mechanisms
Getting alerting mechanisms to produce the most relevant alerts can be challenging in complex logging environments. The process involves thinking about the most critical information, isolating it, and surfacing it above irrelevant data.
Some solutions are to:
Prioritize alerts based on severity and impact to ensure that your team is responding to the most critical issues first
Implement automated response workflows based on the severity of events, allowing for quicker resolution of common, low-severity incidents while reserving human intervention for more complex issues
Ensure alerts are actionable and provide clear next steps so that responders can immediately know what to do when an alert is triggered, reducing the time spent diagnosing the problem
In one of our environments, we were dealing with a flood of alerts, many of which were of low priority or false positives. By refining our alerting mechanisms to focus on severity and impact, and implementing automated response workflows, we saw a dramatic improvement in our incident response times. For example, we automated responses for low-severity issues like disk space nearing capacity by scripting automatic clean-up tasks. This reduced human intervention by about 30% in these cases.
Additionally, we ensured that higher-priority alerts, such as potential security breaches or application downtime, were accompanied by detailed action steps, reducing ambiguity and the time it took to resolve incidents. As a result, our team’s mean time to resolution (MTTR) for critical incidents improved by 40%, and we responded to significant issues faster without being bogged down by less relevant alerts. This approach enhanced response times, minimized alert fatigue, and allowed our team to focus on the most pressing matters.
Use cases and real-world applications
Log analysis has proven invaluable across many different industries and applications. Let’s explore some real-world log analysis applications and stories we’ve seen that highlight its potential.
CMA Technologies switched anti-virus solutions and encountered problems with virtual machines that caused them to go offline. Their previous infrastructure didn’t offer enough information to perform root cause analysis to find the cause of the problem, putting customers in jeopardy and introducing security issues.
Implementing LM Logs allowed CMA Technologies to receive actionable alerts when a potential issue could bring a virtual machine offline, allowing them to reduce their Mean Time to Recovery (MTTR). It also provided dashboards that offered more visibility into the entire organization.
Bachem’s IT team suffered from major alert fatigue. Although they were able to collect information about what was happening in the IT infrastructure, the sheer number of alerts made it hard to hone in on the important alerts to deal with critical issues.
LogicMonitor offered a solution to help get the most out of log analysis. Proper log analysis reduced the number of alerts and saved the team 10 hours. This allowed them to focus on the important issues and refocus on projects that help the business.
Future of log analysis
Log analysis is evolving rapidly, and the future looks promising for what’s to come on the horizon. Some things I’ve gathered from industry leaders and reports are that:
AI and machine learningwill continue to grow within log analysis to improve predictive analytics, automated root cause analysis, and anomaly detection
There will be faster, real-time processing at the network edge, which will allow organizations to handle exponential data growth
Interactive dashboards and augmented analytics will make data interpretation even more intuitive
There will be better logging capabilities through new technology like IoT devices and 5G connections
With more businesses moving to cloud-native and microservices architectures, advanced logging will be essential to maintain visibility across distributed systems
LogicMonitor Envision’s log analysis features
LogicMonitor Envision’s log analysis feature helps your organization surface errors in log data—helping teams of all levels and industries find problems with just a few clicks.
Instead of indexing, looking through data with query language, or training, you can use AI to analyze thousands of logs. Your data is categorized by severity, class, and keywords, making manual searches obsolete.
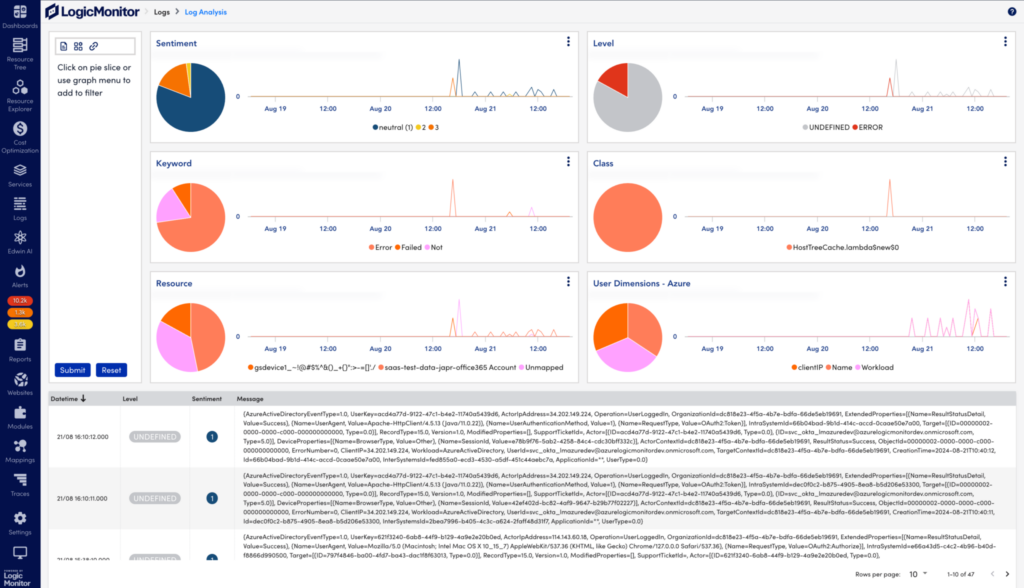
Detailed log analysis interface offering real-time visibility into key metrics supported by interactive charts, dynamic filters, and an organized logs table for efficient troubleshooting.
LM Envision can do this with a few key features:
AI-powered analysis: Automatically categorizes logs to surface information without manual searches and detect anomalies to save you the manual work of categorizing and monitoring information
Intuitive visualizations: Correlates IT and business metrics to understand the true impact of IT performance and perform root cause analysis, helping you troubleshoot faster to reduce MTTR
Sentiment scoring: Prioritizes issues based on severity levels—allowing you to focus on the most critical problems
Negative phrases: Tags logs with negative keywords to surface only important information. For example, add less critical keywords to negative phrases and look at errors that can pinpoint problems
Customizable insights: Tailors log analysis based on your organization’s needs and goals, such as alerting by keyword, sentiment scores, and other filters
Central log management: Centralizes log management to make it easier to monitor system performance, avoid the need to monitor individual devices, and save time
Edwin AI: LogicMonitor’s GenAI-powered assistant allows organizations to use natural language to query log data built using unstructured and structured data from your organization
Wrapping up
Log analysis isn’t just a troubleshooting tool—it’s a strategic asset that can enhance your IT environment’s security posture, performance, and compliance. By leveraging advanced techniques like AI-powered pattern recognition, event correlation, and real-time visualization, your team can proactively address issues before they become critical.