2020 is finally over and all of us are hopeful of a return to a sense of normalcy in 2021. At LogicMonitor, we came back re-energized from a healthy year-end break and are putting the finishing touches on our product roadmap for this year. This is a great opportunity to look back on what we accomplished in 2020 despite all of the challenges we faced.
I am proud to say that we had 16 product releases in 2020 that further our mission to become the most comprehensive, extensible, and intelligent observability platform in the industry. Here we’ve highlighted some of the notable capabilities that were released in 2020.
Jump to:
- Intelligent Log Monitoring With LM Logs
- New Third-Party Application Integrations: ServiceNow and Slack
- Expanded Coverage for AWS, Azure, and GCP Cloud Services
- Kubernetes Updates to Autoscale Monitoring Coverage
- AIOps Early Warning System: Alerting on Anomalous Metrics via Dynamic Thresholds
- Quicker Understanding of Root Cause With Alert Overview Graphs
- Robust Network Traffic Flow Monitoring
- Alerts Page Refresh
- Centralized LogicModule Management With LM Exchange
- Hybrid, Multi-Vendor Enterprise Architectures – Monitor Cisco SDWAN, HyperFlex, Big Data, and Thousands of Other Systems
- Looking Ahead to 2021
Intelligent Log Monitoring With LM Logs
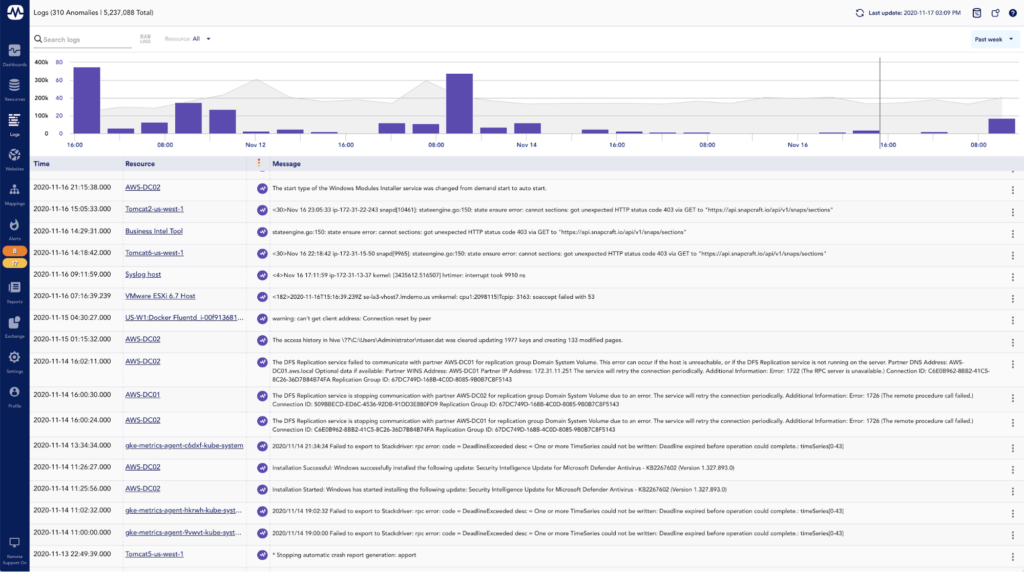
Perhaps our biggest new capability of 2020, LM Logs is an intelligent log monitoring feature that analyzes 100% of log data, identifies anomalies, and surfaces them contextually alongside metrics and alerts for faster troubleshooting. A new logs page within the portal allows you to view logs across your entire distributed environment. Anomaly detection helps surface meaningful events and correlation with metric alerts ensures the right log events are at your fingertips for more seamless troubleshooting.
Want to learn more about LM Logs? Start here.
New Third-Party Application Integrations: ServiceNow and Slack
A new workflow integration with ServiceNow, called the Service Graph Connector for LogicMonitor, expands on the CMDB integration functionality offered by our previous ServiceNow integration. Notably, data can now be synced bi-directionally, enabling a single source of truth with real-time, accurate, and relevant details maintained in both LogicMonitor and ServiceNow. Enhanced alerting and customization allows customers to more meaningfully manage that data.
A new app for Slack was also released in 2020. This new alert integration between LogicMonitor and Slack is bi-directional, supporting the ability to route LogicMonitor alert notifications to Slack, open and acknowledge alerts from Slack, and put resources into SDT from Slack, among other capabilities.
Want to learn more about Service Graph Connector for LogicMonitor? Start here.
Want to learn more about the LogicMonitor app for Slack? Start here.
Expanded Coverage for AWS, Azure, and GCP Cloud Services
LogicMonitor’s cloud monitoring coverage saw huge growth in 2020. Since 2019, we have expanded AWS service coverage by 60%, Microsoft Azure service coverage by 30%, and more than doubled GCP service growth at 150%. Some examples of new services that we’ve added coverage for include AWS Elemental Services, Trusted Advisor, Step Functions, Elasticsearch, Azure Front Door, Load Balancer, Virtual Network Gateway, Backup, Site Recovery, GCP Cloud DNS, Cloud VPN, Cloud Run, Cloud Composer, Compute Engine Autoscaler, and Bigtable.
Complementing our coverage growth, LogicMonitor also added support for four new AWS and two new Azure regions to meet the needs of our global customer base.
Want to learn more about cloud monitoring? Start here.
Kubernetes Updates to Autoscale Monitoring Coverage
As with cloud monitoring coverage, LogicMonitor’s Kubernetes monitoring coverage also saw huge growth in 2020. We expanded our out-of-the-box coverage to monitor endpoints, endpoint slices, CoreDNS, and HPA resources. And we added support for Kubernetes 1.16-1.18 to ensure compatibility with newer clusters, as well as added support for AWS Bottlerocket container-optimized OS.
To accommodate all this growth, discovery filtering was implemented to provide better control of what is added into monitoring. In addition, the performance was significantly improved by implementing auto-retry and LM API rate limit compatibility to ensure successful resource addition, deletion, and update.
Want to learn more about Kubernetes monitoring? Start here.
AIOps Early Warning System: Alerting on Anomalous Metrics via Dynamic Thresholds
In late 2019, LogicMonitor released dynamic thresholds, which were capable of suppressing alert notification routing if the alert’s triggering value was not deemed anomalous by our anomaly detection algorithms. In mid-2020, we significantly enhanced the capabilities of dynamic thresholds to provide automated alerting on values that fall outside expected data ranges, enabling your teams to operate more efficiently and detect anomalies sooner.
Want to learn more about dynamic thresholds? Start here.
Quicker Understanding of Root Cause With Alert Overview Graphs
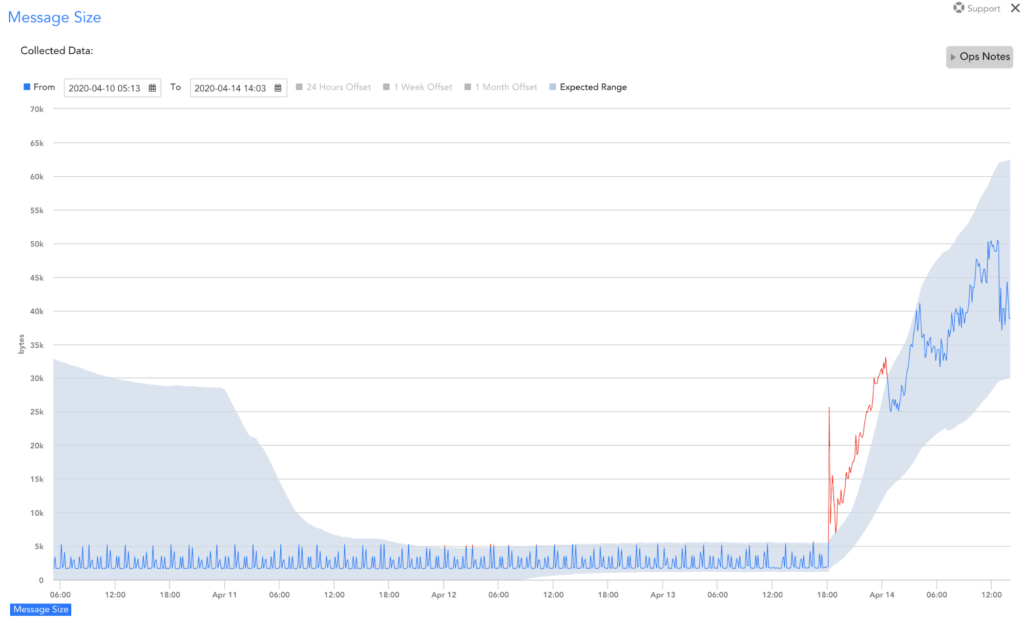
A new alert overview graph was added to the details of alerts triggered by datapoints. This graph plots 60 minutes of data collected for the datapoint and displays in both the LogicMonitor UI (Alerts page) and the body of delivered email notifications. It features the expected datapoint value range (based on anomaly detection algorithms) alongside the value(s) that triggered the alert, providing a quicker understanding of alert root cause.
Want to learn more about alert overview graphs? Start here.
Robust Network Traffic Flow Monitoring
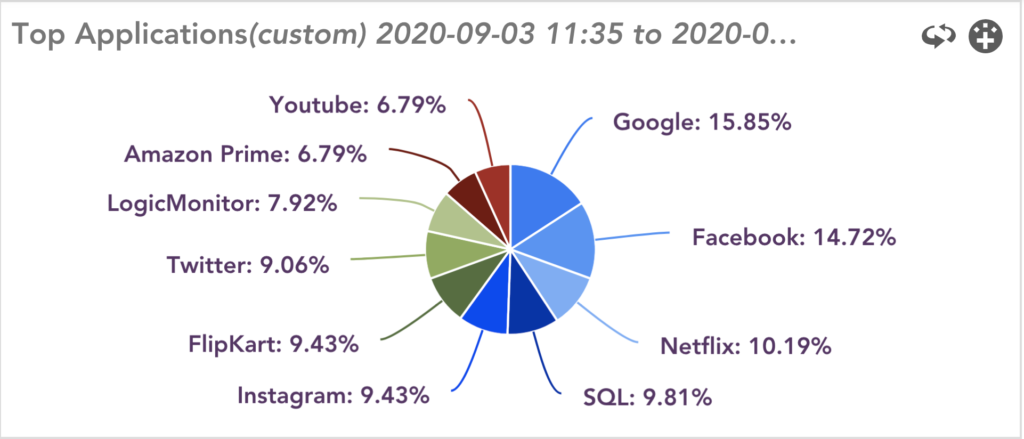
2020 brought a whole new level of network traffic flow (NetFlow) monitoring to the LogicMonitor platform. Most notably, we added support for the Network Based Application Recognition (NBAR2) protocol, which allows for robust identification of applications generating traffic. The addition of NBAR2 nicely rounds out our suite of supported network traffic protocols which already included NetFlow, JFLOW, sFlow, and IPFIX.
Other network traffic flow enhancement made throughout 2020 include expanded and more integrated IPv6, increased granularity of filtering to allow you to better pinpoint explicit traffic, and numerous under-the-hood efficiencies that led to significantly increased capacity for the flows per second that can be comfortably monitored by a Collector.
Want to learn more about network traffic flow monitoring? Start here.

Alerts Page Refresh
In 2020, LogicMonitor released significant UI enhancements for the alerts page. The new UI brought the increased efficiency many of you asked for such as increased data density, a dedicated detail summary view, fewer clicks to accomplish a task, and faster loading times. Along with increased efficiency, the new UI also delivered new functionality, including the ability to escalate and annotate multiple alerts at once from the bulk actions menu.
Want to learn more about the alerts page interface? Start here.
Centralized LogicModule Management With LM Exchange
LogicMonitor offers an ever-expanding library of LogicModules to bring you out-of-the-box monitoring for the networking devices, applications, databases, services, and other systems and tools your enterprise relies on. With the introduction of the new Exchange page in mid-2020, we made it significantly easier for you to maintain this library.
The Exchange page resides in your portal and provides a centralized view of LogicModules. This view includes not only those LogicModules that live locally in your portal but all LogicModules available in LogicMonitor’s global repository. It’s the new home for LogicModule management.
Want to learn more about LM Exchange? Start here.
Hybrid, Multi-Vendor Enterprise Architectures – Monitor Cisco SDWAN, HyperFlex, Big Data, and Thousands of Other Systems
It’s not an exaggeration to say that we released upwards of 1,000 new monitoring LogicModules in 2020—all representing new and enhanced monitoring across the various devices, cloud resources, services, systems, configurations, topologies, and logs that enterprises need visibility into.
Although too numerous to name individually, some noteworthy new systems that we introduced out-of-the-box monitoring coverage for in 2020 include Apache Hadoop, Fortinet, Office 365, Slack, Zoom, and a large number of Cisco systems (HyperFlex, Intersight, ISE, Meraki, SD-WAN, UCS, WLC, and others).
Looking Ahead to 2021
LogicMonitor further plans to ramp up our innovation engine in 2021 and continue with the theme of “See More”, “Know More”, and “Do More”. For “See More”, you will see us expand the coverage with quick out-of-box integrations with a variety of popular SaaS services and peak deeper into your application stack. “Know More” advancements will include continued expansion of LM Logs capabilities and application flow analytics with our machine learning engine. Our customers “Do More” with our open API based approach and various integrations that automate their workflows. In 2021 we continue to evolve our “Do More” strategy with deeper integrations around Ansible, Terraform, and other widely deployed automation tools.
If you are interested in learning more about LogicMonitor’s capabilities, connect with your customer success manager or submit a free trial request.

Subscribe to our blog
Get articles like this delivered straight to your inbox


