Here at LogicMonitor we serve hundreds of managed service providers with our cloud-based performance monitoring platform. “MSPs” range from true blue service providers, to Cisco VARs, to Cloud Providers and System Integrators. MSP monitoring typically means using LogicMonitor to monitor their own equipment and hosted apps. Many also will drop a LogicMonitor collector at a customer site or remote sites to monitor critical customer side infrastructure. Our flexible deployment model avoids the hassle of setting up VPNs that legacy premise-based monitoring tools require.
Lately I’ve spent a lot of time in airports and freeways to better understand our MSP customers, and I’m amazed by their expert use of LogicMonitor and their willingness to share best practices to help other MSPs monitor better (and make more $!). I’d like to thank a couple of MSPs in particular — Sagiss (in Big D) and CIO Solutions (in our hometown of Santa Barbara) — for contributing to help us build a best practices guide for using LM within MSPs. Here’s the first in a series to help MSPs get the most out of LogicMonitor, and hopefully contribute to your success.
Setting up LogicMonitor for your NOC allows you to easily manage client’s alerts with your own NOC team.
- Deploy a backup collector (we won’t charge extra) – Deploy 2+ collectors per customer site. Put the second collector on a backup DC or non-production machine. A backup collector ensures automatic failover to ensure your monitoring is protected against network, machine, or operating system problems. And protecting your monitoring means you are preventing extended downtimes.
- Setup the LogicMonitor collector with domain admin credentials to avoid repetitious inputs into LM. See help files Domain controllers and remote windows computer credentials access.
- Organize your clients into groups. Standardize user and group naming across LogicMonitor. This will allow you to edit settings on a group level as well as give you an overall visual of your clients. Use naming that flow with your business SOPs. More information at manage groups.
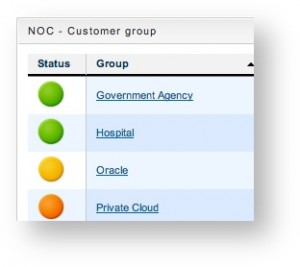
- Set up a NOC dashboard. Easily view all your NOC related metrics in one window. Make the NOC dashboard visible to the NOC team. Some teams display rotating dashboards on a large LCD to get a real time view on systems’ health. More on how to set up dashboards.
- Set up alerts:
Minimize noise: Customize your alerts so you get notified only on events that are important to you. Learn more.
ConnectWise: Utilize the PSA API for alert-ticket-tracking workflow. Learn more aboutLogicMonitor’s ConnectWise integration.
Priorities: Create tickets on critical errors, not on warnings. This means you’ll need to tweak some datasources to avoid going into error or critical. For example, ping avgrtt should only be warn so that you can see issues through LM but you don’t want a ticket every time. Learn more.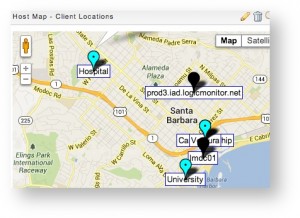
- Split up your Windows events into logical groupings so that you can adjust them on a global level. Some examples are Backup Events, Domain Controller Events, and Exchange Events. In each of the events create global exclusions based on message and/or event IDs. Create individual host filters to just have a particular host not trigger an alert for a given eventid or message. Separating events into logical groupings enables you to turn off a single event source on a host rather than all events.
- Create a shared report account (set read-only for reports) to allow customers (non-users) to access the console to run reports as needed.
Subscribe to our blog
Get articles like this delivered straight to your inbox


