IT monitoring is a complex field with several approaches to manage monitoring and alerts. Most of the current monitoring solutions provide Static Threshold-Based alerting, where IT Operations staff are notified when resource utilization breaches the defined threshold. The problem with Static Thresholds is that these are manually adjusted, and tuning it to meet the specific environment and needs of an organization is a major challenge for IT Operations teams.
Dynamic thresholds, on the other hand, offer a more adaptive approach, automatically adjusting thresholds based on real-time data collection and reducing the noise of unnecessary alerts. However, they are not a one-size-fits-all solution and may not always be the best option in every scenario.
In this article, we’ll explore the pros and cons of both static and dynamic thresholds, providing insights on when to use each to best fit your monitoring needs.
Key takeaways


When to choose dynamic thresholds
Understanding the need for varying thresholds
Identifying the proper thresholds for performance counters is no easy task. Moreover, tuning also limits the flexibility for application. It effectively means the same threshold is used across many servers despite those servers running different applications. For example, a 70% CPU utilization for a busy server is normal and doesn’t need to generate an alarm, whereas, for a relatively underutilized server, even 50% CPU utilization could mean something is wrong. Also, the same asset (such as a server or firewall) does not exhibit the same performance during different hours of the day or days of a week simply because the load is different.
My favorite example is the active directory server, which typically attracts a lot of traffic during morning hours when people log in but goes quiet during off-business hours, including weekends. Setting a reliable static threshold is always a challenge for environments where the load is not constant and shows some seasonal characteristics.
Dynamic thresholds adapt in real-time, cutting through alert noise to help you focus on what truly matters on dashboards.
Managing alert fatigue: How dynamic thresholds help
Manually adjusting the threshold takes time and until it is achieved perfectly, real issues are not alerted by the monitoring solution. Monitoring solutions might report a lot of false positives, flooding the mailboxes of IT Operations teams with false alarms. The alert fatigue caused by the noise of false positives increases the risk of missing out on true positives.
Dynamic thresholds not only adapt to real-time data but also enable more proactive issue and anomaly detection, allowing IT teams to address potential problems before they escalate.
Handling cyclic variations with dynamic thresholds
Static Thresholds are also not very good with cyclic variations. There could be normal weekly and monthly variations in the performance counter, which is acceptable as per the needs of the business, but maintaining different thresholds for specific periods manually is time-consuming and prone to false alarms.
When to use static thresholds
Smart monitoring solutions analyze the pattern of metrics, learn what is normal in the environment, and generate alerts only when things (read metrics) are outside of the already established normal. These solutions need to be aware of cyclic variations and should cater to changes in the pattern of metric during various cycles. Since tuning is automatic, it is less of a hassle. Infrastructure monitoring tools that visualize the patterns and help to automatically create thresholds are less time-consuming than those that require manual adjusting.
Having said that, there are some scenarios where it makes more sense to use Static Thresholds. For example, when you want to be notified that a metric value changes from a previous value, i.e. on delta. In this case, it’s best to use Static Thresholds, as Dynamic Threshold works on data streams, not on the rate of change in consecutive values. Additionally, using Dynamic Thresholds on status values like API response (200, 202, 404, etc.) codes will not be helpful because response codes are not numerical values, and the confidence band generated on these will be misleading.
Static thresholds are simple but can overwhelm IT teams with irrelevant alerts in dynamic environments.
How LogicMonitor uses dynamic thresholds to reduce alert noise
The most prominent problem IT monitoring teams experience with Static Thresholds is the deluge of alerts and being able to understand what is truly useful and actionable out of the abundance of noise. LogicMonitor solved this problem in a phased manner with the first phase, reducing alert noise. We built a system that analyzes patterns of metrics, generates Dynamic Thresholds, and leverages these thresholds to reduce alert noise. When Static Thresholds are poorly set (or inherited from the default settings), the monitoring solution will generate countless alerts, and most of them will be useless. Now, we are using confidence bands generated by sophisticated machine learning algorithms, aka Dynamic Thresholds, to stop this alert noise. When an alert is triggered, and the value falls within the confidence band, our system will not route that alert. The alert will effectively be suppressed.
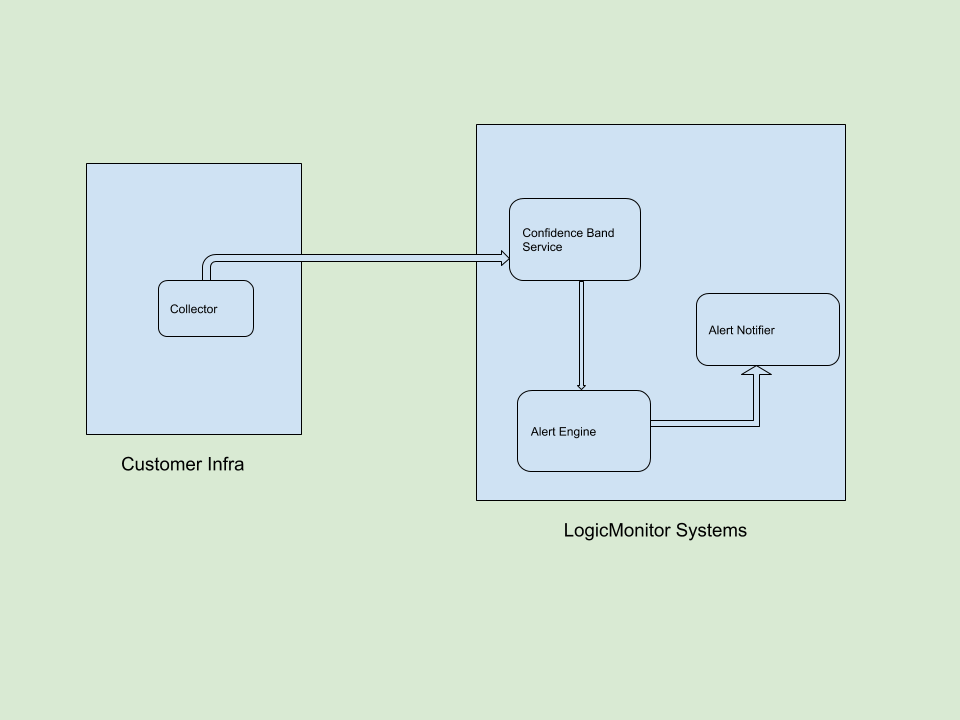
We use two independent components to achieve this alert reduction feature: one is an algorithm-centric service that generates confidence bands at regular intervals, and the second one is our sophisticated alerting system, which consumes this confidence band and, based on this, decides whether to route the alert or not.

This alert suppression feature was released to our customers in December 2019. While phase-1 was all about suppression, phase-2 is about generating the alerts by exploiting the bands generated by the ML algorithm. In phase-2 we are bringing the capability to define Dynamic Thresholds and generate alerts based on this definition. This gives users a powerful ability to tune the alert severity by quantifying how far the current reading deviates from the normal or baseline identified by our ML algorithm.
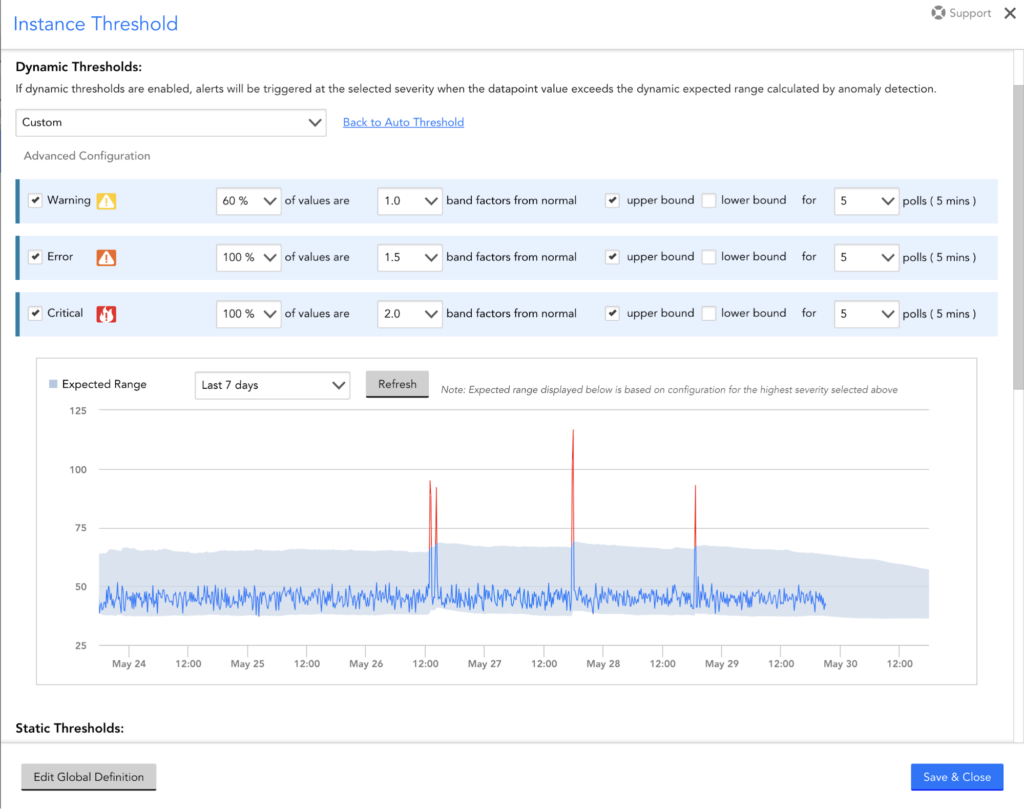
When alert suppression and alert generation are combined, false positives are minimized and true positives are maximized. LogicMonitor users will be getting the best of both worlds – alerts generated based on poorly set Static Thresholds will be suppressed, reducing noise, and when the metric value goes beyond a threshold, our Dynamic Threshold-based alert engine will generate an alert. We have built a sophisticated user interface to define Dynamic Thresholds and we are also providing a visual aid to help tune these settings.
Users can choose to generate a warning alert when 60% of values from the last five polls deviate by one band from the upper.
For example:
Confidence Band : (low:20, high:60, middle:40)
HighBand : (high – middle) : 20
LowBand : (middle – low) : 20
So, if for the last five polls, values are 65, 82, 81, 70, 84. Here, three values [82,81,84] (60%) are one band away from high (60), and our engine will trigger a warning alert.
Alert Engine works on a sliding window pattern, considering the last number_of_polls values for each evaluation.
Users can use the interactive chart displayed in the following image to tune the Dynamic Threshold definition.

LogicMonitor has also enhanced our alert workspace, now each alert generated using Dynamic Thresholds will be accompanied by a confidence band graph with additional information in it. This graph will also be sent out in email notifications.

With this feature, LogicMonitor’s AIOps team has built a system that provides more value to customers and reduces countless hours spent manually adjusting Static Thresholds. We will continue to enhance this feature and our confidence band generator system to provide more value to customers in the future.
Implementing dynamic thresholds: A step-by-step guide
Implementing dynamic thresholds can greatly enhance your IT monitoring by reducing noise and focusing on meaningful alerts. Here’s a step-by-step guide to help you implement dynamic thresholds effectively:
Step 1: Initial configuration
Start by identifying the key performance metrics that are critical to your environment. This includes CPU utilization, memory usage, network latency, and other performance indicators that typically vary based on workload. Configure your monitoring solution to collect and analyze datasources for these metrics continuously.
Step 2: Leverage historical data
Dynamic thresholds rely on historical data to establish patterns of normal behavior. Use historical data spanning different time periods—such as weeks or months—to capture cyclic variations. For instance, analyze daily, weekly, and seasonal trends to set a solid baseline. This baseline will be crucial for the system to automatically adjust thresholds according to the typical behavior observed during different cycles.
Step 3: Fine-tune threshold sensitivity
Not all alerts are created equal. Adjust the sensitivity of your dynamic thresholds to align with the criticality of each metric. For example, set tighter thresholds for metrics where deviations can lead to immediate service impacts and looser thresholds for less critical metrics. Use a sliding window pattern to evaluate metric deviations over recent data points, allowing your system to respond swiftly to real-time changes while avoiding overreaction to minor fluctuations.
Step 4: Integration with existing monitoring systems
Ensure that your dynamic thresholding integrates seamlessly with your existing IT monitoring tools. This might involve configuring APIs, plugins, or other connectors to feed data into your monitoring solution. It’s essential to keep your monitoring environment cohesive so that alerts generated from dynamic thresholds are visible and actionable alongside alerts from static thresholds or other monitoring rules.
Step 5: Continuous monitoring and adjustment
Dynamic thresholds are not a set-and-forget solution. Continuously monitor the performance of your dynamic thresholds and adjust them as your environment evolves. Regularly review alerts and threshold calculations to ensure they still reflect current operational patterns. Implement a feedback loop where alerts and responses are used to fine-tune the system further, enhancing its accuracy over time.
Take the next step with LogicMonitor
Ready to reduce alert noise and improve your IT monitoring with dynamic thresholds? Discover how LogicMonitor’s AIOps Early Warning System can help you streamline incident management and optimize performance.

Subscribe to our blog
Get articles like this delivered straight to your inbox


