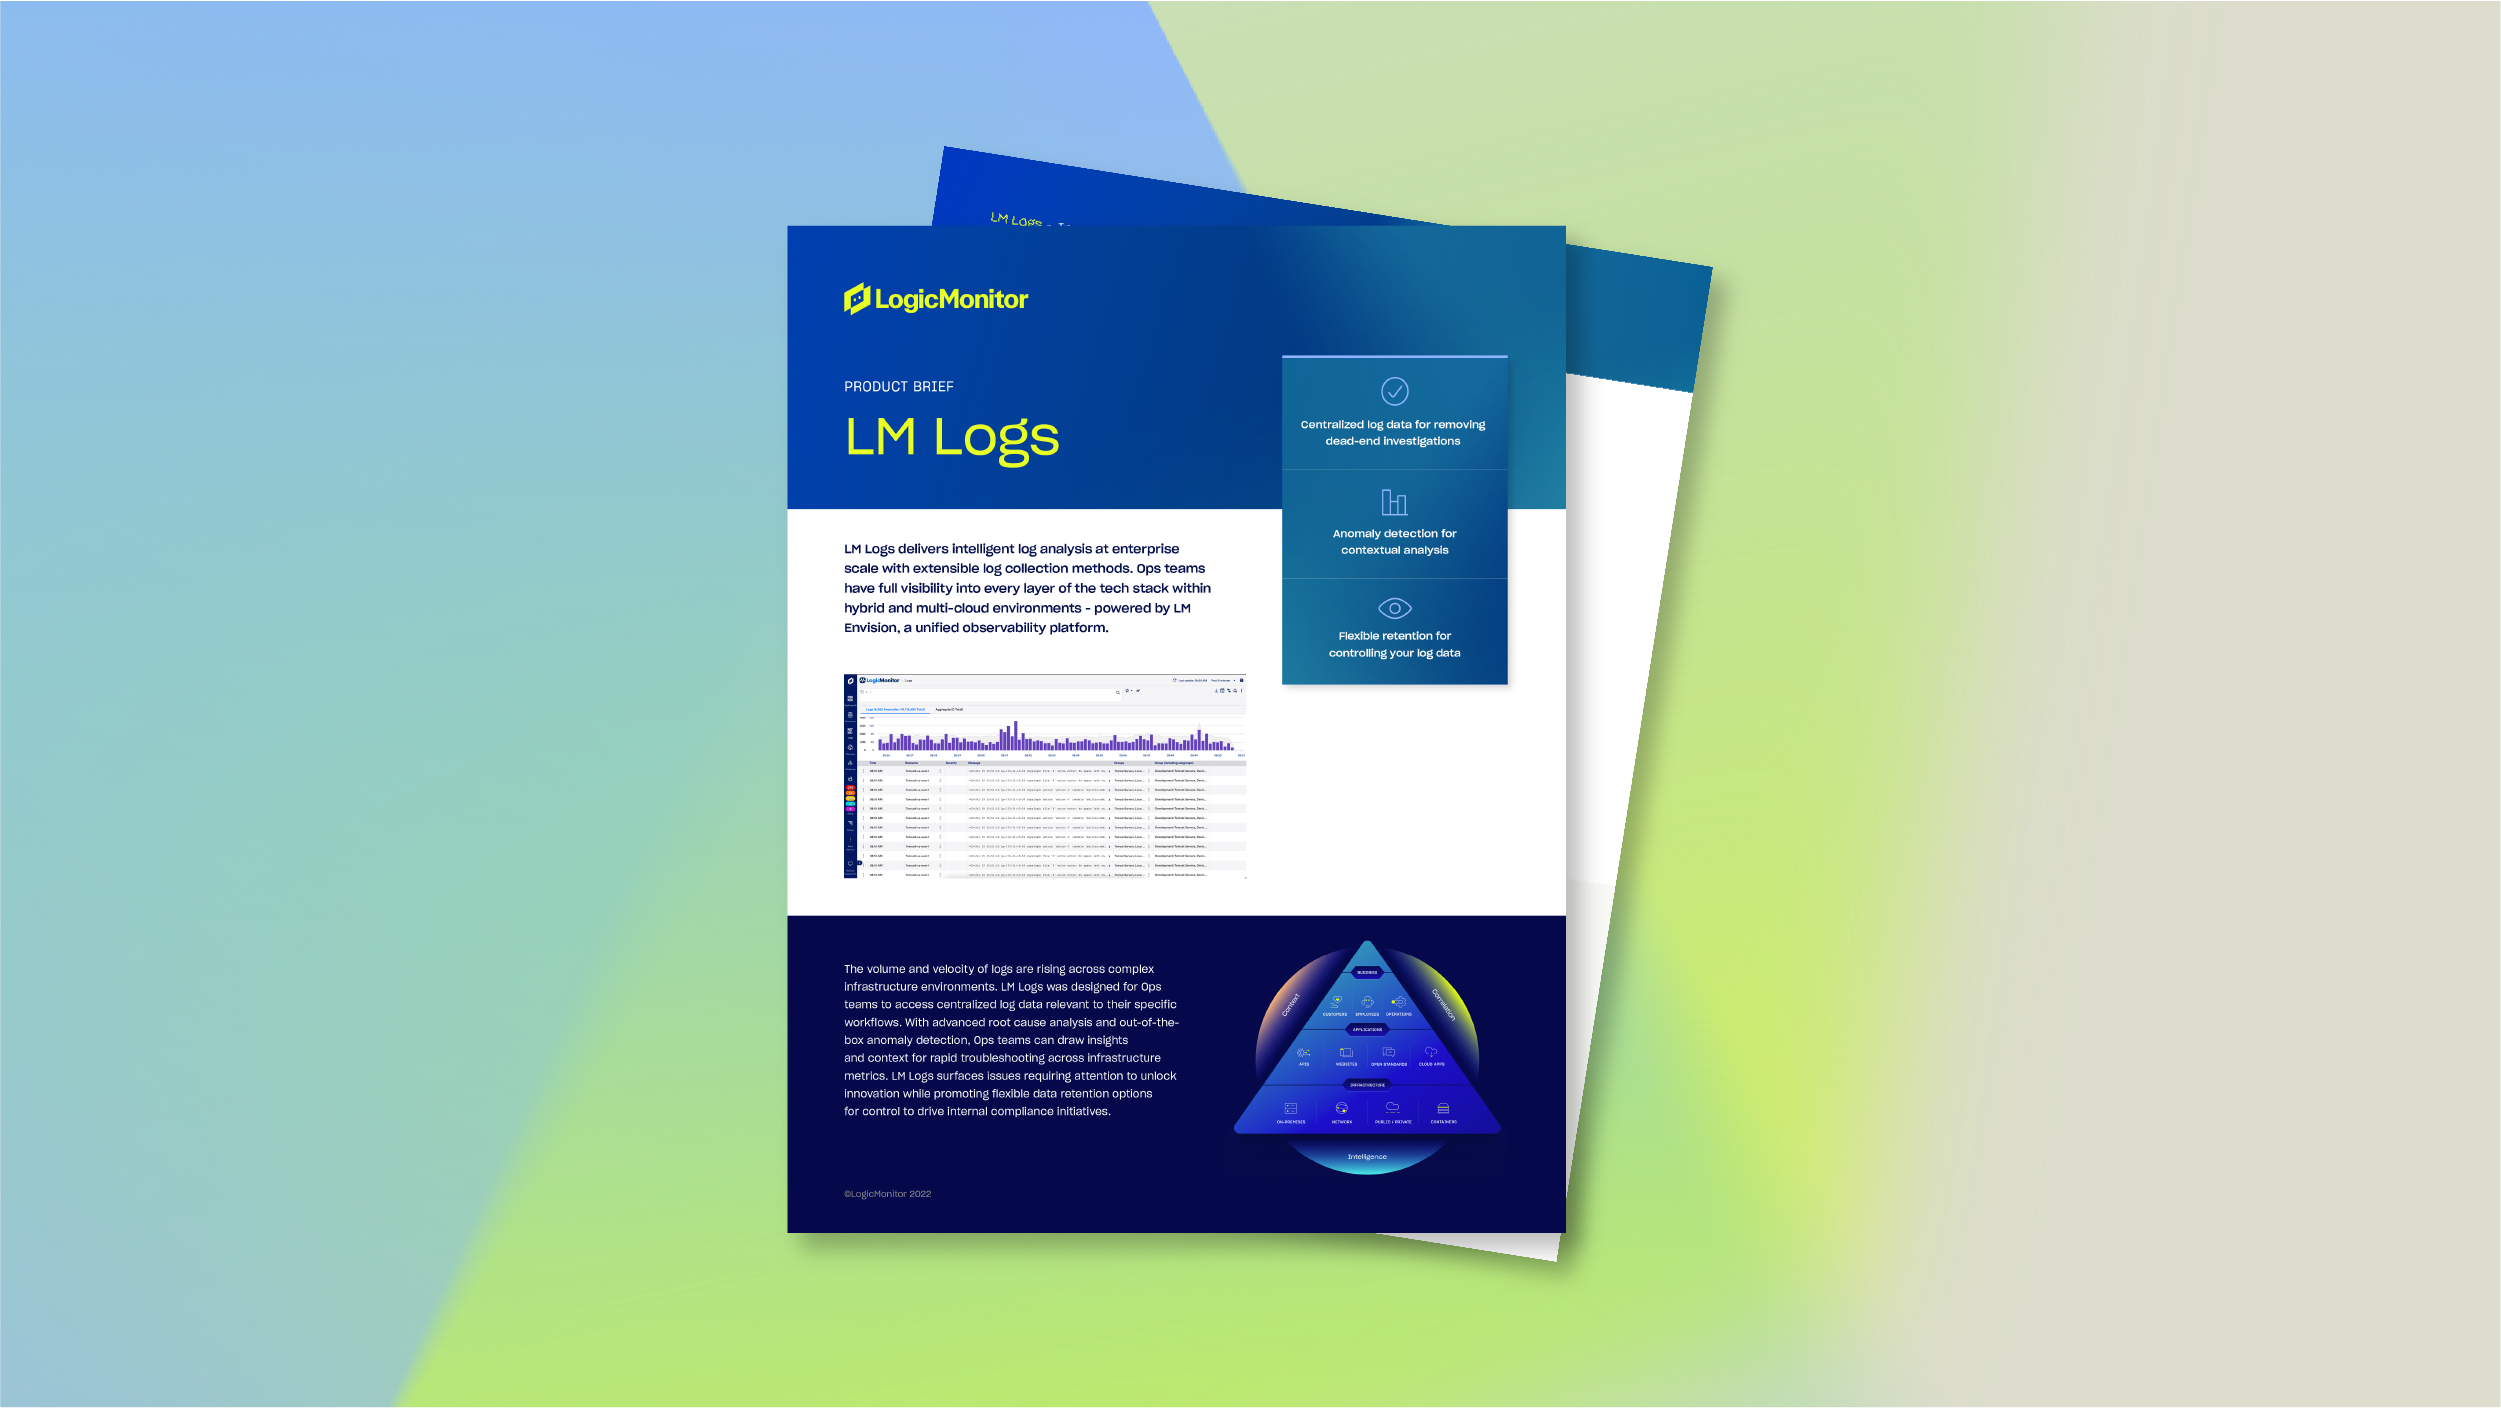
Intelligent log management & analysis
Quickly identify anomalies and correlate logs, metrics, and traces for faster MTTD, MTTI, and MTTR.
Trusted by leading organizations




Benefits
Advanced correlation without context switching
- Analyze logs alongside performance metrics, devices, resources, groups, and alerts
- Eliminate silos, consolidate tools and reduce context switching between disparate monitoring products and logging solutions
Immediate insights for all experience levels
- Intuitive interface and AI-guided troubleshooting empower all experience levels to quickly find, analyze, and resolve log data without complex queries
- Effortlessly drill down, visualize trends, and view summaries to take immediate action
Flexible retention and hot storage
- Choose from tiered data retention plans (7-day, 30-day, 90-day or 1-year) that scale with your business and compliance needs.
- Hot storage ensures your log data is always accessible
Identify issues before they escalate
- Detect anomalies and identify potential issues with log anomaly detection
- Reduce alert fatigue with stateful alarm clearing, ensuring only relevant, unresolved issues trigger notifications
- Forecast trends or capacity needs using historical log data in hot storage
Monitor what matters
- Monitor logs across networks, cloud platforms (AWS, Azure, GCP), applications, and containers like Kubernetes
- Leverage 3,000+ integrations and pre-built templates for seamless hybrid observability in a unified log management platform
Product features
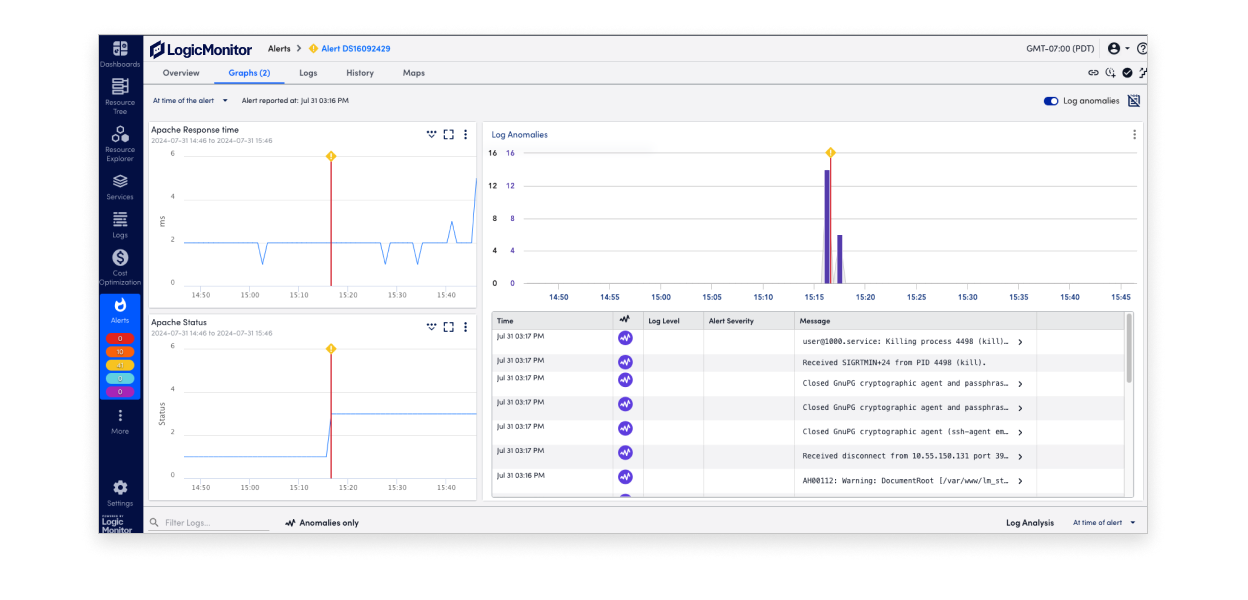
Unified logs and metrics
A single platform for Ops teams to collect and analyze logs in context
Eliminate context switching by correlating relevant logs with metrics in a single platform with over 3,000 integrations.
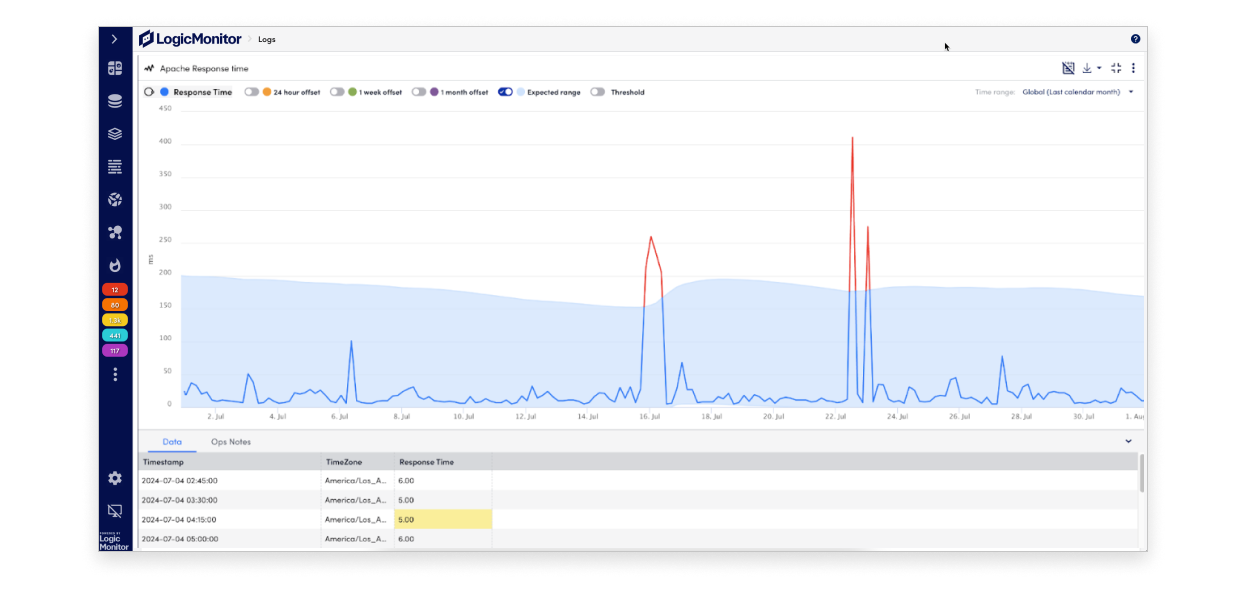
Log anomaly detection
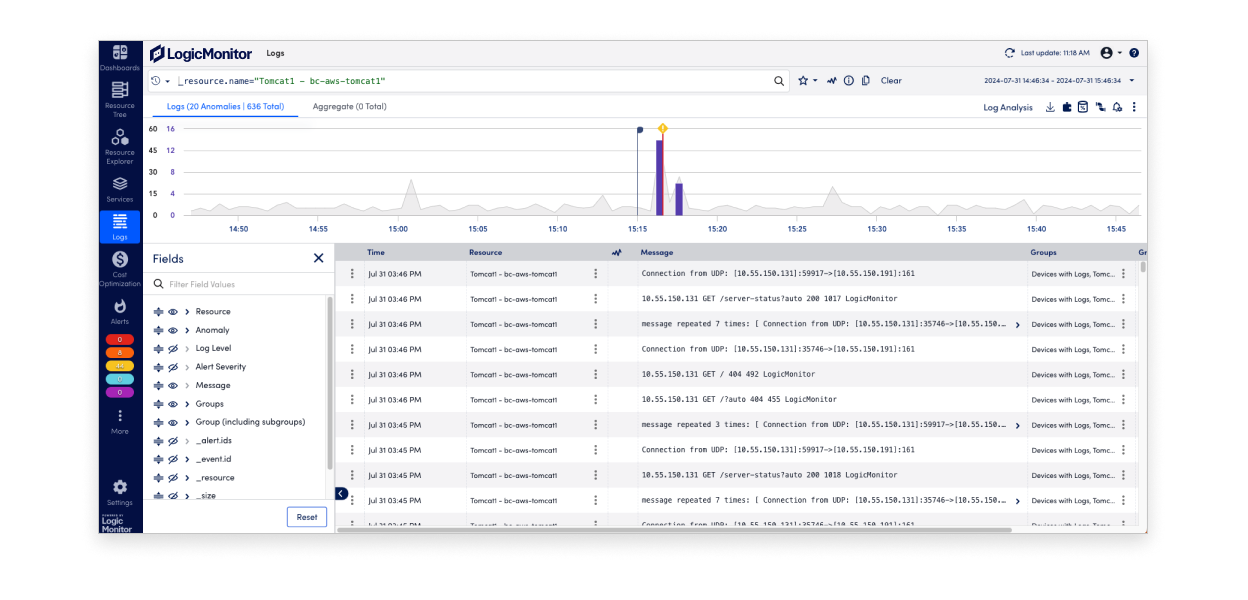
Find the needle without the haystack
Identify unusual events in your log data that don’t conform to normal expected patterns so you can catch issues before they escalate into more severe events.
Log Analysis
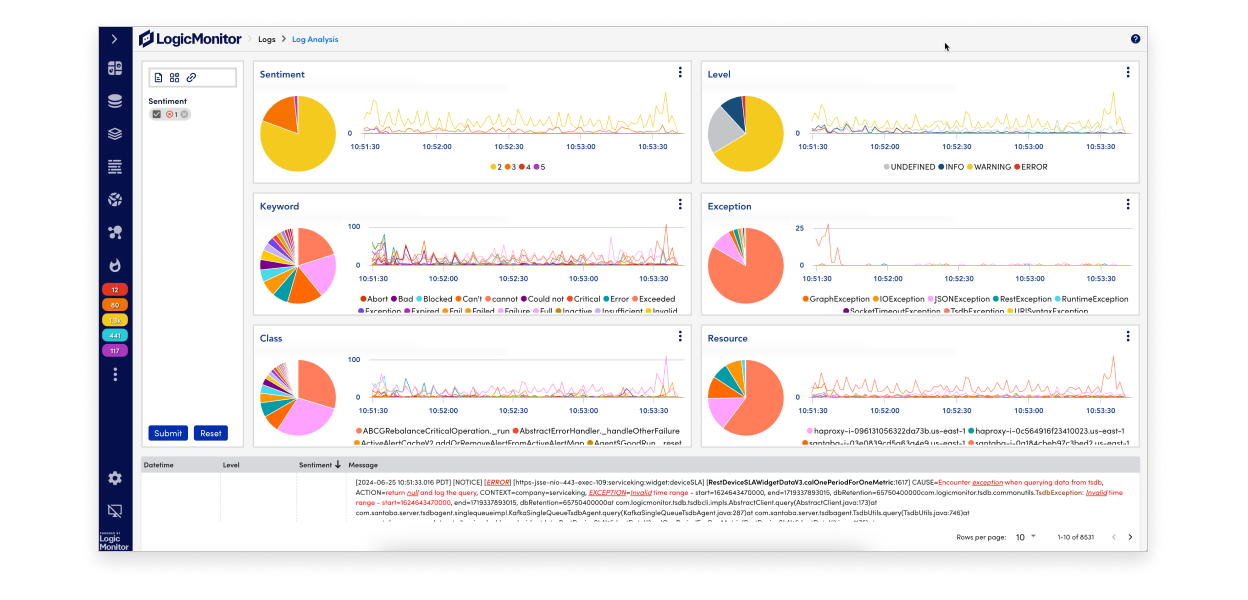
Automatically visualize log errors
Instantly visualize and filter errors with AI—no queries or training needed. Prioritize and resolve critical issues faster.
Log alerting
Reduce alert fatigue and speed up MTTR
Get more flexibility into how log alerts are generated and cleared. Customize log alert conditions based on log events and log pipelines to send a notification when a certain log event or anomaly occurs.
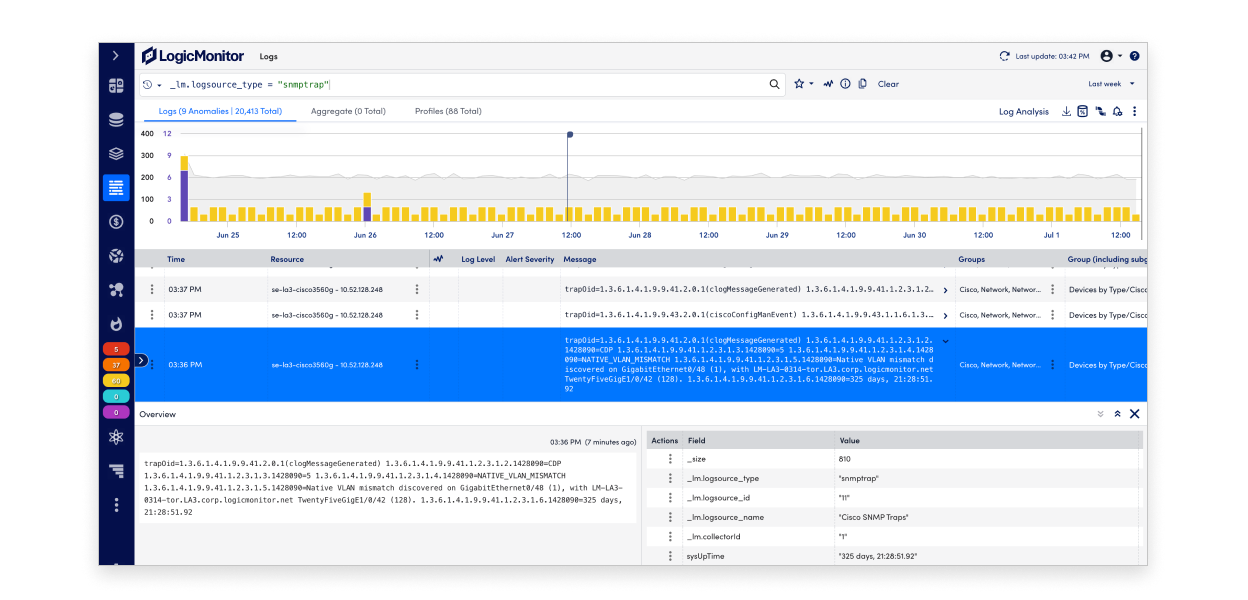
SNMP Traps as Logs
Eliminate blind spots and quickly troubleshoot network issues
Enable real-time, event-driven notifications for critical networking issues. Send the traps through LM Envision and let LogicMonitor do the heavy lifting for you to surface actionable insights and important alerts like equipment vendor certification changes, notification failures, or repeated login failures.
More resources
Get started
Transform your log data into actionable intelligence. Contact us today to learn more about how LogicMonitor can help you unlock the full potential of your log data.
FAQs
- How does LogicMonitor streamline log ingestion?
You can ingest logs into LogicMonitor from a variety of sources and technologies via log collectors/aggregators/API’s for centralized log management and collection. Popular log collectors we support include FluentD and Logstash. You can also use the Logs REST API to send log events.
- How does LogicMonitor ensure efficient log maintenance and monitoring?
Each device, system, or application generates its own logs, which are often kept locally, but users can centralize their logs in LogicMonitor in context and alongside metrics that are collected for monitoring purposes. Once the logs are centralized, users can search through the logs to find the information they need and get alerted when anomalous logs are identified. Users can also use the logs quickly and easily during investigations of metrics that have triggered alerts by exceeding thresholds.
- How can LogicMonitor’s log analysis provide deeper insights?
Log analysis helps make sense of your log data. Systems can generate thousands of logs per day and finding the log that you need can be challenging. When log data is analyzed, log data can provide more insight and context into what’s happening. Log analysis could include analyzing every log for the log severity written in the log and being able to search for the severity that is the target of your investigation. Additionally, all logs are scanned for anomalous behavior and surfaced as something new or unusual which can often be problematic and help shortcut investigation time during incidents.


