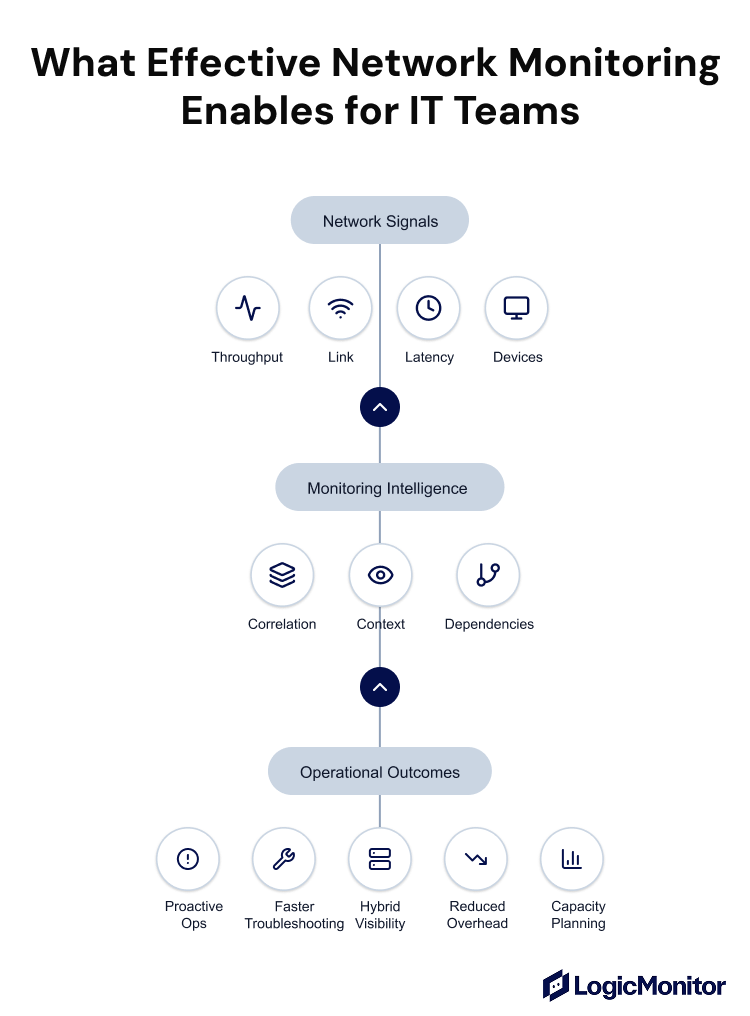
Network monitoring gives IT teams real-time visibility into the performance, availability, and health of their infrastructure
Network monitoring helps teams detect performance issues before users are impacted, not after complaints start.
Modern networks require unified monitoring across on-premises, cloud, and hybrid environments, not isolated tools.
Metrics like latency, packet loss, and jitter are early indicators of application and user experience problems.
Network monitoring is becoming harder due to higher traffic volumes, encryption, and growing visibility blind spots.
Network monitoring is the continuous process of tracking the health, performance, and availability of a network to ensure it operates smoothly. It helps you understand how data moves across the network and how devices perform, to track any network issues before users are impacted.
In this article, we’ll explore what network monitoring is, how network monitoring systems work, and what are the key challenges that your team may come across.
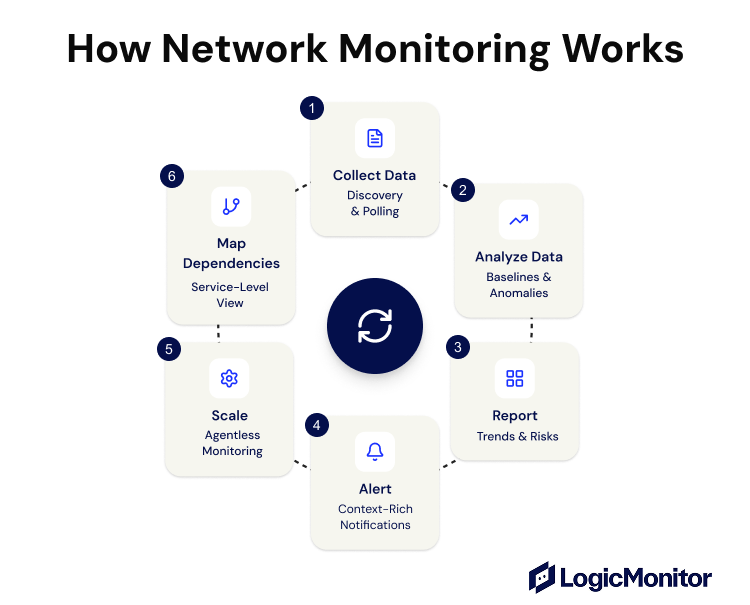
How Network Monitoring Works (Step-by-Step)
Network monitoring works as a continuous loop because network conditions are always changing. Devices come and go, traffic patterns shift throughout the day, and performance issues can appear without warning.
That’s why monitoring systems repeatedly collect data, analyze it for abnormal behavior, present it in a usable way, and alert teams when something needs attention.
Once that cycle completes, it immediately starts again, creating a real-time feedback loop rather than a one-time check.
1. Collect Data to Discover and Observe the Network
Network monitoring often starts by identifying what exists in the environment through automated discovery or manual onboarding. When using automated discovery, modern platforms rely on techniques such as:
IP range scanning
DNS queries
Standard protocols like SNMP, ICMP (ping), NetFlow/sFlow
Native cloud and SaaS APIs
These techniques detect routers, switches, firewalls, servers, interfaces, and cloud resources, which can then be configured or automatically enrolled for monitoring. Once discovered and configured, the system begins regular polling, typically every 1–5 minutes.
Application- or service-specific statistics when available
Over time, this repeated collection builds a historical record of normal behavior, which helps understand change and the current state of your networks.
2. Analyze Data to Turn Raw Metrics Into Meaningful Signals
Instead of relying only on static thresholds (for example, CPU > 80%), modern monitoring systems analyze historical data to establish performance baselines.
These baselines reflect how a device or service behaves under normal conditions, including daily peaks, weekly usage cycles, and seasonal trends.
For example:
If a server typically handles 500–700 requests per minute during business hours, the system learns that pattern.
A sudden spike to 1,200 requests may not cross a static threshold, but it is statistically abnormal and worth investigating.
The monitoring platform continuously compares live data against these baselines to detect:
Network congestion and bandwidth saturation
Resource misconfigurations (e.g., incorrect routing, CPU limits)
Hardware degradation (e.g., rising error rates, disk failures)
Early warning signs of outages
3. Report Trends and Risks
Analysis results are presented through real-time dashboards and reports so teams can understand what’s happening without digging through raw metrics.
Effective reporting shows:
Network health at a glance
Traffic patterns over time
Device and interface performance
Service-level behavior such as uptime, response time, or error rates across locations or environments
In fact, more advanced dashboards allow teams to filter by application, website, device type, or service. This way, you can spot recurring issues and justify infrastructure changes with data instead of guesswork.
4. Alert Teams Before Users Feel the Impact
If metrics deviate from baselines or exceed critical thresholds, the monitoring system generates alerts and routes them to the integrated tools—it could be email, chat platforms like Slack, Microsoft Teams, or incident management systems such as PagerDuty or ServiceNow.
But what matters most is context. A helpful alert doesn’t only say “interface down.” It includes:
Which device or link is affected
How severe the deviation is
What applications or services may be impacted
This context allows engineers to prioritize issues correctly and resolve them before they escalate into outages.
5. Agentless Monitoring to Scale Visibility Without Operational Overhead
Rather than installing and maintaining software on every device, agentless network monitoring collects data using protocols and interfaces that devices or services already exposed, such as SNMP, ICMP (ping), flow data, and cloud provider APIs.
This reduces:
Deployment time
Ongoing maintenance effort
Risk of agent compatibility issues during OS patches, kernel upgrades, or application version changes
As a result, you get faster time-to-visibility and more time spent resolving issues instead of managing monitoring infrastructure.
6. Map Dependencies to Connect Network Behavior to Services
Dependency mapping correlates device metrics, traffic flows, topology data, alerts, and application components into a single service-level view to show how network components work together and deliver critical services. The monitoring system shows this through visual maps (topology maps, service dependency graphs, or application/service maps).
This way, when a link degrades or a device fails, teams can immediately see:
Which services are affected
Which users or business functions are at risk
Where to focus remediation efforts first
This service-oriented view helps teams stop cascading failures before they spread.
Key Network Monitoring Protocols and Data Sources
Network monitoring platforms use a combination of protocols and data sources to understand what’s happening within the network. Each protocol answers a specific operational question.
Some confirm whether a device is reachable, others show how it’s performing, and others explain how traffic is routed through the network.
Together, these protocols form the foundation of real-time visibility.
Simple Network Management Protocol (SNMP)
SNMP is the backbone of traditional and modern network monitoring. It allows monitoring platforms to poll network devices and infrastructure components for operational metrics.
Using SNMP, tools can collect data such as:
CPU and memory usage
Interface bandwidth and errors
Device uptime and availability
Hardware health indicators
Internet Control Message Protocol (ICMP)
ICMP test device reachability and network responsiveness by sending echo requests and reply messages, most commonly through ping-based checks.
Using ICMP, monitoring tools can infer:
Availability (is the device up or down?)
Latency (how long responses take)
Packet loss (whether traffic is being dropped)
While ICMP doesn’t provide deep performance metrics, it plays a critical role as an early warning signal for network health. If a device fails to respond to ICMP, it may indicate link failure, routing issues, firewall filtering, or complete device unavailability that requires immediate attention.
Flow protocols: NetFlow, sFlow, and IPFIX
Flow-based protocols focus on traffic behavior rather than device health.
They analyze:
Source and destination IPs and ports (who is communicating)
How much bandwidth is being used
Which applications or protocols are consuming network capacity
Your team can use this data to understand traffic patterns, identify congestion, and detect anomalies such as traffic spikes or unexpected data transfers.
Syslog
Syslog is a standard protocol for transmitting event or log messages from network devices, servers, and applications to a centralized log collector or SIEM. These messages can include:
Configuration changes
Authentication failures
Interface state changes
System warnings and errors
Unlike polling-based data, syslog provides context around why something changed, which makes it useful for root cause analysis and auditing.
Windows Management Instrumentation (WMI)
WMI is a Microsoft technology used in Windows environments to query detailed performance and operational data from Windows servers and endpoints. This includes:
SaaS platforms that don’t expose traditional network protocols (e.g., Salesforce, Microsoft 365)
They allow monitoring tools to pull performance, usage, and health data directly from providers like AWS, Azure, Google Cloud, and SaaS vendors without relying on agents or network-level access.
Secure Shell (SSH)
SSH provides secure remote access to devices and systems and is often used when standard protocols don’t expose the required data. Your monitoring platform may use SSH to:
Run remote scripts or shell commands
Collect custom or application-specific metrics
Perform health checks
Access logs on systems that don’t support SNMP or APIs
Note: SSH is particularly helpful for specialized devices or legacy systems where monitoring requires a more tailored approach.
Core Metrics for Effective Network Monitoring
Once data is collected through protocols like SNMP, flow data, or APIs, it’s processed into performance metrics. These metrics are how IT teams understand how well the network is performing and whether it can support the services running on top of it:
Latency: Measures how long a data packet takes to travel from the source to the destination.
Packet loss: Indicates the percentage of data packets that never reach their destination.
Jitter: Measures variability in latency over time.
Throughput: Represents the actual rate at which data is successfully transmitted across the network.
Error rates: Track transmission problems such as CRC errors, interface drops, and failed packets.
Availability: Confirms whether network devices, links, and communication paths are reachable and operational.
71% of organizations now use hybrid cloud environments, blending on-premises infrastructure with public cloud and SaaS services.
However, this introduces complexity in traffic routing, security, and performance management. Traffic doesn’t stay in one place—it moves between on-prem systems, cloud platforms, and SaaS services throughout the day.
Network monitoring helps teams follow that movement. By observing latency, packet loss, and path behavior across environments, they can see exactly where performance starts to degrade. This makes it possible to isolate whether an issue originates in the data center, within the cloud provider, or somewhere in between.
2. Proactive Performance Optimization and Bottleneck Detection
Most performance problems start as small inefficiencies that quietly grow.
By continuously tracking throughput, latency, and traffic patterns, network monitoring exposes early signs of congestion or saturation. This helps spot overloaded links, inefficient routes (e.g., asymmetric or long-haul routes), or unexpected usage trends so your teams can address them before users notice slowdowns.
3. Rapid Troubleshooting Across Distributed Environments
When networks span on-prem data centers, cloud environments, and edge locations, alerts alone rarely provide the context needed for root cause analysis. That’s where flow data and dependency-aware monitoring allow teams to trace traffic paths end to end and understand how different parts of the network interact.
This way, instead of chasing symptoms across multiple systems, engineers can pinpoint the exact point of failure and resolve issues faster.
4. Data Center Environmental Monitoring
Sometimes the root cause of a network issue isn’t the network at all. To handle such situations, IT teams correlate environmental data such as temperature, humidity, and power usage with network and infrastructure metrics.
This provides early warning when physical conditions threaten system stability, and it prevents hardware failures and service disruptions in high-density data center environments.
1 in 4 organizations report difficulty detecting suspicious network behavior and identifying attacks in progress, even with security monitoring in place.
Attack techniques are evolving faster than traditional monitoring models, which increases the burden on teams to distinguish malicious behavior from normal traffic patterns.
Rising traffic volumes and encrypted traffic make it harder to detect anomalies, investigate incidents, and maintain consistent visibility
Using multiple disconnected point tools for network monitoring increases operational overhead without improving insights or response times.
How Organizations Are Responding to Growing Network Complexity
To keep up with rising network monitoring challenges, many organizations are shifting away from manual, reactive network operations.
Instead, they’re adopting more automated approaches to monitoring and management.
This reflects a broader move toward solutions that can detect issues, correlate signals, and surface insights without constant human intervention.
Monitor Smarter and Act Faster with LogicMonitor
Modern networks don’t wait, and neither should your monitoring. LM Envision gives you unified observability across your entire infrastructure, from cloud to data center to edge, with AI capabilities that surface the critical signals.
Looking to reduce incidents, simplify your stack, and connect IT performance to business outcomes with real-time insights? Start monitoring your network with LogicMonitor.
Explore more in our network monitoring series to dive deeper into key concepts and best practices including:
1. How do I know if my current network monitoring setup is outdated?
If your tools can’t handle cloud workloads, container environments, or real-time alerting, it’s time to upgrade. Look for signs like blind spots, slow incident detection, and poor integration with modern platforms.
2. What’s the difference between traditional network monitoring and observability?
Monitoring shows you what’s wrong; observability helps you understand why. Observability goes deeper by combining metrics, logs, and traces for root cause analysis, especially useful in dynamic or distributed systems.
3. I’m using hybrid infrastructure. Do I need multiple monitoring tools for each environment?
Not necessarily. Many modern platforms offer unified monitoring across cloud and on-prem systems, reducing complexity and providing full visibility from one interface.
4. How do I reduce false alerts without missing critical issues?
Use dynamic thresholds, dependency mapping, and historical baselines. These help you prioritize real problems and minimize alert fatigue from non-urgent notifications.
5. What kind of data do monitoring tools collect, and is it secure?
They collect metrics like bandwidth, CPU usage, packet loss, and traffic flows. Modern tools encrypt this data and offer access controls to ensure security and compliance.
6. Is network monitoring only for large enterprises?
No. Small and mid-sized businesses also benefit from visibility, performance optimization, and security, especially with SaaS-based tools that scale without large initial costs.
By Dennis Milholm
Sales Engineer, LogicMonitor
Subject matter expert in IT and Managed Services with 20+ years of experience across NOC operations, product management, and service delivery.
Disclaimer: The views expressed on this blog are those of the author and do not necessarily reflect the views of LogicMonitor or its affiliates.