
by Beth Winters, Senior Product Marketing Manager
Enterprise hybrid IT environments are complex beasts, plagued by blind spots, siloed data, and slow incident resolution. Enterprise organizations need a comprehensive solution that provides hybrid observability within a single pane of glass to reduce MTTR/MTTI, eliminate those blind spots, correlate insights across their entire IT infrastructure, and achieve more granular control.
LogicMonitor goes beyond basic monitoring to deliver exactly that. LogicMonitor’s LM Envision platform delivers AI-powered insights that help IT teams accelerate troubleshooting, improve efficiency, and take a more proactive approach to monitoring.
Our latest innovations further extend this vision:
- Log Analysis: Empower your team with AI-guided insights for faster incident resolution.
- SNMP Traps as Logs: Extend hybrid visibility into legacy network technology to streamline troubleshooting.
- Role-based access control (RBAC) for Modules, Security Settings, and Recommendations: Enhance control and reduce administrative burden.
With LM Envision, you’re not just reacting to problems; you’re preventing them.
Let’s dive deeper into how these innovations are transforming IT operations.
Key takeaways
Log Analysis: AI-powered troubleshooting for Level 1 support
Log data is a goldmine of insights, but without AI it is nearly impossible to mine all that data and find the insightful gold nuggets. Our new Log Analysis feature harnesses the power of natural language processing (NLP) and other machine learning (ML) techniques to create meaning from the vast troves of unstructured data that can be ingested into LM Logs, and expedite troubleshooting across the entire IT stack by surfacing and sorting problematic logs in a simple visual interface.
Log Analysis automatically sorts through thousands of logs and leverages AI to plot error codes, negative phrases, or keywords and extract numeric values from text. In the past, engineers had to manually create queries in a search bar with advanced parsing or regex capabilities. Log Analysis automates this previously manual and time-consuming process for users of all skill levels.
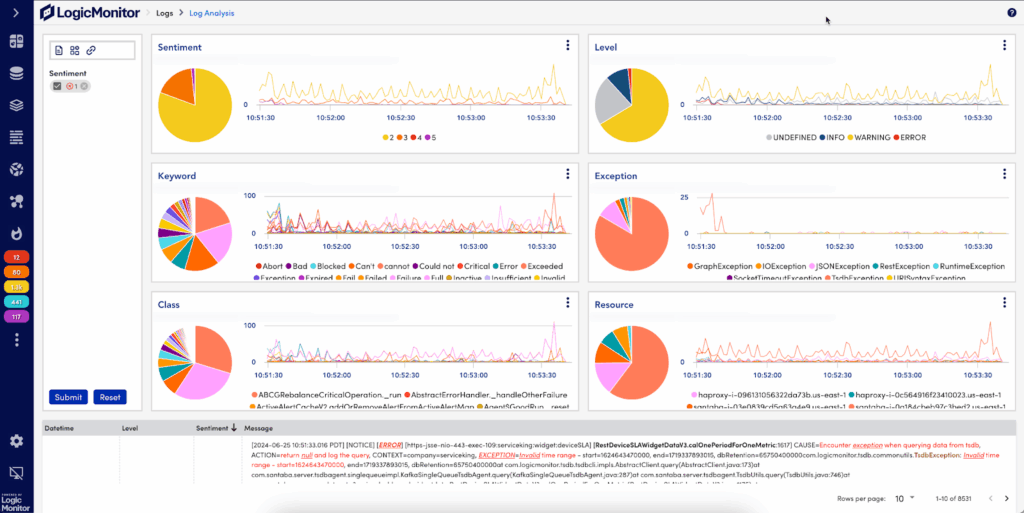
Log Analysis uses visual diagrams to quickly surface problematic logs.
Within Log Analysis, logs are now grouped into intuitive visual diagrams based on Sentiment, Level, Keyword, Exception, Class, and Resource. The Sentiment diagram allows you to view logs weighted by severity level on a scale of 1 to 5 (with 5 being the most critical) to help you prioritize and troubleshoot faster. The Keyword diagram groups logs by negative phrases like “error,” “failed,” or “critical” in a single view to help customers quickly identify issues and facilitate faster root cause analysis (RCA).
The intuitive visual interface allows for easy customization of specific log phrases and associated severity, so you can incorporate your own policies, dimensions, or user-defined keywords to tailor the groupings and sentiment scores for your specific environment.
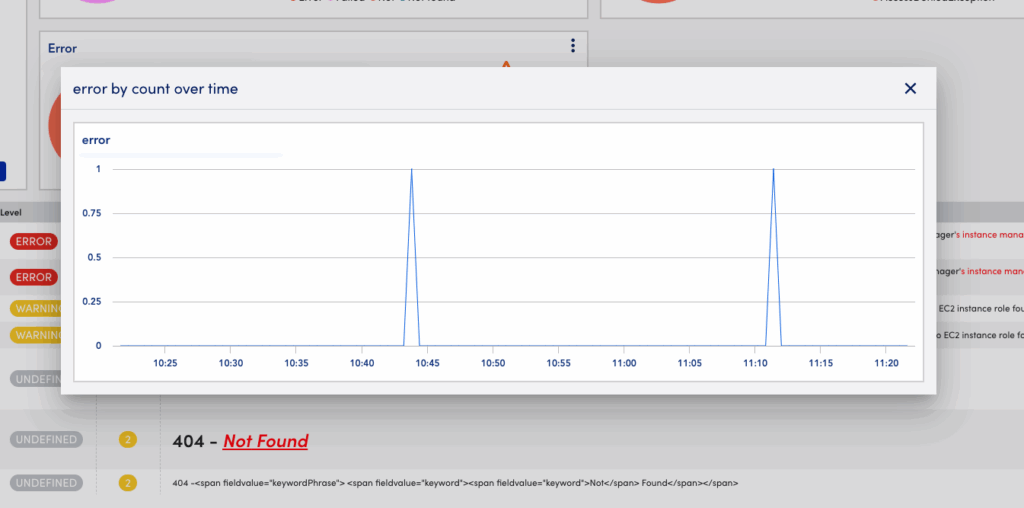
Navigate seamlessly to Log Analysis from the Logs, Alerts, or Resource Explorer pages within LM Envision, and effortlessly exclude a term, drill down for details, and view log summaries with timestamps and frequency—all just a few clicks away. Log Analysis also works hand-in-hand with Log Anomaly Detection. Once an alert triggers, simply launch a Log Analysis session – without leaving the alert info screen or writing a complex log query – to pinpoint the problematic logs and identify the negative keywords and errors that contributed to the alert. Log Analysis will then apply machine learning and layered intelligence to scan the logs associated with the alert and serve up the most problematic logs in a simple visual diagram.
Key benefits:
- Empower Level 1 support: Enable less experienced team members to quickly identify and resolve issues with AI-guided troubleshooting, democratizing log insights.
- Accelerate root cause analysis: Pinpoint the source of problems faster with automatic log categorization, severity scoring, and the extraction of numeric values from text.
- Reduce Mean Time to Repair (MTTR): Get systems back up and running faster with actionable insights at your fingertips, presented in visual diagrams and summaries.
- Optimize efficiency: Free up your senior engineers for more strategic work by automating routine log analysis, improving Enterprise efficiency, and lowering administrative costs.
To learn more about Log Analysis, watch a quick demo video.
Please note that users must toggle on the latest UI to take advantage of this feature.
Putting our own features to the test
At LogicMonitor, we leverage our own products to monitor our infrastructure, applications, and services. So it comes as no surprise that LogicMonitor engineers have been using Log Analysis as part of LogicMonitor’s use and test approach, which allows us to stress test new releases with internal and external early adopters. Internal users have amazing things to say about this new feature. Nick Johnson, Senior Software Engineer, is “loving the tool so far” and has “been using it extensively for Cloud Recommendations.” He is especially excited about the negative phrases panel, which he says “has been huge in seeing where we’re over-logging, double-logging, and finding commonalities.” William Shipman, Site Reliability Engineer, stated that “the ability to extract numeric values from logs is one of the coolest things I’ve seen yet. I really like the negative phrase analysis, but the ability to plot counts over time and extract numeric values from text is game-changing.”
SNMP Traps as Logs: Unlocking comprehensive Network Monitoring
We knew the 90s were making a comeback from fashion to TV with “That 90’s Show” – but SNMP traps? They never went away. That’s because SNMP traps are still an essential part of Network Monitoring, and the market for network devices continues to grow. Traps measure network performance and health while providing timely information about important events across the vast network devices that keep your organization running.
In the past, NetOps managers and administrators have viewed SNMP monitoring as a necessary evil, requiring specialized (and often outdated) on-premises software that generates more alerts than the engineers could act upon. LogicMonitor has brought SNMP traps into the modern age by transforming them into Logs. This eliminates monitoring gaps and unlocks instant insights into Network issues in a user-friendly interface. Now, you can easily integrate traps into your overall Network Monitoring strategy in a single SaaS platform to immediately identify and troubleshoot network latency, hardware health, packet loss, or interface flapping issues.
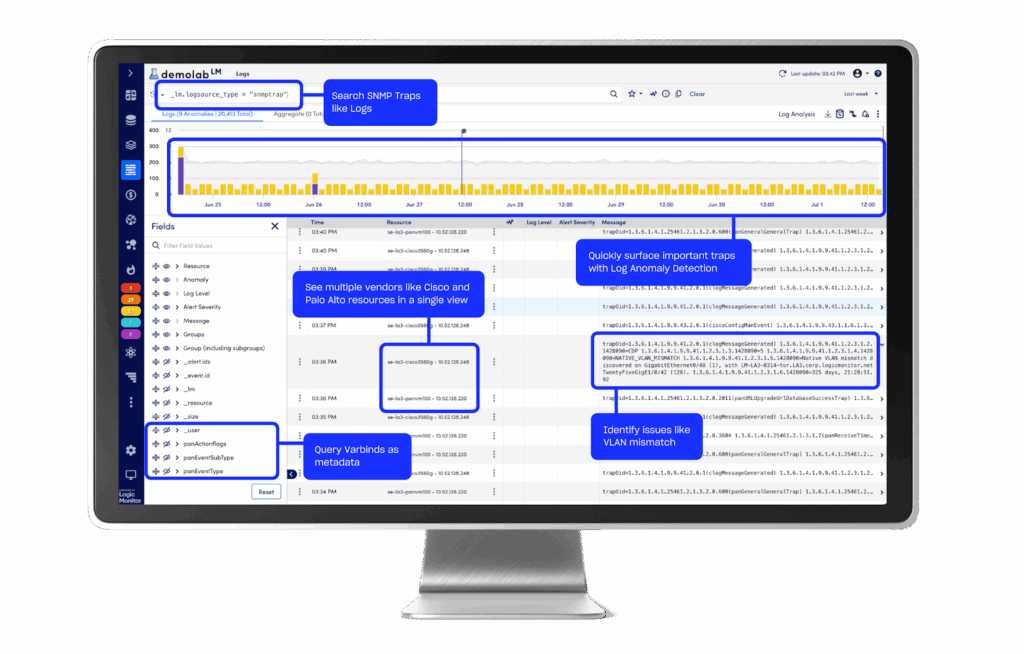
Search traps, create queries, identify anomalies, and more with SNMP Traps as Logs.
SNMP Traps as Logs are easily ingested via the LM Collector with no configuration required. With LogicMonitor’s flexible retention policies, there’s no need to maintain storage hardware for traps.
Key benefits:
- Centralized monitoring to reduce tool sprawl and data silos: Replace your old Enterprise trap management system and centralize your network monitoring approach in LogicMonitor. View SNMP traps alongside logs, metrics, and traces in real time, all in a single platform.
- Rich context for fast, proactive troubleshooting: Leverage logging features like Log Anomaly Detection, Log Analysis, queries, filters, data retention, and more for quicker incident resolution. Search historical traps and identify trends to remediate, predict, or prevent future issues. Edwin AI, LogicMonitor’s new generative AI product, can ingest logs and correlate related issues into a single ITSM ticket with a simple summary and recommendations that fast-track RCA.
- Reduced alert fatigue: With stateful alarm clearing, SNMP Traps as Logs will automatically close alerts when a related “clear” trap comes in, eliminating noisy alerts while retaining a record of duplicate alerts.
- 3,000+ seamless integrations: LogicMonitor’s LM Envision platform integrates seamlessly with SNMP Traps (v1, v2, and v3), standard encryption methods, your existing Network Devices, and incident resolution workflows through ServiceNow, Jira, PagerDuty, Slack, and more. For more information, check out our Integrations page.
- Parse and map OIDs and VarBinds: LogicMonitor pulls in critical information from SNMP Trap OIDs and variable bind values and translates them into user-readable values out of the box. LM Envision supports vendor-proprietary log formats as well as Syslog, providing a holistic log solution for Network Operations and Engineering teams.
- Custom MIB support: Users can upload their own proprietary or custom MIB files within the LM Envision platform, extending translation and visibility into any other product that sends SNMP Traps.
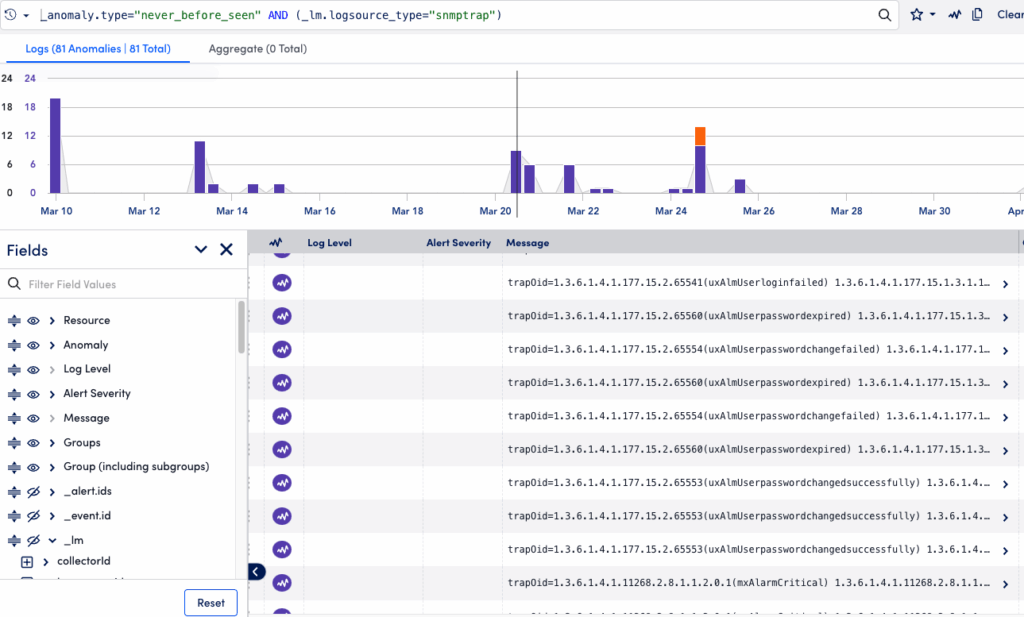
SNMP Traps as Logs leverages powerful log features like Anomaly Detection to quickly troubleshoot network issues.
SNMP Trap monitoring is a must-have for enterprises. Treating Traps will unlock much more value for our customers through existing log features. Simply send the traps through the LM Envision—no configuration needed—and let LogicMonitor do the heavy lifting for you to surface actionable insights and important alerts like equipment vendor certification changes, notification failures, or repeated login failures.
Watch our short demo video or visit the documentation site for more information about SNMP Traps as Logs.
RBAC for LogicModules: Granular role-based access controls to minimize risk
Large complex organizations like enterprises and MSPs have greater RBAC and security needs. With RBAC for LogicModules, these organizations can now set more granular permissions, ensuring that the right team members have the appropriate access level to view or edit specific LogicModules and the underlying data.
This enhanced granularity strikes an ideal balance between minimizing monitoring and outage risks while giving teams the control to monitor the correct data to maximize performance and visibility. Using the module editor, administrators can assign Access Groups to modules directly within the LM Envision platform. After assigning Access Groups, you can filter and view modules by these groups in ‘My Module Toolbox’.
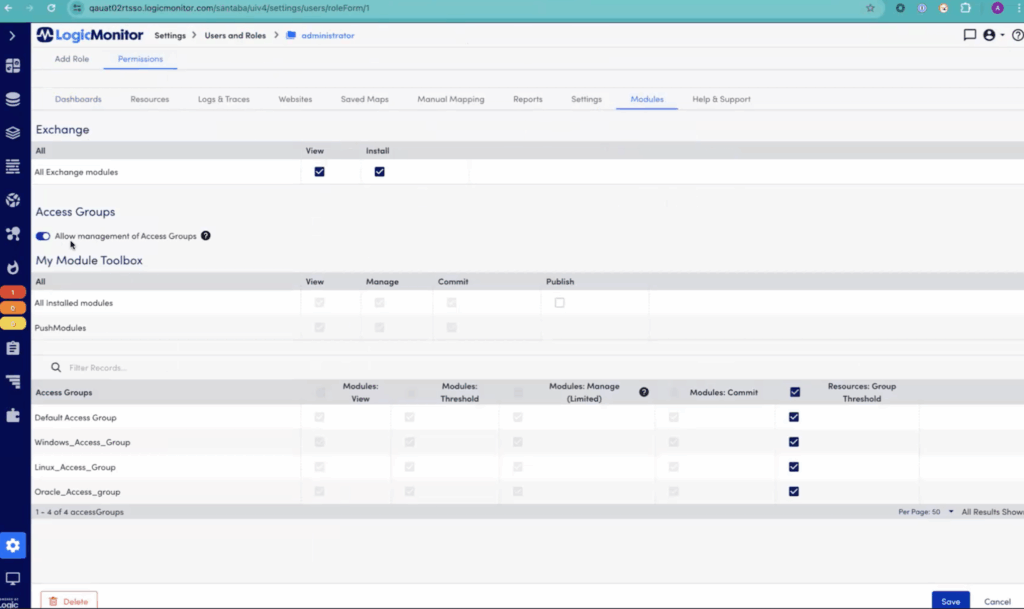
RBAC for LogicModules extends the principle of least privilege to Modules.
The flexibility of Access Groups allows you to tailor permissions to your organization’s structure. You might give a user the ability to update alert thresholds for resource groups, or create “view only” permissions for specific modules. You can also create groups to ensure that:
- The database team can only edit modules related to database monitoring.
- The server team can only edit modules related to server monitoring
- And so on…
This targeted approach prevents teams from accidentally interfering with each other’s monitoring configurations, ensuring comprehensive coverage and reducing the risks of gaps in visibility.
For more information, visit the documentation site.
Security Settings and Recommendations: Protecting your portal with better security visibility and control
We are excited to announce Security Settings and Security Recommendations to help our customers get the most value from LogicMonitor and stay current with security best practices.
Security Settings is your new launchpad for managing security and RBAC within LogicMonitor. This centralized page simplifies the process of reviewing and modifying your environment’s security configuration, providing those with Security permissions with granular control and enhanced visibility over their portal security configuration.
Within Security Settings, you’ll also find Security Recommendations, a proactive tool displaying recommended actions to protect your portal better.
These recommendations can include suggested actions like enabling two-factor authentication (2FA), which adds an extra layer of security by requiring users to verify their identity through a third-party application or an authentication token delivered using SMS, voice, or email. You can apply 2FA globally for all portal users or on a per-user basis.
Important Note: If you’re using Single Sign-On (SSO), 2FA behavior depends on your SSO configuration.
- If SSO is not set to “Restrict Single Sign-On,” users can choose between SSO or 2FA for login.
- If SSO is set to strict access, users can only log in using SSO.
- To enable 2FA with SSO, you must configure it through your SSO provider.
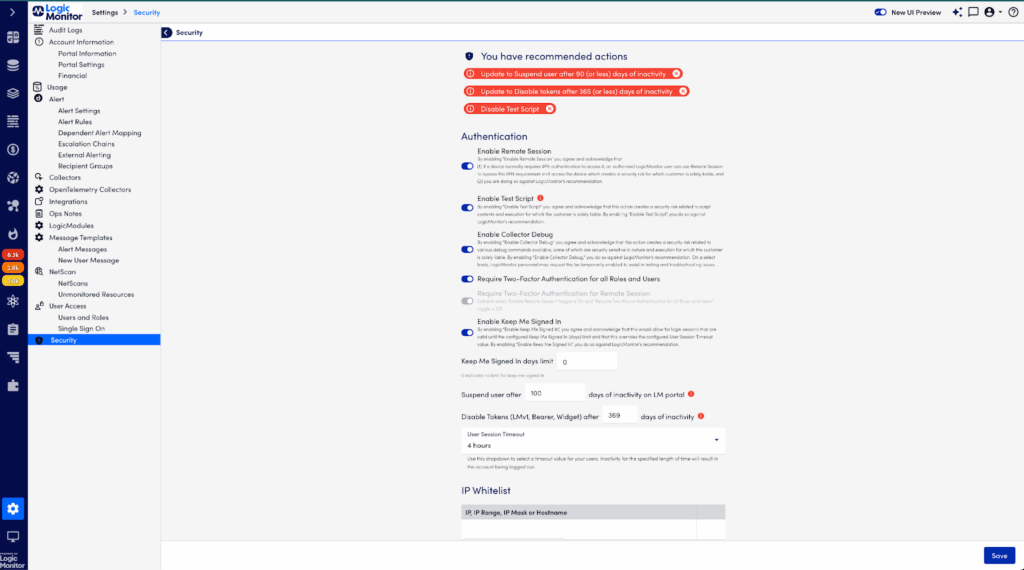
Security Recommendations gives you recommended actions that enhance the security posture of your LogicMonitor portal.
Other recommendations may include:
- Suspending inactive users after a specified period.
- Turning off inactive tokens after a specified period.
- Configuring an email domain allowlist.
By following these recommendations, you can proactively strengthen your LogicMonitor portal’s security and protect your valuable data.
For more in-depth guidance on securing your LogicMonitor portal, refer to LogicMonitor Best Practices or visit the Security Settings documentation site.
Fostering continuous innovation
With the latest enhancements to the LM Envision platform, LogicMonitor is committed to making it easier for customers to identify and troubleshoot issues quickly, monitor their network infrastructure, and ensure the security of their data. We are excited to see how our customers use these new features to improve their operations and achieve their business goals. Stay tuned for more exciting updates as we continue to innovate and provide our customers with the tools and resources they need to succeed.
If you’re a current customer and need help enabling a new feature, please reach out to your Customer Service Representative or engage directly with the product team in the LogicMonitor Community! If you’re new to LogicMonitor, take the next step on your journey toward Hybrid Observability powered by AI today by watching a quick overview of the platform and requesting a free trial.


