In this article


Imagine discovering that 40% of your cloud infrastructure went unmonitored for a week because monitoring agents failed to deploy during an auto-scaling event. This scenario isn’t just hypothetical—it’s a growing reality for organizations relying on traditional agent-based monitoring in dynamic cloud environments.
Virtual machines (VMs) power mission-critical applications and services across enterprises, so keeping them running smoothly is critical. Monitoring provides the visibility needed to maintain performance, troubleshoot issues, and deliver a seamless user experience. Yet, traditional agent-based monitoring solutions often struggle to keep pace with the dynamic nature of the cloud. This creates monitoring gaps, adds complexity, and consumes resources while potentially impacting VM performance.
In this article, we’ll look at the challenges of agent-based monitoring and present a better alternative approach: agentless monitoring. In a follow-up article, we’ll discuss how agentless monitoring addresses many issues introduced here.
Agent-based monitoring and its issues
Traditional agent-based monitoring involves installing software agents on each machine or application you want to monitor. These agents collect data locally and send it back to a central monitoring system for analysis.
While this method offers benefits, such as real-time monitoring and granular insights, it also poses significant challenges, particularly in highly dynamic cloud environments.
Current agent-based monitoring approaches
Before we discuss the issues with agent-based monitoring, let’s quickly review the most common approaches. Depending on your specific monitoring needs or the solution used, agent-based monitoring can be categorized into the following types: system performance monitoring, application performance monitoring, security monitoring, log monitoring, and database monitoring.
System performance monitoring
System performance monitoring, also called infrastructure monitoring, involves deploying an agent on system resources (e.g., a server, workstation, or network device) to track both traditional metrics and modern cloud metrics. The agent collects data at regular intervals by querying system APIs or accessing performance counters provided by the host operating system. It then sends the collected data to a central monitoring system or dashboard for analysis and visualization.
| Examples of system performance metrics | |
| Traditional metrics | Cloud-native metrics |
| • System uptime • CPU usage • RAM utilization • Disk I/O • Network traffic | • Container health states • Cloud service quota usage • Infrastructure-as-code deployments |
While this provides vital infrastructure insights, it introduces significant operational overhead. Agents require constant updates during scaling events and can face compatibility issues across different operating systems, risking monitoring gaps.
Application performance monitoring
Application performance monitoring tracks software application health, availability, and performance through agents embedded within applications or runtime environments (e.g., Java, .NET). These agents capture key performance indicators.
| Examples of application performance metrics | |
| Response metrics | Dependency tracking |
| • Response times for user requests • Error rates across services • Transaction throughput • Latency between components • Database query response times | • Service dependencies • External API response times • Database connection health • Cache performance • Message queue latencies |
Advanced agents may instrument code or perform distributed tracing to follow requests across multiple services. This helps ensure smooth application operation, diagnose performance issues (like slow endpoints), and optimize user experiences.
The challenge lies in integration complexity. Integrating agents, especially in legacy systems, can require significant configuration and expertise. Adding to this complexity, some tools may not support all application environments or frameworks, leading to gaps in monitoring or the need for multiple tools across an organization. For instance, AppDynamics fully supports Java, PHP, .NET, Node.js, Python, and C++ but does not support Rust, Elixir, or Dart applications, which often forces organizations to maintain multiple monitoring solutions for complete coverage.
Security monitoring
Agents are deployed to observe system activities and potential security events in real time. They may integrate with security information and event management (SIEM) systems to provide a holistic view of security events like unauthorized access detection, compliance monitoring, real-time threat response, malware identification, and intrusion attempt alerts, to name a few.
| Core monitoring capabilities | Threat detection methods |
| • File integrity monitoring • Access log analysis • Network traffic patterns • User activity tracking • System configuration changes | • Anomaly detection algorithms • Signature-based scanning • Behavioral analysis • Real-time threat intelligence • Compliance rule checking |
A key limitation emerges in the implementation. These agents typically require privileged access (often root/admin permissions) to function correctly, creating potential security vulnerabilities if compromised. The complexity compounds in multi-cloud setups where where organizations must ensure consistent security policies while managing an expanded attack surface across diverse platforms. Legacy or unsupported operating systems present additional challenges, as these agents may fail to provide comprehensive vulnerability coverage.
Log monitoring
Log monitoring involves collecting and analyzing log files generated across your IT environment. Monitoring agents installed on systems aggregate logs from multiple sources and forward them to a central platform for processing.
| Log source types | Agent capabilities | Central platform features |
| • Application logs • System logs • Security audit trails • Network device logs • Database transaction logs | • Real-time log collection • Pattern recognition • Anomaly detection • Alert triggering • Log forwarding | • Log indexing • Search functionality • Data visualization • Alert management • Retention policies |
The practical challenges become apparent at scale. Logs can grow exponentially, demanding significant storage resources and making it difficult to scale for large and distributed cloud infrastructure. Additionally, establishing effective log parsing, filters, and alert rules requires substantial time investment and deep domain expertise
Database monitoring
Database monitoring focuses on tracking the performance, availability, and integrity of database systems. Agents interact with database management systems (DBMS) to collect metrics like critical performance metrics and operational indicators.
| Examples of critical performance metrics and operational indicators for database monitoring | ||
| Performance metrics | Operational indicators | System health checks |
| • Query execution times • Active session counts • Connection pool usage • Storage capacity trends • Memory utilization | • Slow query tracking • Deadlock detection • Buffer pool efficiency • Transaction throughput • Table space growth | • Backup status • Replication lag • Index fragmentation • Cache hit ratios • Resource bottlenecks |
The trade-offs become evident in production environments. Database monitoring agents can consume valuable database resources, potentially impacting performance during peak usage. Scale presents another challenge-monitoring large-scale or distributed databases, particularly in multi-node clusters or cloud-native environments, can put considerable strain on infrastructure.
Why agent-based monitoring struggles in dynamic cloud environments
While the agent-based approach works in smaller, static environments, it becomes problematic in dynamic cloud environments.
Here’s how these challenges manifest in real-world scenarios:
| Deployment and maintenance | Scaling challenges | Performance impact |
| • Complex agent installation processes • Time-consuming configuration requirements • Constant update management • Version control across environments • Resource-intensive maintenance | • Manual intervention during auto-scaling • Delayed agent deployment • Incomplete coverage during rapid scaling • Resource discovery complications • Configuration drift | • Cumulative resource overhead • Increased cloud compute costs • Higher memory utilization • Additional network traffic • Potential service degradation |
According to Orca Security, traditional agent-based security solutions usually fail to cover more than 50% of cloud assets due to the difficulties in deploying agents across rapidly changing environments. The same challenges apply to monitoring agents.
Operational bottlenecks
- 30-60 second agent installation times
- Container lifecycles shorter than deployment times
- Version management across distributed systems
- Update coordination across teams
- Resource allocation conflicts
Organizations often face a death-by-agent scenario, particularly in microservices architectures where containers spin up and down within seconds. When agent installation takes longer than a container’s lifecycle, effective monitoring becomes impossible.
The solution for virtual machines in cloud environments: Agentless monitoring
Agentless monitoring takes a fresh approach to observability by eliminating the need to install and manage software agents on each monitored device. Instead, it taps into existing communication protocols and APIs to gather performance data from VMs and applications. This streamlined approach reduces the overhead of traditional agent-based methods, making it especially effective for dynamic cloud environments.
Think of it like this: instead of sending an envoy (agent) to each VM to gather information, agentless monitoring uses the VM’s existing communication channels to retrieve the data it needs. This eliminates the need for the envoys (agents) and significantly reduces the management complexity of those envoys. It also reduces the security risks associated with deploying and managing agents, as there’s no need to open additional ports or grant elevated privileges.
Here’s a simplified diagram illustrating how agentless monitoring works:
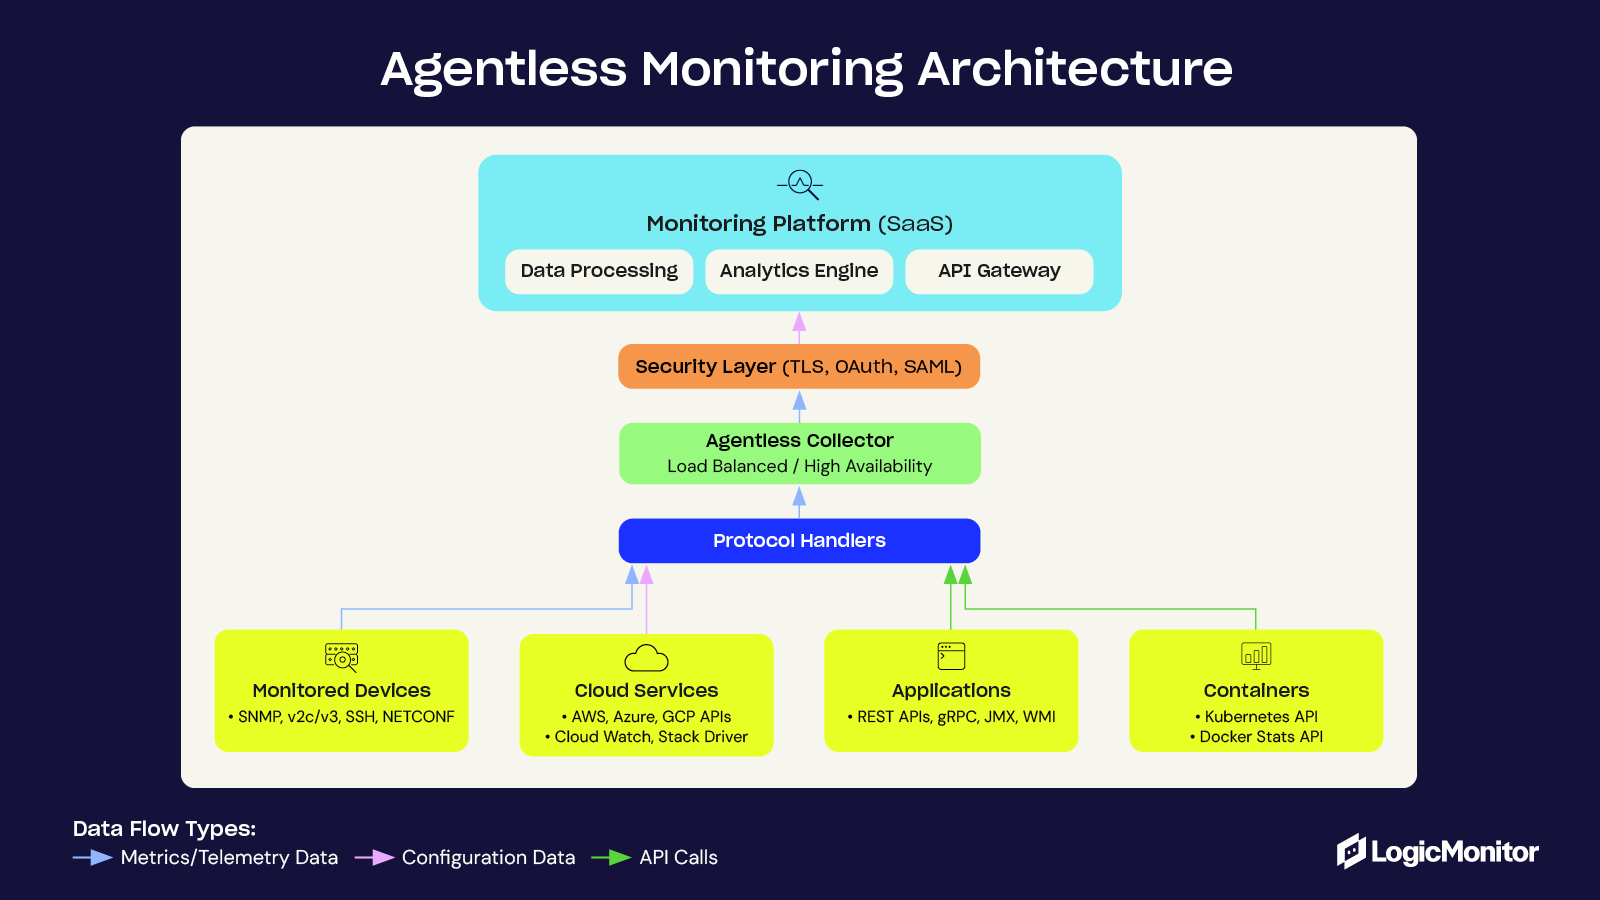
The monitoring system collector communicates directly with the VM or application using both standard protocols like Simple Network Management Protocol (SNMP), Internet Control Message Protocol (ICMP), and modern approaches like cloud-native APIs, service meshes (such as Istio), and remote procedure call (gRPC). This enables comprehensive observability without additional overhead. The VM responds with the requested data, which is then processed and visualized by the monitoring system’s dashboards, providing real-time insights into the health and performance of your infrastructure.
Platforms that use the agentless approach, like LogicMonitor Envision, employ various techniques to gather data. Some of these include the following:
- API integration: Modern cloud platforms and applications expose APIs that allow secure data retrieval. Agentless monitoring tools collect performance metrics and other relevant information using these APIs.
- Standard protocols: Protocols like SNMP and Windows Management Instrumentation (WMI) are commonly used to gather information from network devices and Windows servers.
- Secure Shell: Secure Shell (SSH) can be used to execute commands remotely on devices and collect output for analysis. This means monitoring systems can connect to target devices (servers, network devices, etc.) and execute commands that gather system information for various metrics, such as CPU usage, memory consumption, disk space, network statistics, and running processes.
The future of cloud VM management starts now
Organizations typically see ROI from agentless monitoring within three to six months through reduced maintenance overhead and improved coverage. This makes it not just a technical upgrade but a strategic business decision.
Agentless monitoring is the future of cloud VM management. It offers seamless scalability for modern, dynamic, cloud-based infrastructure. With minimal maintenance and a simplified approach to monitoring diverse systems, it’s an efficient and forward-thinking solution.
If you want to learn more about agentless monitoring and how it’s the more innovative way to manage cloud VMs, check out this article.


Subscribe to our blog
Get articles like this delivered straight to your inbox