
In this article


If you’ve ever compared VM CPU metrics from inside a Windows guest and those reported by vCenter, you’ve probably noticed something strange… they don’t match. One says you’re running hot, the other barely breaks a sweat.
This isn’t just a harmless quirk. Misreading VM resource utilization can trigger false alerts, lead to overprovisioning, or send you chasing performance issues that don’t actually exist. It’s a common pain point for engineers monitoring virtual environments, especially when trying to get a clear view of what’s really going on under the hood.
In this article, we’ll unpack why these metrics differ, what each is actually measuring, and when to trust one over the other. You’ll walk away with a more accurate way to assess VM performance and fewer monitoring headaches.
TL;DR

How CPU Utilization Is Measured: Windows vs. vCenter
At first glance, it might seem like either Windows or vCenter must be wrong when their CPU usage numbers don’t line up. But in reality, both are telling the truth, just from completely different perspectives.
What Windows Is Measuring (Inside the Guest)
When you query CPU usage from within the Windows guestOS using Task Manager, Perfmon, or WMI, you’re getting an internal view. Windows only sees the resources it thinks it has. If it’s assigned four vCPUs, that’s its reality. It doesn’t know whether those vCPUs are truly available or being throttled, shared, or delayed by the hypervisor.
In other words, Windows measures how busy it wants to be (how much work it’s trying to do), not how much physical CPU time it’s actually getting.
What vCenter Is Measuring (From the Hypervisor)
vCenter, on the other hand, has the bird’s-eye view. It tracks how much actual physical CPU time the VM is consuming on the host. That includes the impact of resource contention, CPU scheduling delays, and overhead from other guests.
So when vCenter reports lower CPU usage than Windows, it’s often because the VM wanted more CPU time, but didn’t get it. And when it shows higher usage, it may be capturing background host processes or overhead the guest isn’t aware of.
Windows sees what the VM wants to do. vCenter sees what it actually did.
Summary: Two Valid Views, Two Different Stories
| Measurement Layer | What It Sees | What It Misses | Typical Use Case |
| Windows Guest OS | Internal process execution and load | Host-level contention, scheduling delays | App-level performance monitoring |
| vCenter/ESXi Host | Actual CPU time consumed on the host | Whether the VM wanted more than it got | Host-level capacity and resource planning |
Understanding these differences is key to making sense of your VM resource utilization data. In the next section, we’ll walk through a real-world example that highlights how these views can diverge, and what to do about it.
Side-by-Side Comparison Table: What Each Metric Tells You
So which metric should you trust, Windows or vCenter? The short answer is: it depends on what you’re trying to learn.
Both metrics are technically accurate, but they’re reporting from different layers of the virtualization stack. One reflects what the VM thinks is happening. The other shows what’s actually happening at the host level.
Here’s a side-by-side breakdown to help make sense of the difference:
| Aspect | Windows Guest Metric | vCenter/ESXi Metric |
| Data Source | WMI / Perfmon | Hypervisor scheduler |
| Awareness of VM scheduling? | ❌ Not aware | ✅ Fully aware |
| Ideal for | App-level performance monitoring | Host resource planning |
| Common Misread | Understates contention | Overstates demand |
This contrast is exactly why VM resource utilization can appear so different depending on where you’re looking from. In the next section, we’ll walk through a real-world example where the discrepancy plays out, and show how to read between the lines.
Real-World Example: One VM, Two Stories
Let’s walk through a real scenario that shows just how different Windows and vCenter metrics can be when a VM is under load.
Setup: What We Ran and Why It Matters
We ran a load test using HyperPi on a Windows VM provisioned with 4 vCPUs. The test was configured to max out 3 of those vCPUs simultaneously.
From Windows’ point of view, the system was working hard and making use of what it had. But that wasn’t the full picture.
What Windows Reported (Inside the Guest OS)
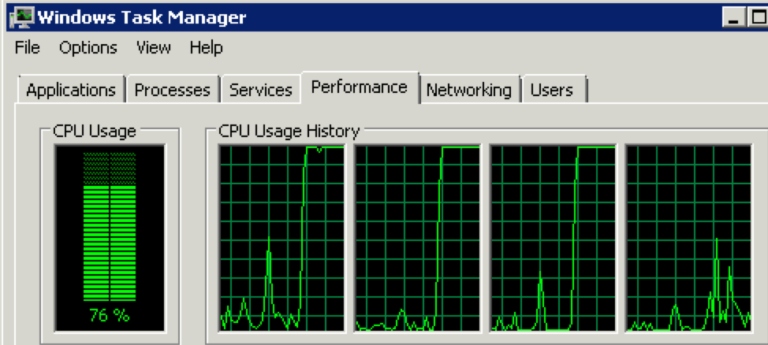
From inside the VM, Windows Task Manager showed CPU usage climbing to about 76%, reflecting full utilization of 3 out of 4 vCPUs.
Caption: Inside the VM: Windows reports 76% CPU usage as HyperPi pushes 3 of 4 vCPUs to their limit.
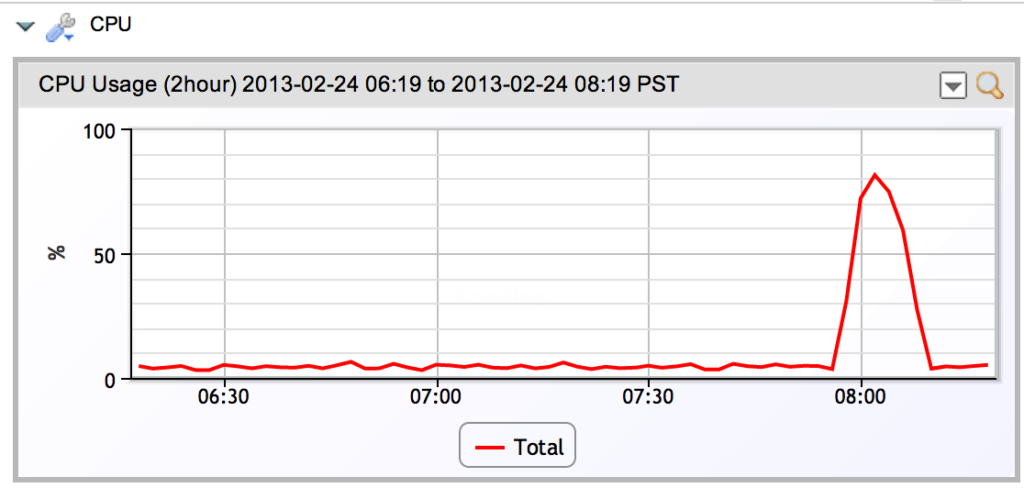
Caption: Windows guest CPU (via WMI): a clear spike to 75%+ during the load test.
What vCenter Reported (From the Hypervisor View)
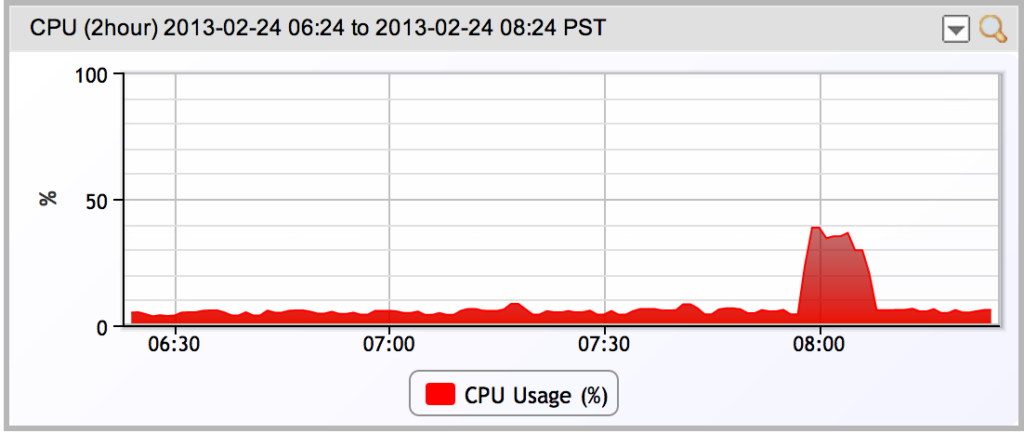
At the same time, the vCenter view told a different story. It showed CPU usage peaking at around 50%, far lower than what Windows saw.
Caption: vCenter’s perspective: The VM wasn’t actually getting all the CPU time it requested. Only about half.
Why? Because the hypervisor was juggling workloads from multiple VMs. So while Windows thought it had CPU access, in reality, some of that time was spent waiting.
What Happened to the Other VMs?
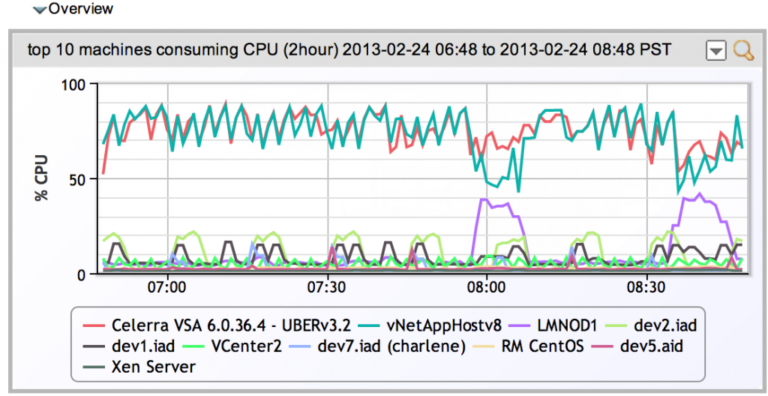
When our test VM (LMNOD1) demanded more CPU, it pulled resources from others on the same host.
Caption: When LMNOD1 ramps up, other VMs show a visible dip. Evidence of resource contention across the host.
This proves the hypervisor was reallocating CPU time dynamically. Windows couldn’t see this. It just assumed it had what it was promised.
CPU Ready Time: The Hidden Truth
To really understand what was happening, we looked at CPU Ready Time, a metric that shows how often the VM wanted CPU but had to wait because nothing was available.
Caption: The missing link: CPU Ready time spikes to nearly 100%, confirming the VM was stuck in line for CPU access.
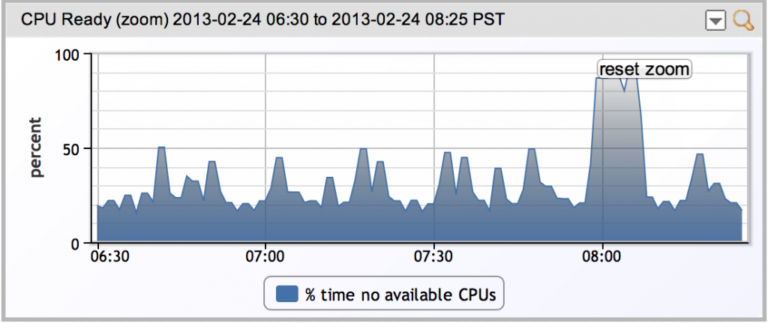
This metric fills in the gaps between the guest’s expectations and the host’s reality. When CPU Ready time is high, it means the VM is starved, even if Windows reports high usage.
Both metrics were technically accurate, but they told very different stories. The key is understanding the context each one represents, and using supporting metrics like CPU Ready to piece together the full picture.
When to Trust Which Metric (And When You Need Both)
So now that we’ve seen how Windows and vCenter can disagree, the natural next question is: which one should you rely on?
The short answer is: it depends on what you’re trying to troubleshoot.
Each view serves a purpose. If you only focus on one, you might miss the bigger picture (or waste time chasing a problem that doesn’t exist).
Here’s a quick breakdown to guide your decision:
| Use Case | Trust Windows Metric | Trust vCenter Metric | Use Both |
| App performance bottlenecks | ✅ Shows what the app is experiencing inside the guest | ❌ Can mislead. VM may look “idle” when app is actually blocked | Use vCenter to confirm host isn’t throttling resources |
| Host-level capacity planning | ❌ Can’t see other VMs or total host usage | ✅ Best for understanding real physical CPU consumption across VMs | Use guest metrics to understand how critical the VM’s demand really is |
| Investigating resource contention | ❌ Blind to what other VMs are doing | ✅ Highlights contention through CPU Ready or Co-Stop | Compare with guest view to confirm if perceived slowness is real or host-induced |
| Debugging short spikes or crashes | ✅ Shows what the VM was doing at the moment of impact | ❌ Might miss quick bursts or misattribute them | Combine timelines to reconstruct events |
| Alert tuning in monitoring tools | ✅ For process-specific alerts (high CPU process, service failures) | ✅ For infrastructure alerts (oversubscription, resource limits) | Helps reduce false positives by cross-checking against both sources |
TL;DR: Use Context, Not Just Numbers
- Use Windows metrics to understand the experience inside the VM
- Use vCenter metrics to understand actual CPU resource usage
- Use both together to avoid blind spots and get a complete view of your VM resource utilization story
Context Is Everything in VM Monitoring
No single metric tells the full story of VM performance. You need context.
When it comes to VM resource utilization, no single metric tells the whole story. Windows shows what’s happening inside the guest. vCenter shows what the host is actually delivering. And CPU Ready fills in the critical gaps in between.
The key isn’t choosing one, it’s understanding all three in context. That’s how you avoid false alarms, spot real bottlenecks, and make smarter calls about scaling, capacity, and performance.
Ready to cut through the noise and get a unified view of your VMs?


Subscribe to our blog
Get articles like this delivered straight to your inbox