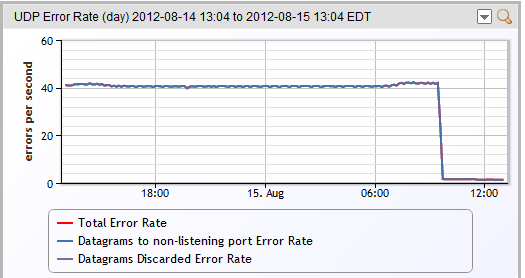
A company started a trial yesterday, added a bunch of windows hosts, and immediately got warnings triggered that their hosts were “receiving 42 datagrams per second destined to non-listening ports…Check if all services are up and running.”
This was across many of their hosts, and was an issue they were unaware of, and didn’t immediately know the cause.
However, this morning we received an email:
“I need to share my excitement with discovering the cause of the UDP ‘storm.’ It was the Drobo Dashboard Service we had running on a Citrix XenApp server. Every 5 seconds, it was broadcasting to port 5002 searching for our appliance.
It was further amplified as we have Virtual IPs enabled on the Citrix server, resulting in what appeared to be a broadcast coming from each IP every 5 seconds.
We disabled that service and the UDP alarms have cleared. Thanks again.”
Their UDP error graph now looked much better:

While having 40 extra packets per second discarded by servers is not really going to affect them much (unlike the old days, when a few hundred broadcasts per second could freeze a computer entirely), the more things are controlled, and understood, the better your datacenter will perform. Sources of hidden complexity can hinder troubleshooting, slow resolution, and lead to failures later on.
This is just an example of the ways LogicMonitor has you covered. There are many alerts that most people will never see – but it’s nice to know there are thresholds set that will help you get your infrastructure conforming to best practices – if you happen to slip.
Subscribe to our blog
Get articles like this delivered straight to your inbox


