In this article


Managing IT environments can be challenging, especially with the growing complexity of hybrid infrastructures. These interconnected technologies, including servers, routers, storage arrays, and software-defined elements running in both data centers and cloud environments, require robust infrastructure monitoring. Effective monitoring must provide visibility into all of your resources to diagnose performance, utilization, capacity, and bandwidth issues across your entire IT estate—before an outage impacts customer experience.
In our recent LogicMonitor Elevate Summit 2024 session, Beth Winters, Senior Product Marketing Manager, and Gus Emery, Senior Solution Specialist, shared practical insights to help you leverage LogicMonitor’s LM Envision platform for effective infrastructure monitoring. This post will cover key topics such as seamless resource discovery, performance correlation, automatic log correlation, and real-time insights to optimize your IT operations.
Understanding Hybrid Environments
There are different types of hybrid users, each facing unique challenges:
- Unintentional hybrid user: You might find yourself in this category if your company has grown through mergers and acquisitions and now includes a complicated mix of resources across on-premises data centers, public/private clouds, and applications.
- Intentional hybrid user: If you’re strategically using cloud and on-premise technologies to balance performance, cost, and scalability, you fall into this category.
- Transitional hybrid user: Perhaps you’re in the process of moving from an on-premises setup to a hybrid environment. You need a flexible monitoring solution that can adapt and grow with your company as your infrastructure evolves.
Regardless of your situation, LogicMonitor’s LM Envision platform helps you gain visibility across all environments, enhancing operational efficiency.
Seamless resource discovery and performance correlation
LM Envision lets you quickly discover any resource or service, no matter where it’s deployed. This is essential for managing today’s distributed IT environments. The platform allows you to:
- Discover resources: Automatically detect resources and services across cloud and on-premises environments using lightweight, agentless collectors that continuously scan your network for updates.
- Correlate performance across metrics, events, logs, and traces: Align the performance of your key IT infrastructure and applications with the KPIs relevant to your business. This will help you understand how infrastructure performance impacts overall business outcomes.
Example: Suppose you manage a hybrid environment with AWS and on-premises servers. With LM Envision, you can discover all instances, track their performance, and correlate this data with business metrics like transaction rates or user engagement levels. This enables you to identify performance bottlenecks and understand their impact on your operations.
Automatic log correlation for efficient troubleshooting
One of the standout features is LM Envision’s automatic log correlation. This feature enables you to rapidly troubleshoot issues by correlating logs with detected problems, reducing the time needed to resolve them.
LM Envision integrates with various logging systems (e.g., Syslog, Windows Event Log) to ingest logs in real time. The platform’s correlation engine analyzes logs and performance data to identify patterns and anomalies. When an anomaly is detected, LM Envision generates alerts with context-rich information, enabling you to pinpoint the root cause quickly.
Example: During an unexpected server outage, LM Envision’s log correlation feature can identify the sequence of events leading up to the failure, such as configuration changes or unusual network traffic patterns, allowing you to resolve the issue more efficiently.
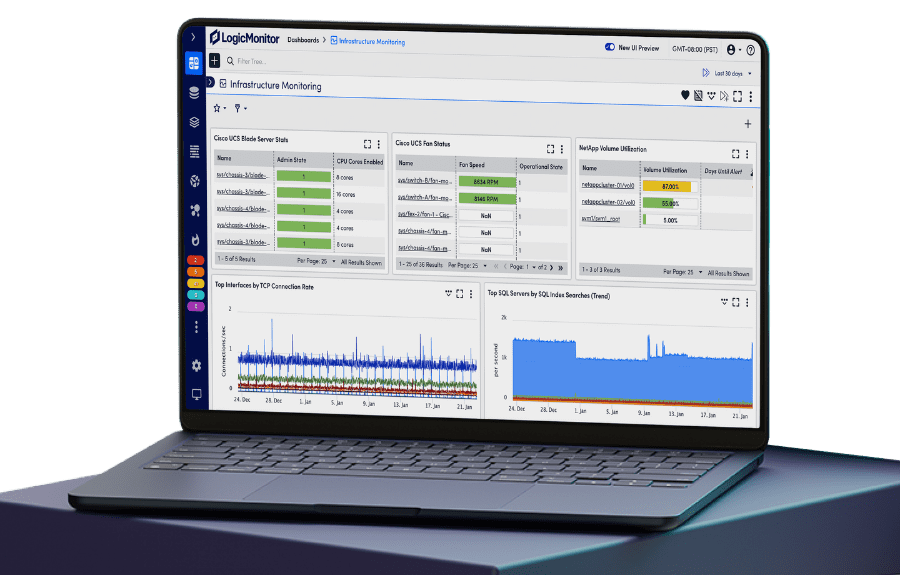
Unified dashboards and real-time insights
LM Envision’s customizable and out-of-the-box dashboards provide real-time insights into hybrid environments. These dashboards are designed to be intuitive, offering a consolidated view of your entire IT landscape.
- Unified dashboards: Centralized view of metrics and logs from both cloud and on-premises systems. Customize widgets to display critical KPIs, such as CPU usage, memory utilization, and application response times.
- Real-time alerts: You will be notified immediately of potential issues, allowing for proactive management. Configure alerts with thresholds and escalations to ensure a timely response.
- Customizable views: Tailor the dashboard to highlight your organization’s most critical data points. For example, network administrators can create a view focused on bandwidth usage and latency, while application developers might focus on transaction throughput and error rates.
Example: Create a dashboard that displays real-time performance metrics for your multi-cloud environment, including AWS, Azure, and on-premises servers. This unified view helps you monitor resource utilization, detect anomalies, and take corrective actions proactively.
Optimizing IT operations with LogicMonitor’s LM Envision platform
LogicMonitor empowers you to achieve comprehensive observability, driving efficiency and enabling proactive decision-making. Leveraging LM Envision’s advanced features can optimize your IT operations and ensure robust performance and reliability across your hybrid environments.
Key takeaways:
- Scalable monitoring: LM Envision scales with your environment, whether you’re managing a few servers or thousands of instances across multiple clouds.
- Enhanced visibility: Unified dashboards and real-time insights provide a clear view of your entire IT landscape.
- Proactive management: Automated log correlation and intelligent alerting enable quick identification and resolution of issues, minimizing downtime and improving service quality.


Subscribe to our blog
Get articles like this delivered straight to your inbox