When I started LogicMonitor, I knew nothing about Product Management. (Yes, yes… but I know more than I used to.) I made all sorts of mistakes, thinking I was the target customer. (Surprise! I wasn’t). I added powerful features, that were hard to use, but I thought they were essential and people will Read the Fine Manual. (Surprise! Many don’t.) We’ve made a lot of progress in making our powerful-but-hard-to-use features more accessible over the years, but I want to talk about one of my favorites, that requires some understanding before you see the benefits: discovery filters. (But boy, are the benefits worth it!)
LogicMonitor comes from a heritage of operating SaaS datacenters, where pretty much everything is critical, and any errors should be alerted on. But that is not true in all deployments – if a customer is in a corporate networking department, not just monitoring core switches, but distribution network switches, then while switch uplink ports are certainly critical, the switch ports connecting to end user workstations are not. LogicMonitor would, by default, alert you whenever an end user switches off their computer, as the switch port status would change. It would alert you if a workstation starts over subscribing their port, causing discards. (Something you want to know on a server port, but not an end user port.)
So how do you stop LogicMonitor from causing too much noise on a distribution switch, but still provide you the data and alerts you need? Discovery Filters!
Discovery filters simply control what objects are discovered for monitoring on a host. They specify a set of conditions that the object must satisfy in order to be discovered. An example: we don’t usually care about monitoring the state of down interfaces, so the Interfaces datasources have a filter:

This simply means that when walking the table of interfaces via SNMP, each discovered interface also has the interface status OID queried. That status must be a “1” in order for the interface to pass the filter and be discovered. So interfaces that are down, or in testing, will not be discovered, thus not cluttering up the host with interfaces you don’t care about. (And as Active Discovery runs periodically, if you bring an interface up later, it will pass the test, and be monitored.)
Use Case: Treating switch Edge ports and Uplink ports differently.
So, back to our distribution switch use case (a real example from a conversation with a client this week). Cisco switches were used, uplink ports were consistently labelled “Uplink” in the switch port description, and Edge ports were not labelled – at least not with that string.
The simple case would be to add a discovery filter to only pass interfaces whose description contained the string “Uplink”. e.g.:

(How did we know that 1.3.6.1.2.1.31.1.1.1.18 returned the interface description (technically, interface Alias) as a string? In this case, it was used in the Active Discovery section as the Description field, so it was apparent, but otherwise we would have had to look it up in a MIB browser.)
There are two problems with this simple approach: what if we still want to monitor our edge ports, but just have different alert settings? And more significantly, this will prevent discovery from all devices unless the interfaces have the Uplink description- which is likely to stop any interfaces from being found on servers, etc.
The Solution: Cloning datasources and the AppliesTo field.
The standard Interfaces datasource applies to all devices that respond to SNMP, but we only want to apply the extra filtering to our network gear. The end result we want is three datasources instead of one: one that applies to Cisco devices, and only discovers uplinks; another that applies to Cisco devices and discovers everything not an uplink, and one that applies to everything else. This is the process to achieve that:
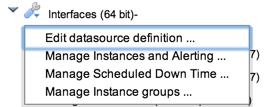
- From the Hosts tab, find a network device, click the tool icon next to Interfaces (64 bit)-, and select Edit datasource definition:
- In the page that opens, clone the datasource: right click the datasource in the right hand navigation tree, and select Clone. Give the new datasource a descriptive name and display name – e.g. Interfaces (64 bit) Uplinks.
- Edit the Applies To field so that the Uplinks datasource only applies to Cisco devices.
- Add a discovery filter so that only Uplinks are discovered. If you use “Uplink” in the interface description, you can follow the example above, but there are many ways this could be done depending on the standards you adopt in your network infrastructure. For example, if you always use ports 45, 46 47 and 48 on your switches as the uplinks, you could add a filter against the interface description:

and submit.
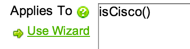
- Now we have a datasource that discovers only uplinks. If we want to also monitor non-uplinks, we can repeat the process: clone our new datasource, name it Interfaces (64 bit) Edge Ports, set the Applies To to IsCisco() (The Applies To field will have been commented out during the cloning process.) Now set the filter to the inverse. e.g. instead of Contains Uplink, use the test NotContains Uplink (or RegexNotMatch 4[5678]). We also want to adjust alerts on this datasource: particularly removing the threshold on the Status and StatusFlapping datapoints.
- Finally, we need to prevent our regular Interfaces datasource from monitoring these interfaces as well. This is easily achieved by setting the Applies To field to “hasCategory(“snmp”)&& !isWindows() && !isCisco()” (i.e. apply this datasource to all hosts that support SNMP, but not Windows hosts and are not Cisco hosts.)
That’s it. We’ve now customized LogicMonitor so that it intelligently detects Uplink ports on switches; detects Edge Ports for monitoring, but applies less alerting to them; and uses the default interface monitoring for everything else. All easily tunable to meet your needs.
Discovery filters can be used in a variety of ways (think discovering QA volumes on storage arrays differently from Production volumes, so they can automatically have different thresholds. Automatically classifying VIPs on a load balancer, etc.) The great thing is they allow you centrally define rules for classification of objects across the enterprise, and apply automatically, even as you add and remove devices and objects (interfaces, VIPs, volumes, etc) on those devices.
Got an interesting use case for filtering you’ve implemented (or could use help setting up)? Let us know in the comments section.
© LogicMonitor 2026 | All rights reserved. | All trademarks, trade names, service marks, and logos referenced herein belong to their respective companies.