In this article


Learn More
Learn more about how to deploy Resource Explorer in your environment.
Welcome to the second installment of our Resource Explorer series. In this blog, we’ll discuss the practical aspects of getting started with LM Envision Resource Explorer. If you’re new to Resource Explorer or want to learn more about its benefits and features, we recommend checking out our first blog in the series.
For those ready to roll up their sleeves and start using this powerful resource management tool, let’s jump into the step-by-step guide on navigating, customizing, and maximizing Resource Explorer in your environment.
Navigating to Resource Explorer
Navigating to Resource Explorer is easy.
- Make sure the New UI is turned ON. It’s at the top of the navigation bar.

- Open Resource Explorer. Select it by Resource Explorer on the left-side navigation panel (your panel may be organized differently).

Understanding Resource Explorer views
Getting into a Resource Explorer dashboard is easy with a few preset views. There are two control areas in Resource Explorer: Filters and Groups.
- Filters will control what data is shown
- Groups control how data is shown
You can type the name of any tag into either area, and typeahead assist will guide you. This includes LogicMonitor properties, cloud tags, custom properties (such as from property sources), and CMDB-enriched tags. Add tags to either control and the system will automatically suggest some tags to help you get started.

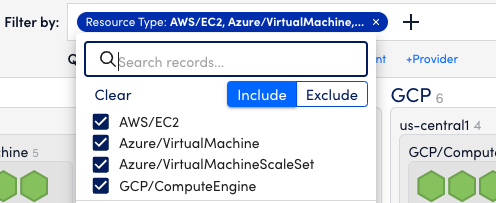
In this example, the Cloud IaaS view is filtered to only IaaS resources (virtual machines) from the cloud providers. Choose Resource Type and select to include those you wish.
In this example, the views are grouped by the cloud provider, operating region, and resource type. You can drag to reorder those tags if you want them to reflect different things. You can also save your views.

Saving your views
Once you’ve set up the right filters and groups, you can save the views to always be available. The following setup steps only need to be done once.
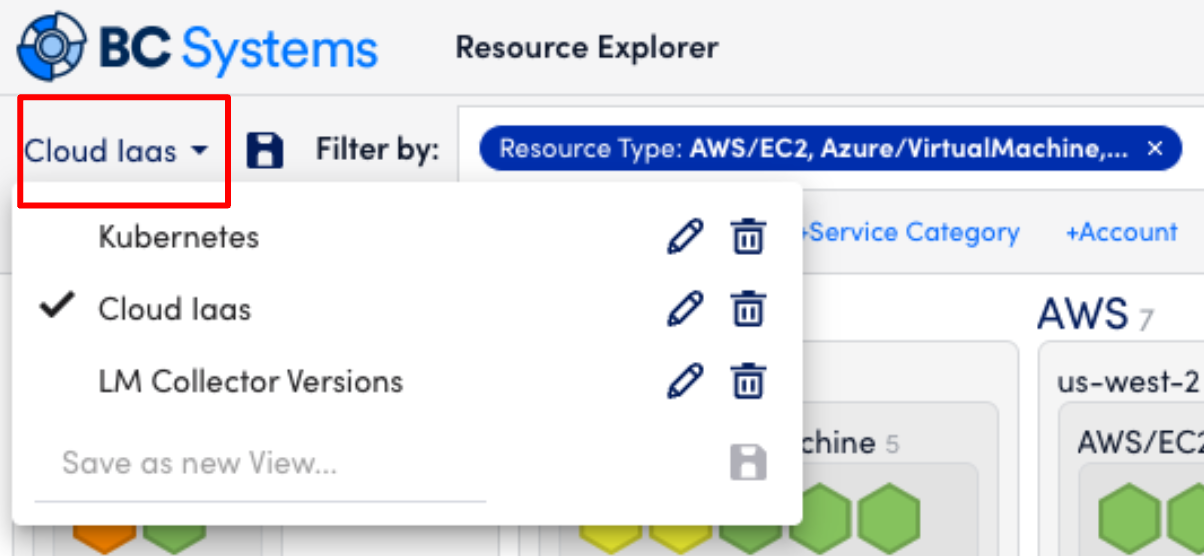
- Click the top-left of the view where it says Cloud IaaS in the following screenshot (yours will be different) to see the saved views.
- You can save your own views. Presently, saved views are not shared across users.
Let’s walk through how to make a new saved view.
Making a saved view for all my resources
- “X” out existing filters and groups.
- Save a new view. Do not click the disk icon to the left of the filter; you will overwrite the existing saved view.
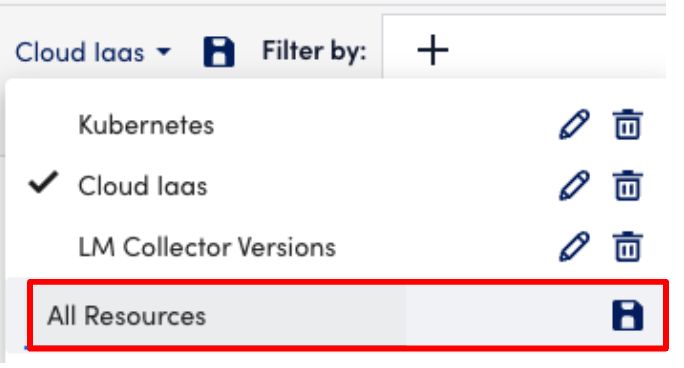
- Instead, click the current view name to open the dialog. At the bottom, type in a new name and save it. Name it All Resources.
Making a saved view for only resources with active alerts
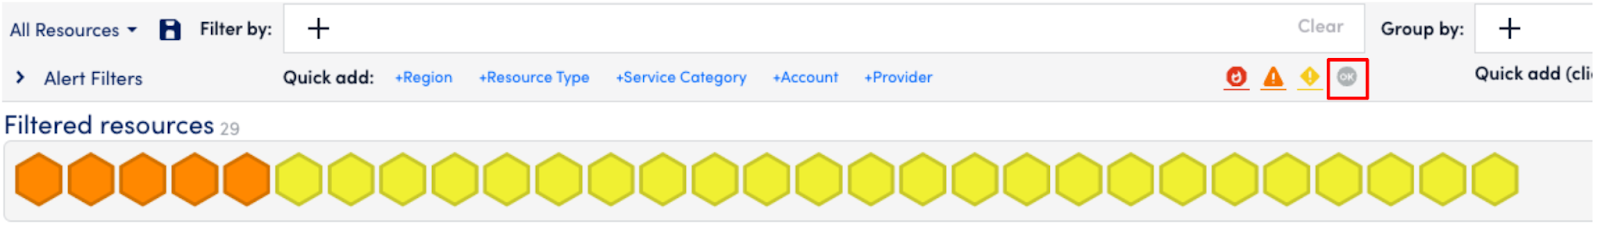
Maybe you only want to see the alerts that require attention. Are problematic resources all in one place or spread evenly? Different troubleshooting patterns emerge visually.
- Click to turn off the green resources.
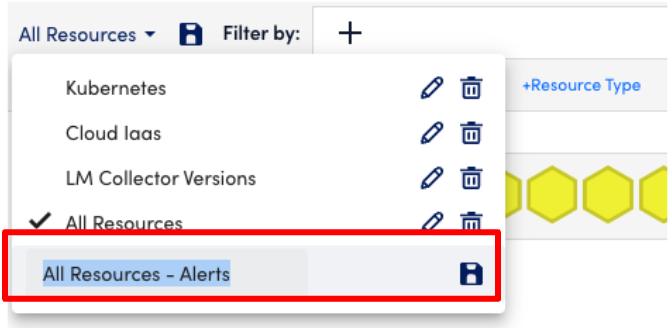
- Save this as another new view (don’t click save yet). Open the All Resources dialog and make a new name at the bottom. Then click the save icon for the new named view.
Making a saved view that organizes alerts by the teams that own them
You might have a tag for a department, owner, or something else. Use what you have to create views that matter to you.
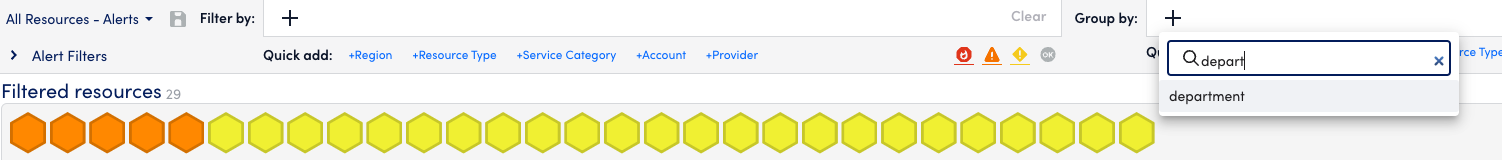
- Click in the Group By and add department.
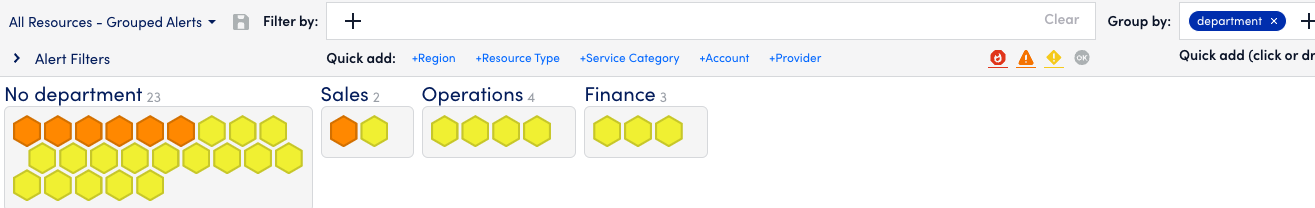
- Save the view like above but as All Resources – Grouped Alerts.
- It should now look like this:
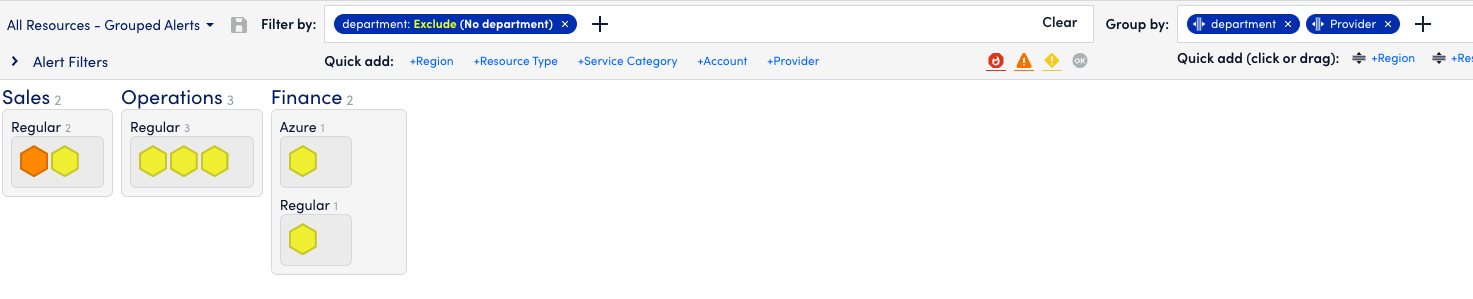
- Edit that view once more by adding Provider to the Grouping.
- Optional: Filter out No Department from the view if you wish.
- Save the view again (you can click the disk directly this time to overwrite).
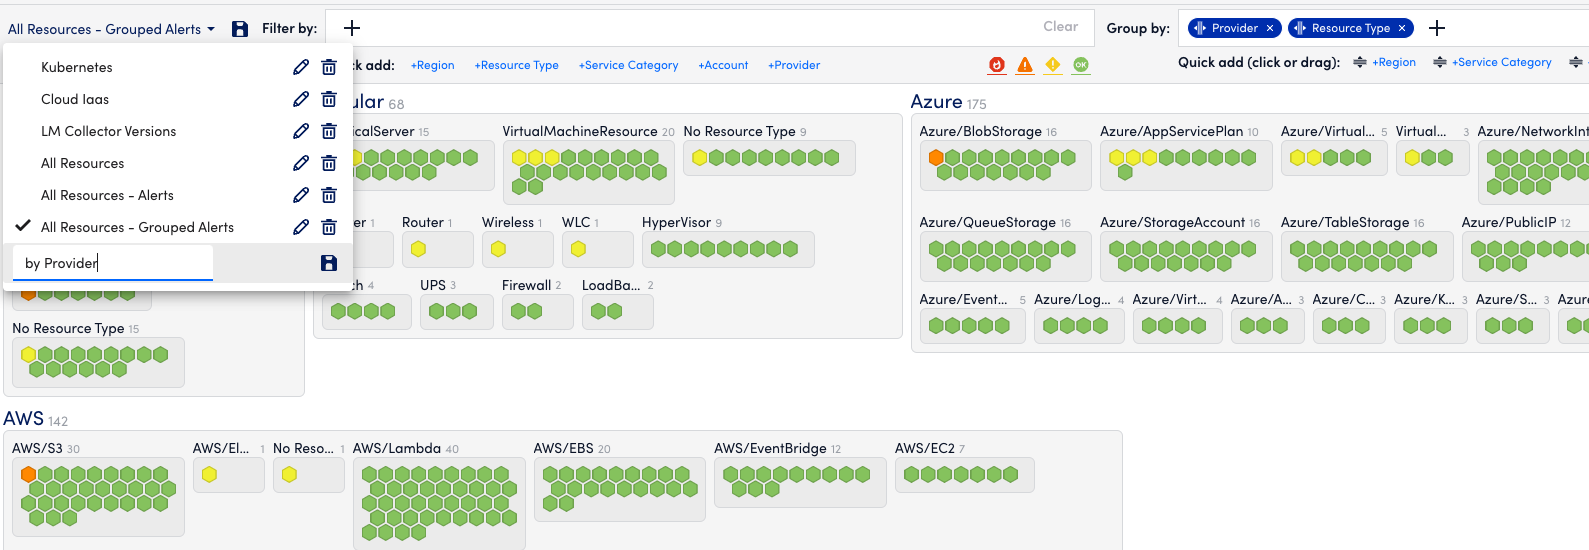
Making a saved view for all my resources, grouped by on-prem vs. cloud
- “X” out all the groups and filters again. Turn on the green resources again.
- On the Group By control, click the Provider choice in the Quick Add section.
- Repeat and add Resource Type.
- Save this as by Provider.
Organize network components by location, type, and model

Resource Explorer can be used to discover networking performance.
With this type of view, you can easily discover how network problems are unfolding.
To get the view above, which organizes your Meraki network components by location, type, and model, you would first filter by “meraki.api.network.name” and ensure that the property exists. Then group by the following:
meraki.api.network.name
Resource Type (which is an alias to multiple normalized tags!)
Auto.meraki.model
auto.os.version.description


Subscribe to our blog
Get articles like this delivered straight to your inbox