Modern network management requires administrators to gather information about live network performance, detect faults as they are happening, and provide assurance of overall operations. Simple Network Management Protocol (SNMP) is a protocol commonly implemented for monitoring network infrastructure that satisfies each requirement. Network administrators have long used SNMP to monitor network health because it provides real-time alerts and useful data about devices, which can help to identify critical network events and reduce downtime quickly.
In this article, you’ll learn how SNMP monitoring works, looking specifically at key SNMP components like management information bases (MIBs) and object identifiers (OIDs). You’ll also learn about the methods SNMP uses to gather device information and some best practices you can implement when using SNMP to monitor your network.
What is SNMP?
SNMP is a network protocol used by monitoring systems for infrastructure monitoring and alerting. SNMP was first defined in 1988 as SNMPv1 (version 1) and has undergone multiple iterations over the years, with SNMPv3 (version 3) being the latest version introducing encryption and authentication for secure environments.
For many years, vendors have standardized support for SNMP in network devices, including routers, switches, firewalls, and load balancers. In some cases, servers, storage devices, and software applications have SNMP built into them.
SNMP’s widespread use stems from its reliance on standardized data structures, known as MIBs and OIDs, which are universally understood by devices. Its simplicity and ubiquity have led to the development of numerous monitoring tools. While often viewed as a passive protocol for gathering device status, SNMP also supports active configuration changes through the `snmpset` function.
Let’s take a look at how SNMP monitoring works.
How SNMP monitoring works
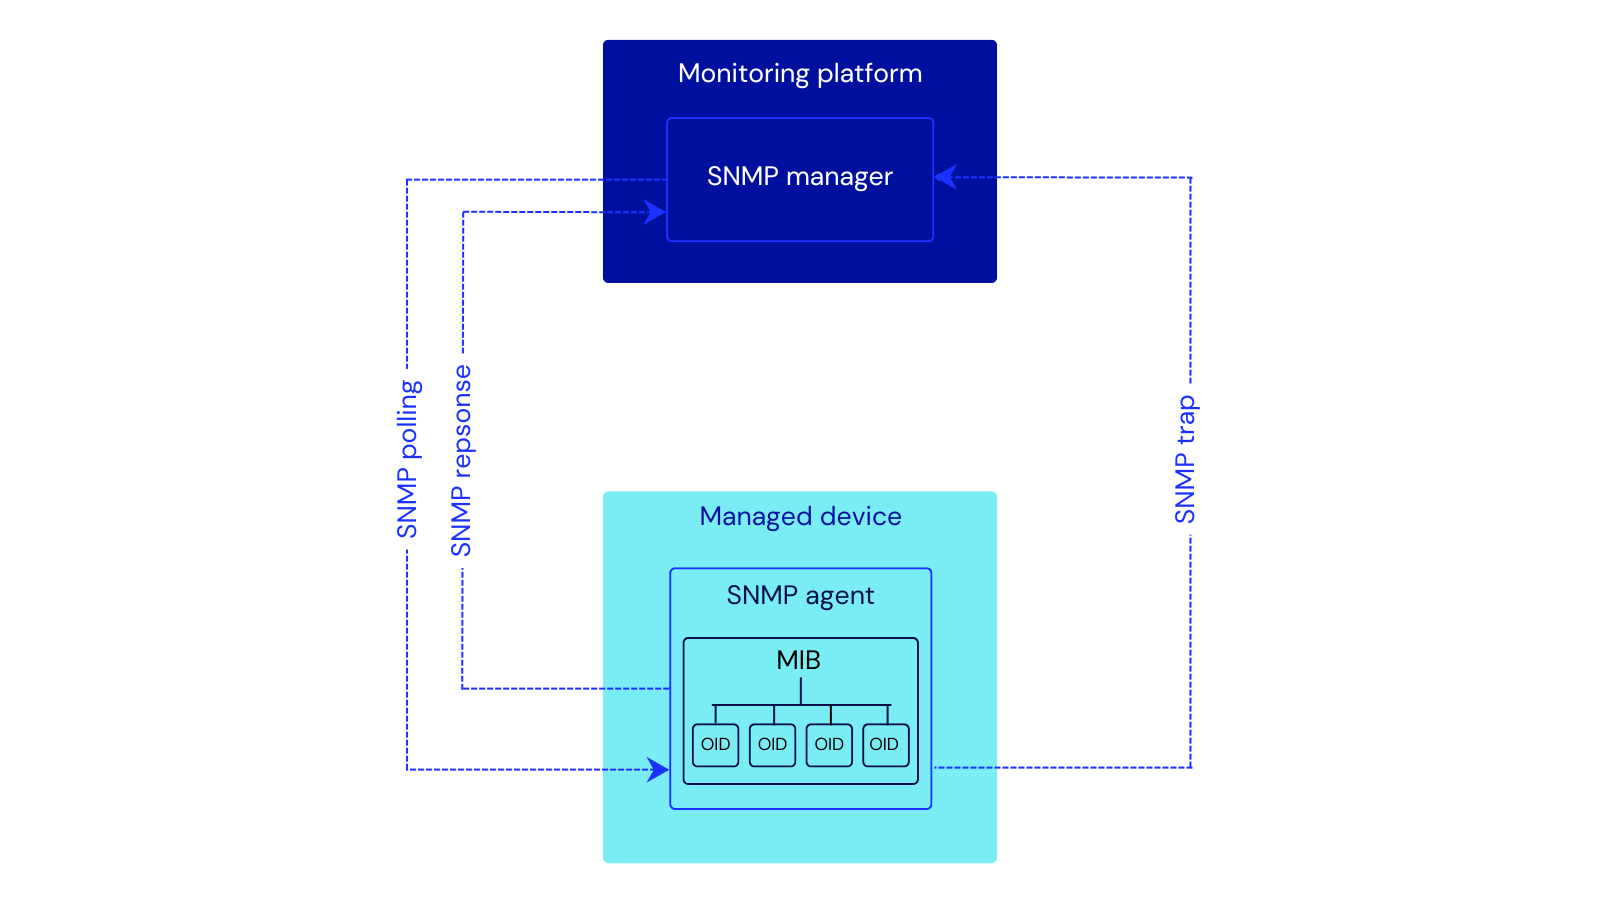
SNMP relies on SNMP agents and SNMP managers for its two methods of data gathering: polling and traps. Agents embedded in managed devices collect and store data about device health and configuration, while managers (e.g., LogicMonitor Envision) retrieve and centralize this information from agents across the entire network. Whether SNMP devices use polling or traps, the agents and the manager must be configured by an administrator to be aware of and interact with each other.
In the diagram above, the SNMP manager initiates communication with agents via polling, while agents autonomously send traps back to the manager when predefined events occur. MIBs act as a shared dictionary, enabling agents and managers to understand and exchange data efficiently.
SNMP polling
SNMP polling operates using a client-server model. The manager sends queries to the agent on a managed device, and the agent responds with the requested information, which may include device status information, performance metrics, and configuration settings.
Polling provides regular device information snapshots, but scalability can become challenging in large networks.
SNMP traps
SNMP traps send real-time alerts from the agent to the manager when a significant, predefined event occurs. SNMP traps are essential to a network monitoring strategy because they notify network administrators (through the monitoring system) of critical changes to a device’s status. Unlike polling, which periodically queries for device information, traps are event-driven and triggered by the monitored device itself.
A few common SNMP trap scenarios include a failed power supply, a downed or flapping network interface, or a sudden spike in CPU utilization, each of which would send an alert to the SNMP manager on the monitoring system.
Understanding MIBs and OIDs
To fully harness the power of SNMP for network monitoring, you need to understand how MIBs and OIDs function and how they enable effective communication between SNML agents and managers.
To enable SNMP managers to interact with device information, SNMP agents host databases called MIBs, which contain data objects representing the attributes of a managed device. For example, CPU utilization, memory usage, and network traffic. Standardized MIBs, like MIB-II (also known as mib-2), are available for common network device information; however, vendors sometimes build proprietary hardware, which requires custom MIBs for SNMP managers to be able to poll device-specific information.
OIDs are references providing access to the data contained within an MIB. OIDs come in a hierarchical, numerical format, beginning at the root and progressing through the MIB to the target object.
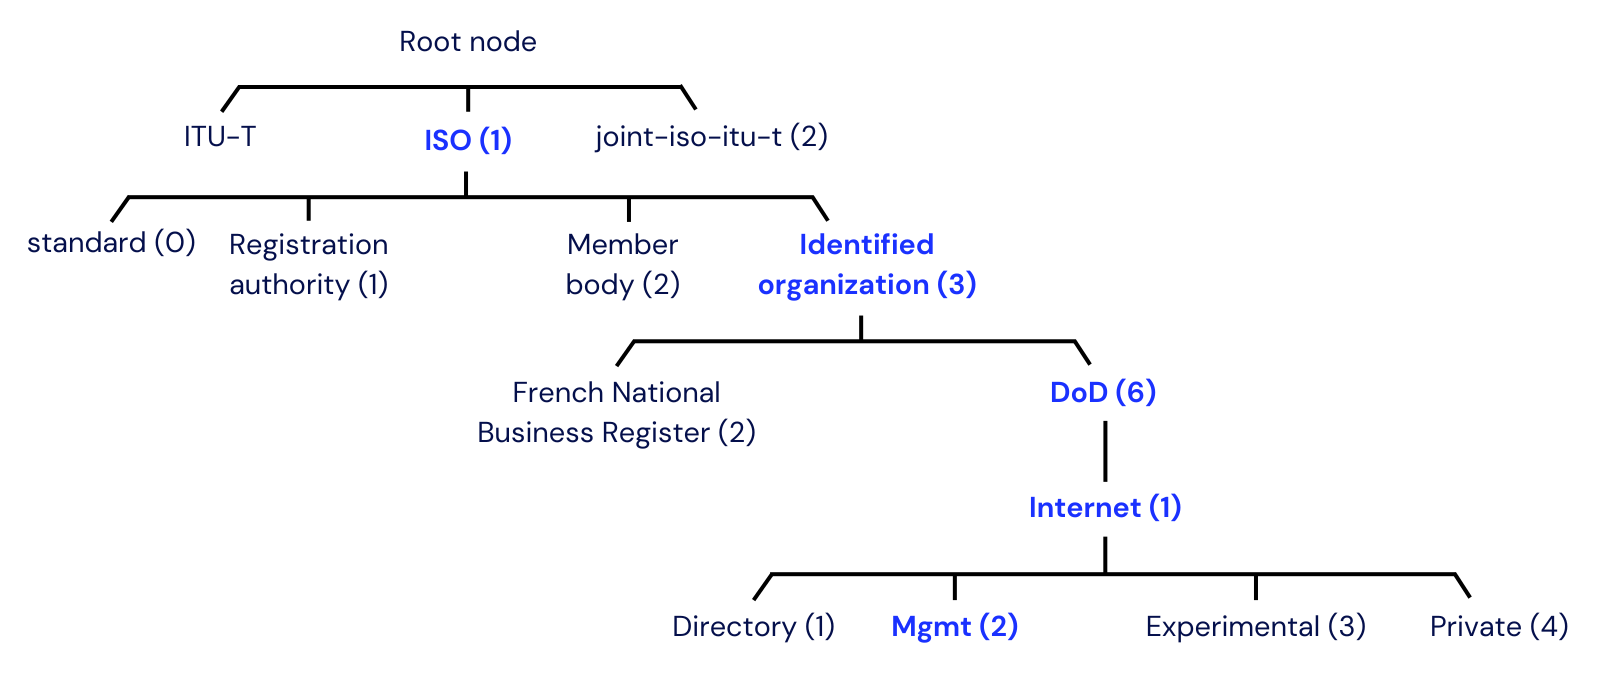
Consider this analogy of how OIDs locate data within an MIB: the MIB is like a tree where the trunk is the root, the branches represent categories of information, and the leaves are individual data points, like system uptime or CPU usage. Each leaf has a unique path from the root, much like an OID that points to specific data in an MIB. The SNMP agent knows the structure of data on the device, like a treekeeper knows the structure of the tree, and retrieves the value of a requested object (leaf) based on the OID (path of branches and twigs) the SNMP manager provides. The following diagram illustrates an example where OID 1.3.6.1.2 refers to the management node (mgmt), which is the MIB branch under which vendor-neutral OIDs reside.
Now, let’s look at a practical example using MIBs and OIDs to monitor network performance. Using SNMP, you could poll the OID corresponding to the `ifInOctets` object, which records the inbound network traffic for an interface in bytes. The OID for `ifInOctets` is 1.3.6.1.2.1.2.2.1.10, which follows the following MIB path:
Root node is the starting point for all MIBs, representing the global namespace for network management data.
`iso` (1) indicates the data adheres to the International Organization for Standardization (ISO) structure.
`org` (3) identifies organizations that define standard management information.
`dod` (6) points to the US Department of Defense, which historically defined many internet standards.
`internet` (1) represents information related to internet management.
`mgmt` (2) is a branch for MIBs.
`mib-2` (1) is the standard MIB-II branch, widely implemented across network devices.
`interfaces` (2) is a subgroup within MIB-II for network interface management.
`ifTable` (2) contains information about all interfaces on the device.
`ifEntry` (1) represents a single interface, with details like speed, status, and traffic counters.
`ifInOctets` (10) is the specific object tracking inbound traffic (in bytes) for the interface.
In this example, SNMP polls the `ifInOctets` OID at regular intervals. Monitoring tools like LogicMonitor can calculate interface bandwidth usage over time, converting raw data into useful network performance monitoring insights.
Setting up SNMP monitoring
To set up SNMP to monitor a network, an SNMP agent must be configured on the network device to communicate with the SNMP manager on a monitoring system. That means you need first to consider how to choose the right monitoring system.
An SNMP monitoring platform must be able to efficiently collect and interpret data from a variety of network devices. Once a monitoring system is procured and set up, you can configure the SNMP agents on managed devices. SNMP agents are typically preinstalled and awaiting configuration on network devices; however, if you intend to [monitor non-network devices, like servers using SNMP, you can install an SNMP tool like `net-snmp`.
LM Envision is a robust and scalable software-as-a-service (SaaS)–based monitoring platform that simplifies the process of deploying an SNMP manager for monitoring on-premises, cloud, and hybrid environments. With its easy-to-use web interface, LM Envision allows administrators to set up SNMP polling and alerts quickly. It also includes the capability to upload custom MIBs to extend device coverage and monitor anything in the environment.
With SNMP ready to configure, the process typically involves enabling SNMP, setting the SNMP version configured on the monitoring system (e.g., SNMPv2c or SNMPv3 are the latest), and setting the required security settings. You can configure these settings one device at a time or leverage automation in the environment to deploy these agent settings to all your network devices. Once the SNMP agents have been correctly configured, you will begin to see device status information and performance metrics in your monitoring system.
Now that you know how to set up SNMP monitoring, let’s look at a few best practices you can implement along the way.
Best practices for SNMP monitoring
Optimal SNMP monitoring starts by first ensuring appropriate polling intervals to prevent monitoring performance degradation:
Trial different polling frequencies and aim to achieve a balance between data freshness and server load based on the criticality and size of the network.
Avoid polling unnecessary OIDs that won’t provide useful information to minimize the volume of SNMP traffic.
Use SNMP traps to detect sudden changes in device status to reduce the requirement for frequent polling and consider limiting frequent polling to critical devices only.
Combine polling and traps strategically. For example, use traps for event-driven alerts while reserving polling for trend analysis or periodic health checks.
Did you know: When using a monitoring platform like LM Envision, SNMP polling comes tuned out-of-the-box by our monitoring engineers to maximize scalability and performance. Since polling provides regular device information snapshots, useful for identifying trends or outages, transient issues between queries can go undetected when using SNMP polling alone; SNMP traps help capture everything.
Optimizing SNMP traps
Mitigate trap storms by implementing suppression mechanisms such as:
Rate limiting to cap the number of traps sent within a specific timeframe.
Threshold-based alerts to trigger traps only when critical thresholds are breached.
Filtering redundant traps to reduce unnecessary noise in the monitoring system.
Centralize logs for trap analysis to correlate events across devices and gain deeper insights into network behavior.
Proactively set up traps on managed devices and configure automatic alerting in your monitoring system to respond to issues before they escalate.
Get more in-depth best practices for managing SNMP traps.
SNMP polling can be used to discover devices in your environment.
During network discovery, an SNMP walk can retrieve the entire OID tree from a device, helping identify its capabilities and metrics for monitoring. This process is vital for onboarding new devices efficiently.
Tools like LM Envision can perform SNMP walks during automatic network scans to identify and categorize devices based on a few identifiers you provide, reducing the need to enter each device into the monitoring system manually.
Prioritize SNMP security
Security should not be left until the end when implementing SNMP. The latest iteration of SNMPv3 uses encrypted communications between manager and agent, so unless your devices do not support SNMPv3, older versions like SNMPv1 and SNMPv2c should always be disabled.
If you must use SNMPv2c for compatibility reasons, ensure you are not using any default community strings and reconfigure them to be sufficiently complex.
Leverage access control lists (ACLs) to restrict SNMP communication to trusted IPs and use firewalls to limit external exposure.
As an additional measure, using firewalls and access control lists in the network can limit device SNMP access to trusted IPs of monitoring systems.
Conclusion
SNMP is an essential network monitoring tool that measures network performance, detects issues, and understands an environment’s overall health in real time. While SNMP has limitations, such as scalability challenges in polling and the potential for trap storms, these can be mitigated with careful configuration and best practices. The tips provided for effective polling, alerting traps, and securing SNMP implementation will enable you to optimize your monitoring strategies and focus on innovation rather than troubleshooting.
See what LogicMonitor has to offer when it comes to advanced network monitoring using SNMP and other tools.