In recent years, Solid-State Drives or SSDs have become a standard part of data center architecture. They handle more simultaneous read/write operations than traditional disks and use a fraction of the power. Of course, as a leading infrastructure, software and server monitoring platform vendor, we are very interested in monitoring our SSDs, not only because we want to make sure we’re getting what we paid for, but because we would also like to avoid a disk failure on a production machine at 3:00AM in the morning…and the Shaquille O’Neal sized headache to follow. But how do we know for sure if our SSDs are performing the way we want them to? Being one of the newest members of our technical operations team, it came as no surprise that I was tasked to answer this question.
So what actually happens to my SSD?
Solid State Drives are different from the traditional spinning platters. There are no moving parts (the drive head cannot crash into the platter) and there is nothing to demagnetize, but that does not mean they are immune to failure. On the contrary, they absolutely will fail due to the same technology that makes them so fast: NAND based Flash memory technology (a type of storage technology that does not require power to retain data). When deleting or writing files in a solid state drive, old data is marked invalid and new data is written into a new location in the NAND. The old data is later erased when the drive needs more space. Flash cells on an SSD can only be written on a limited number of times before they become unreliable. Simply put…it is like continuously writing on a piece of paper with a pencil and then erasing it. You can only write and erase so many times before the paper is worn out and unusable.
Sure, there are ways to monitor your disk. You can keep an eye on the disk read/writes and proactively watch for poor performance based on trends you see throughout time. At LogicMonitor, we already measure and alert on all the basics such as IO completion time, read and write IOPS, request service time, queue depth, etc. But all of this does not provide us with visibility into the hardware health of an SSD disk itself.
What if there was a way to see real time metrics on SSD wearout?
I found that SSD vendors now put S.M.A.R.T. (Self-Monitoring, Analysis, and Reporting Technology) counters or attributes to give information on the current health of the drive. My next query is how to access this particular data. Thankfully, the gods who blessed us with “ctrl, alt, delete” also gave us smartmontools. The tool consists of smartctl and smartd. Smartctl is the application to test the drives and read/report their hardware S.M.A.R.T statistics.
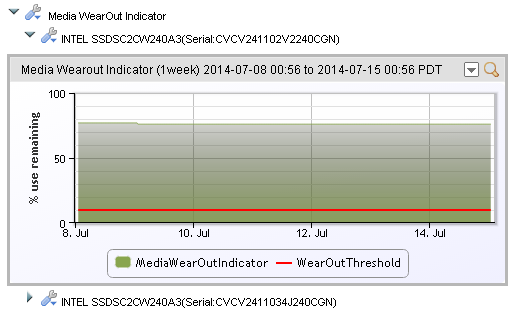
There are a few important counters to take into consideration when monitoring your disks such as write amplification, reserved space, temperature etc. We wanted to focus on disk life in particular. For example, the Media Wear-Out Indicator on Intel SSDs reports a normalized value of 100 (when the SSD is new) and declines to a minimum value of 1.
Making a datasource!
A new Media Wearout Indicator datasource was created by LogicMonitor.It is currently being used by the Operations team to monitor the SSDs in our production machines. To create the datasource, we utilized various smartctl commands. For example the command smartctl -l devstat -i -A -d sat+megaraid,0 /dev/sda is used to identify SMART health statistics on physical disk 0 behind the raid controller.
We now have the options of doing an SNMP extend to execute a script that will loop through all the available disks or having each command as a separate snmp extend oid. We decided to go with the latter because not only does having individual commands allow us to option of grabbing more statistics on the disk, it takes away the burden of having to manage an external script on each machine.
The LogicMonitor datasource active discovery portion will be able to find all the available disks and effectively collect the data on each. You will then be able to seeing media wearout data in real-time and set alerts so that you know when it’s time to replace it!
Are you not a customer but need to monitor your Solid State Drives (SSDs) and other IT Infrastructure? Try LogicMonitor free.
Have you created datasources to monitor your infrastructure? Post in comments and let us know what you’ve built.
Subscribe to our blog
Get articles like this delivered straight to your inbox


