Out-of-the-box integrations are great, and they help organizations see an immediate return on investment when the technologies they have invested in work together seamlessly. However, a little customization to these integrations can dramatically increase productivity and reduce mean time to resolution. Here we will address a couple of best practices and customizations that can take your PagerDuty and LogicMonitor integration to the next level.
Previously, we made integrating both tools easier by having a dedicated PagerDuty integration in LogicMonitor rather than having customers create a custom webhook. This allows the workflow to be as natural as possible by automatically propagating changes to PagerDuty as an engineer acknowledges, fixes, and adds notes about issues directly in LogicMonitor.
Context is King
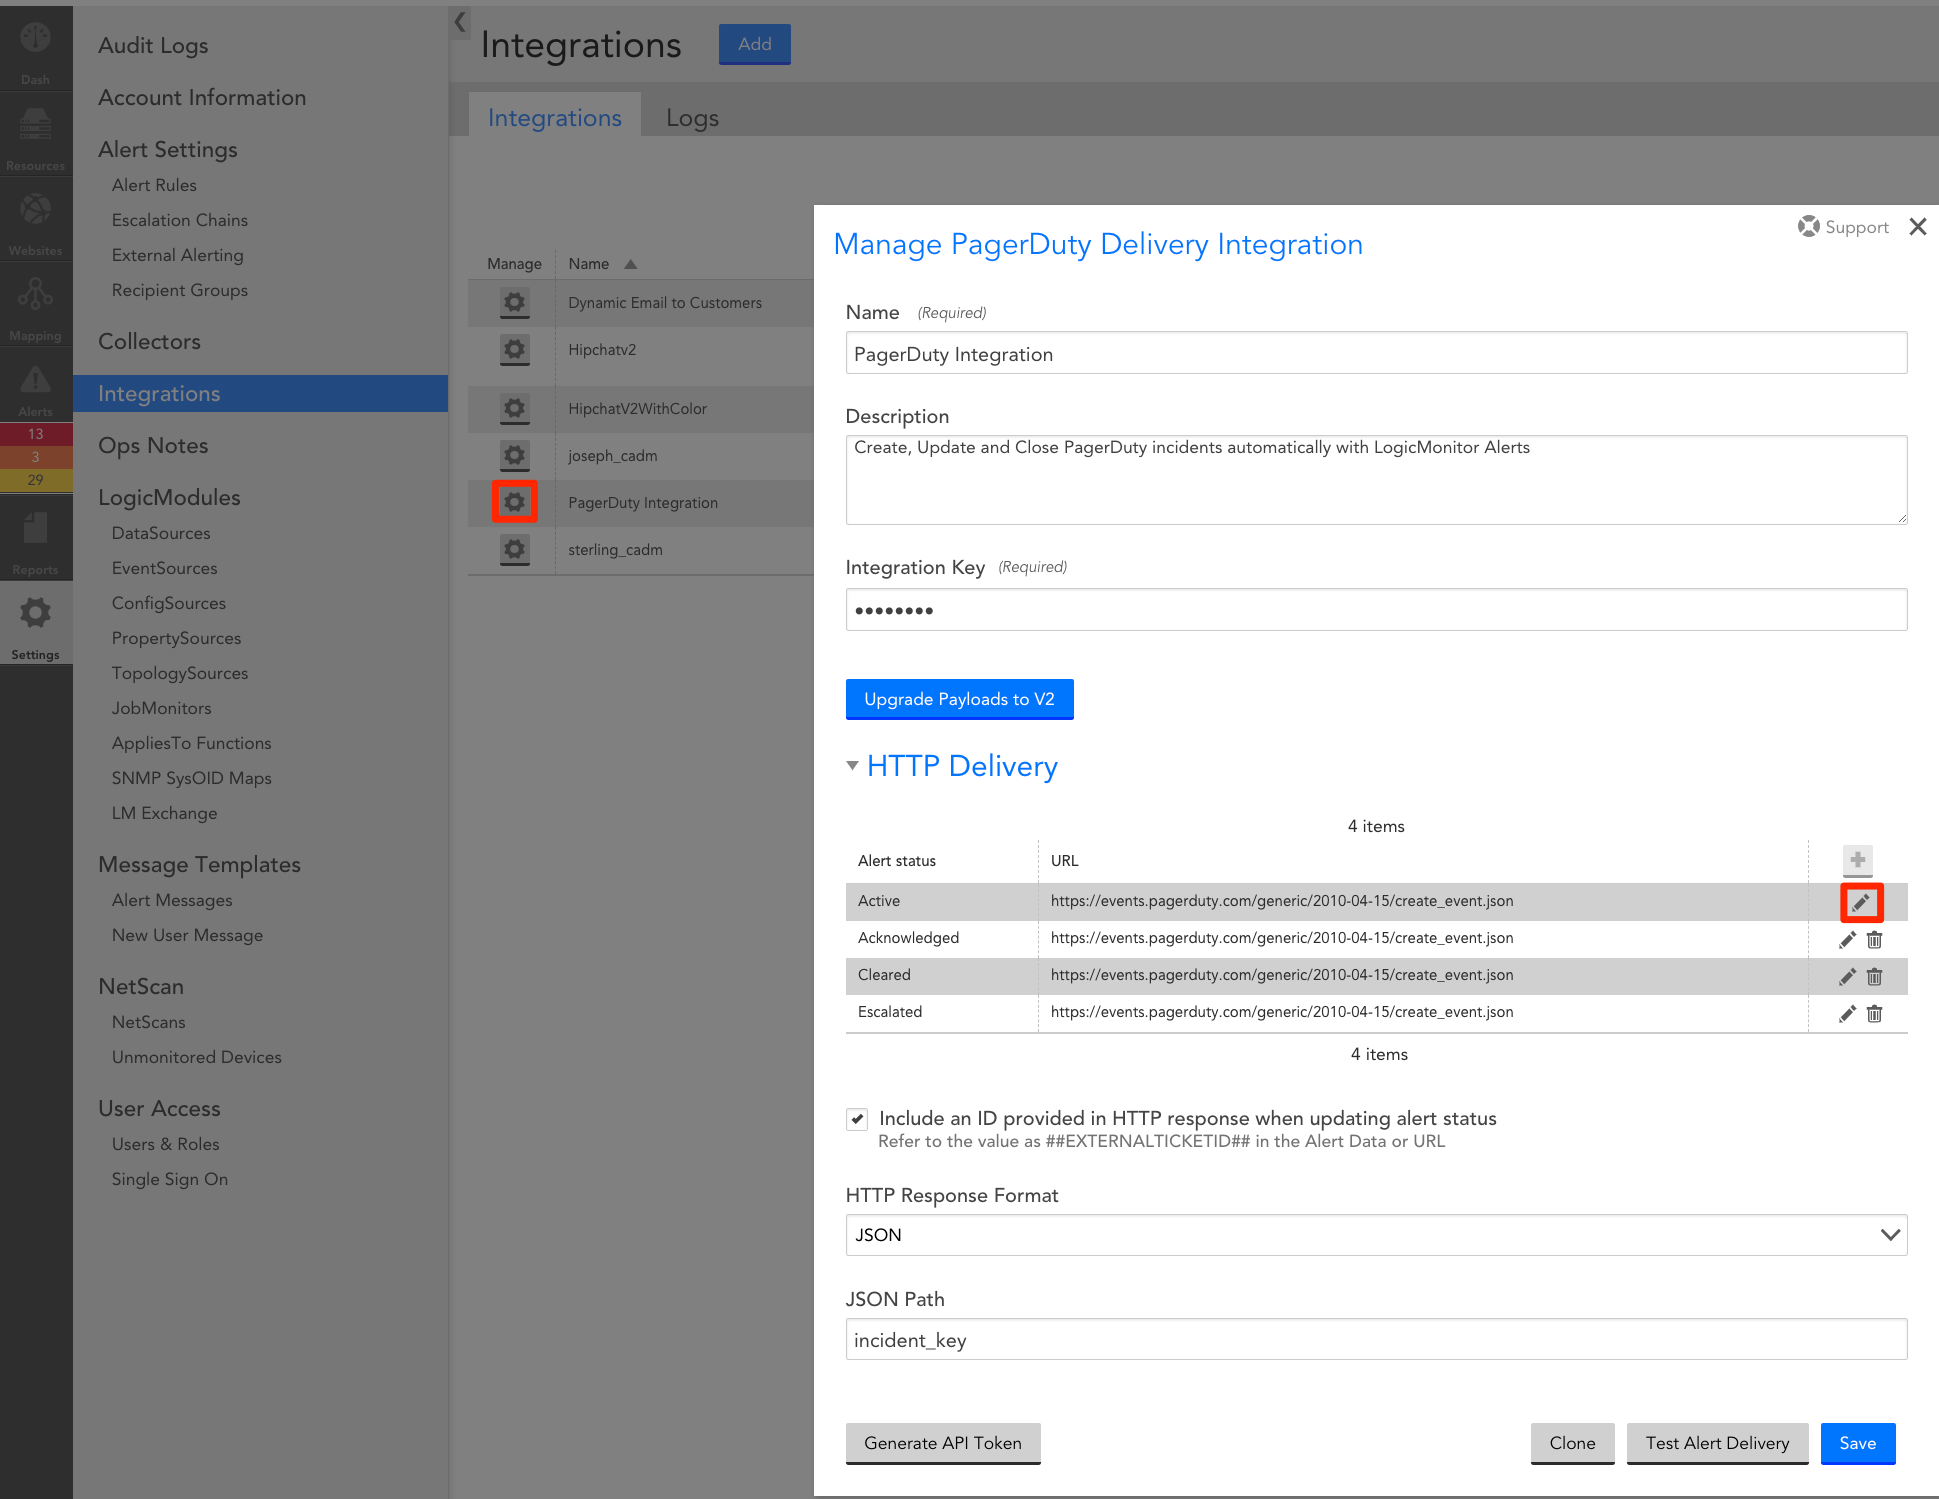
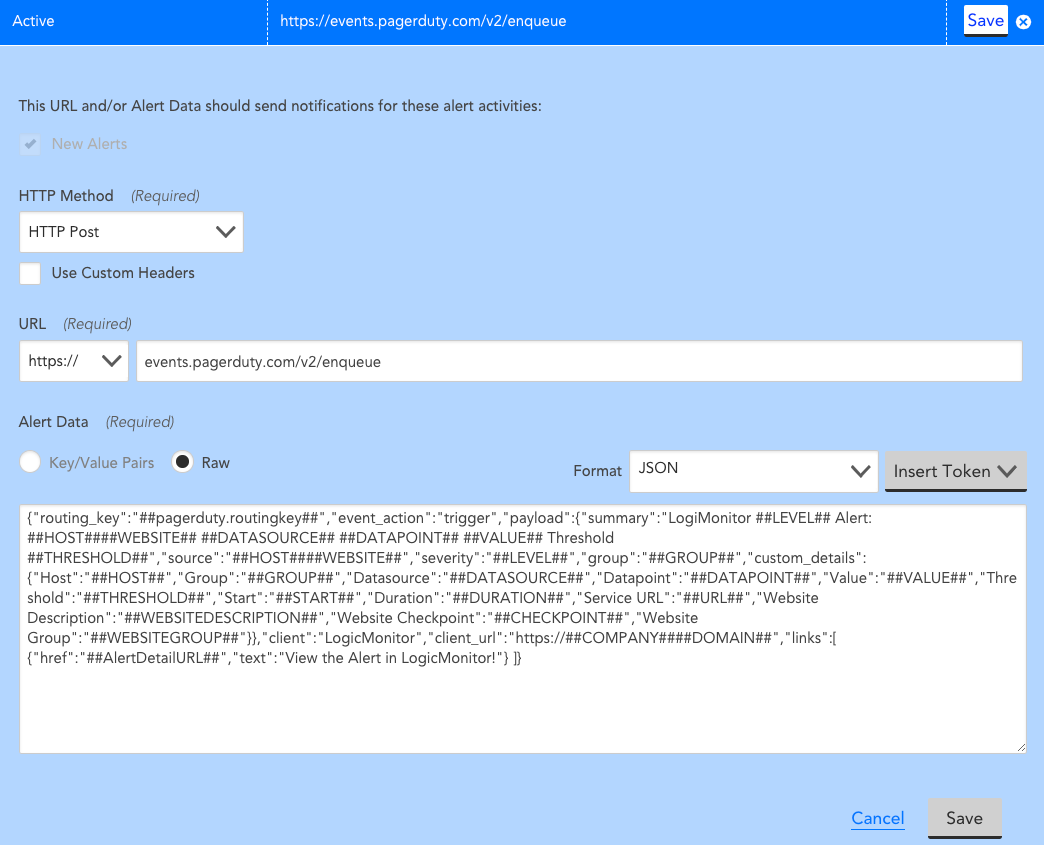
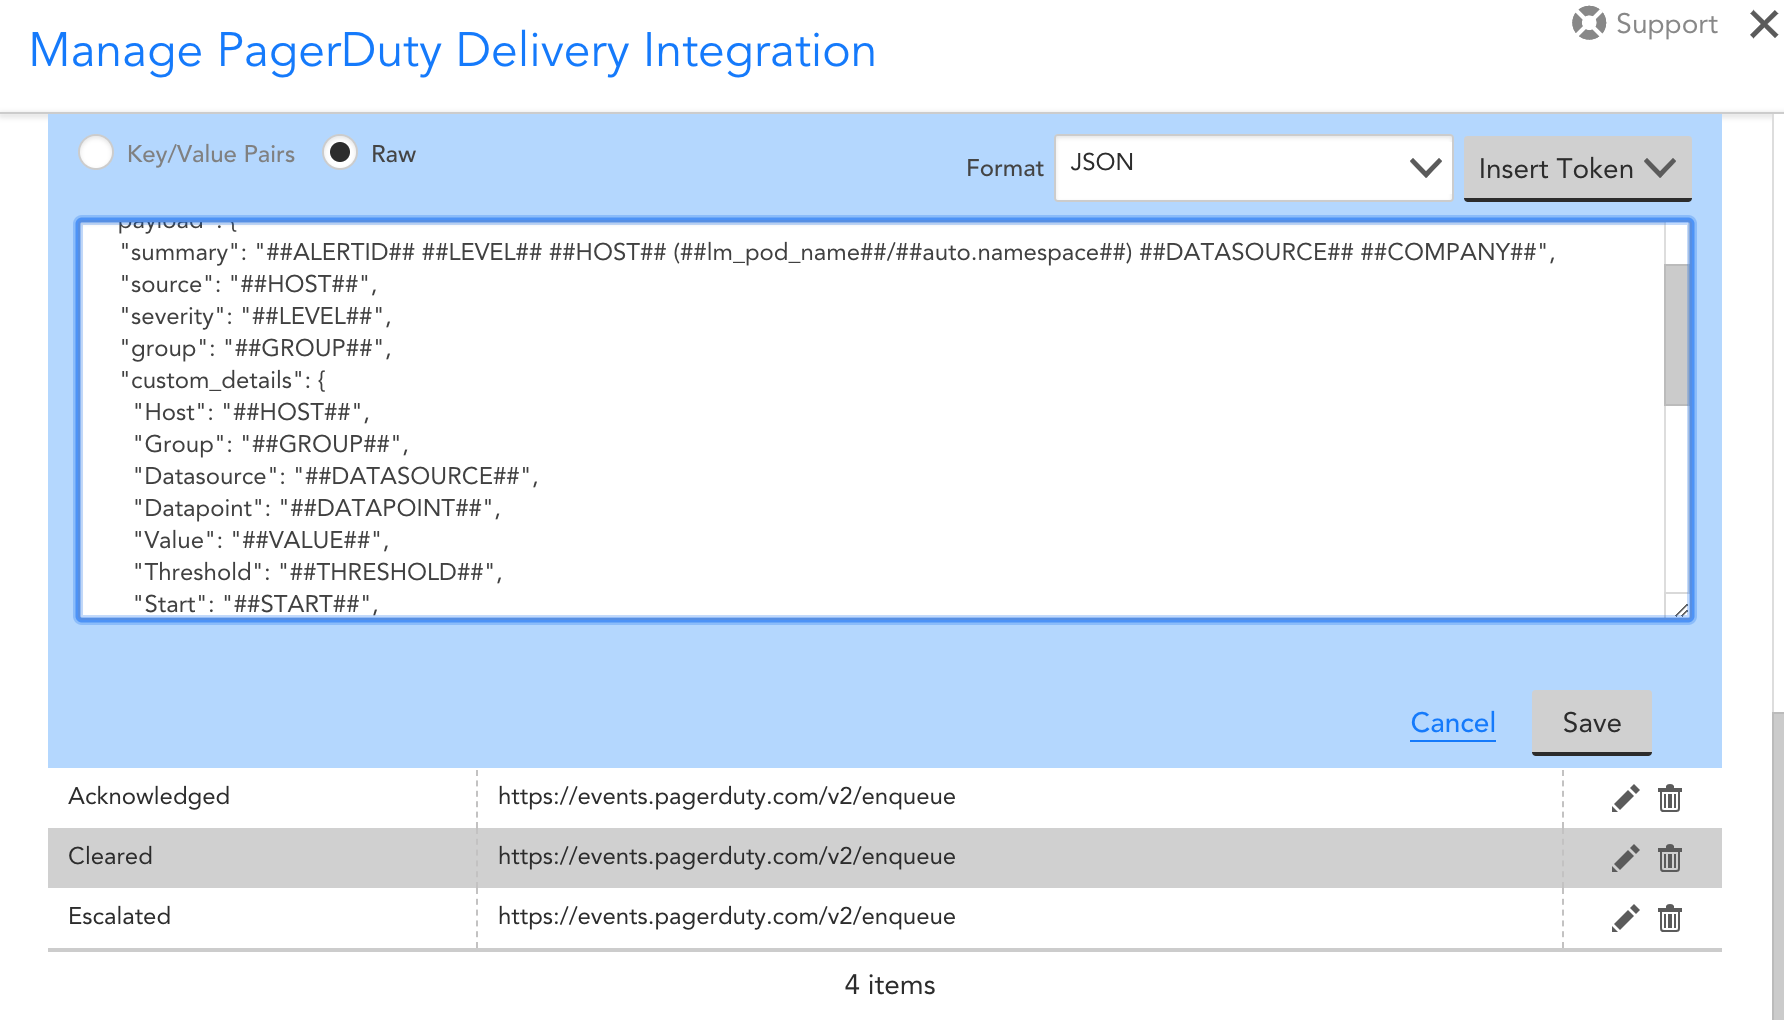
The default PagerDuty integration comes with standard message templates for your alerts. You can enhance your alert messages by editing the raw alert data by going to Settings, Integrations, and then selecting the PagerDuty integration. Here, you can edit all the different Alert statuses. When selecting the edit button, you can start adding tokens to any section of the alert (summary, description, etc.). Editing the summary section will impact the subject line of the alert and thus adding context at a glance.
With the default alerts, you receive the display name, LogicModule, DataSource, and datapoint. You are not limited to default message tokens; you can also add custom and AutoProperties to any of the alert sections. For example, if you have Kubernetes in your environment, you can utilize the AutoProperties to highlight the exact cluster, container or pod that is having issues. With these newly added tokens, the alerts will now resemble your native LogicMonitor alerts that you know and love. With this information readily available, your team can spend less time digging through the weeds for critical data and address the problem at a faster rate.
Calling for Backup
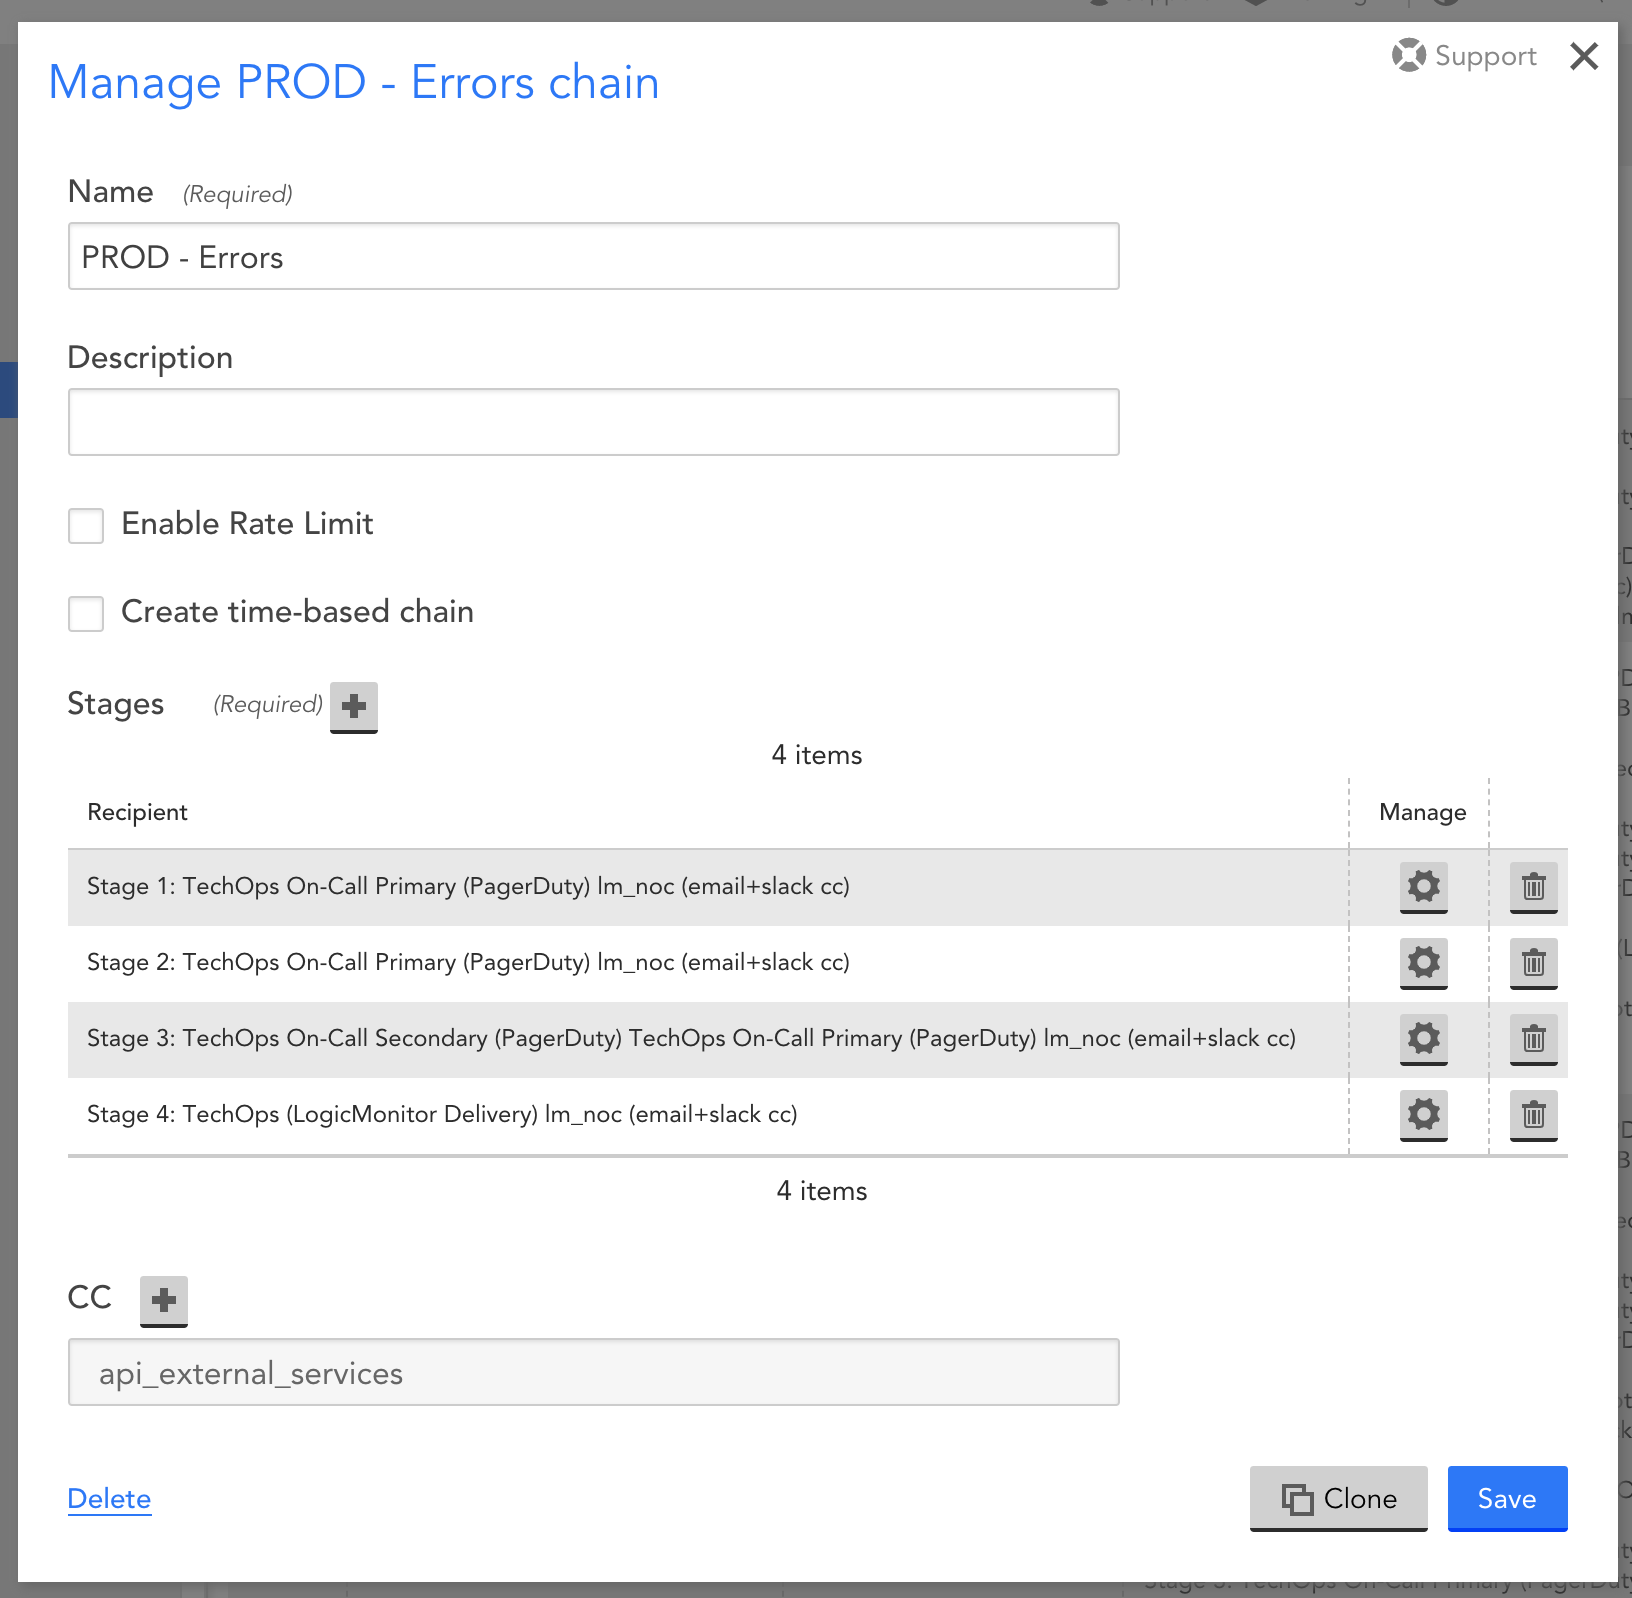
What happens if the integration is not responding? How can you make sure your team still gets notified in case something goes wrong in your environment? One way to solve this issue is by adding one final stage to your escalation chain. This stage should contain the critical person or group who needs to respond to the alert in case the endpoint is not working. Adding this failover stage guarantees that if there is no acknowledgment from the previous PagerDuty stages, then someone can be alerted via the native LogicMonitor alerting system. One step further? You can add the PagerDuty API endpoint as either a Device, Website check or both and the status page as an EventSource to your environment and monitor the health of it. Monitoring these types of dependencies can help you be more proactive and become aware of issues that could potentially affect alert notifications.
With these tips, you can have a more robust integration for your organization, and breathe a little easier knowing that no critical alert will go unnoticed. LogicMonitor and PagerDuty will be sponsoring KubeCon 2019. Come find us at booth #S62 and PagerDuty at booth #S65 to see the integration in action.
More about PagerDuty: In an always-on world, teams trust PagerDuty to help them deliver a perfect digital experience to their customers, every time. PagerDuty is the central nervous system for a company’s digital operations. PagerDuty identifies issues and opportunities in real-time and brings together the right people to respond to problems faster and prevent them in the future. From digital disruptors to Fortune 500 companies, over 12,000 businesses rely on PagerDuty to help them continually improve their digital operations—so their teams can spend less time reacting to incidents and more time building for the future.
Subscribe to our blog
Get articles like this delivered straight to your inbox


