In this article


IT Operations are more complex than ever, with modern data centers spanning on-premises, containers, multi-cloud environments, and AI-powered infrastructure. The rapid expansion of data sources has created an overwhelming volume of information, making manual monitoring across multiple tools impractical. Visibility gaps slow down troubleshooting and delay critical decisions, impacting business performance.
LogicMonitor’s latest innovations give IT teams the solutions they need to modernize their data center observability strategies and meet their business goals in the AI Era with expanded hybrid resource visibility, embedded troubleshooting workflows, and AI-driven insights. With reduced MTTR, cost savings, and greater efficiency, IT can enhance customer satisfaction, accelerate transformation, and rapidly implement AI initiatives.
Expanding Best-in-Class Hybrid Observability
LogicMonitor delivers comprehensive visibility across on-premises infrastructure and multi-cloud environments, providing IT teams with a unified approach to monitoring modern data centers.
Our latest hybrid visibility enhancements—rolling out in the coming months—enable deeper insight into how AI services, cloud costs, container visibility, and network monitoring interact. With this expanded coverage, IT teams can pinpoint inefficiencies, optimize system performance, and eliminate operational blind spots before they create problems.
Expanded Monitoring for AI Services
As AI adoption accelerates, IT teams require observability that can keep pace. LogicMonitor has expanded AI monitoring coverage to include Amazon Q Business and NVIDIA GPUs, complementing existing monitoring for Amazon Bedrock, Amazon SageMaker, and Microsoft Cognitive Services.
Monitoring Amazon Q Business provides IT and CloudOps teams with real-time visibility into AI-driven internal processes. By integrating directly with enterprise data sources, Amazon Q Business enables fast, secure information retrieval via a natural language chatbot. Ensuring these AI tools remain available and performant supports efficiency across business operations.
NVIDIA GPU monitoring extends visibility into AI infrastructure, tracking real-time performance, utilization, and hardware health. IT teams can proactively detect issues before they affect AI workloads, reducing downtime and improving model performance.
Enhanced Cost Optimization for AI-Driven Workloads
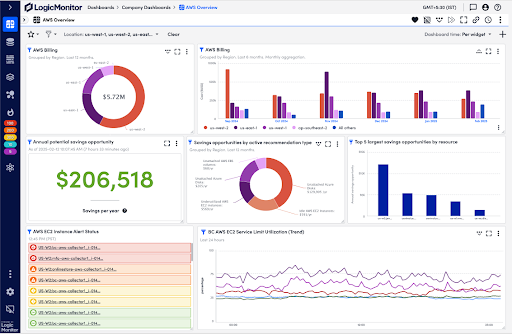
Since launching Cost Optimization in May 2024, LogicMonitor has helped IT teams integrate FinOps best practices, balancing cloud performance with operational costs. AI workloads demand significant computing power, making cost control even more essential.
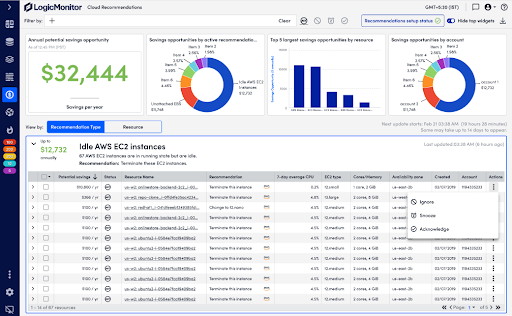
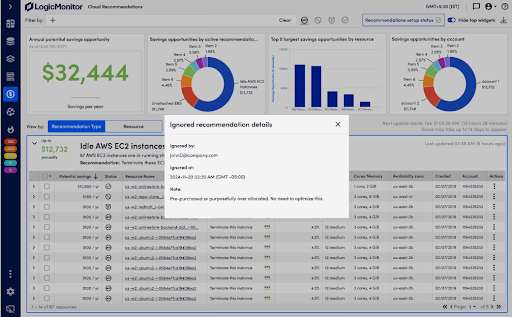
With new enhancements, teams gain deeper visibility into multi-cloud expenditures and can now view performance and cost data alongside AI-generated cost recommendations in a single view, so they can make informed decisions quickly, while AWS EC2 memory insights provide precise instance-sizing guidance for compute-intensive tasks. New tracking options allow users to manage cost recommendations more effectively by acknowledging, snoozing, or dismissing them based on relevance. Teams can also add notes to recommendations, improving collaboration and tracking decision rationale.
 Optimize costs without compromising performance
Simplifying Kubernetes Observability
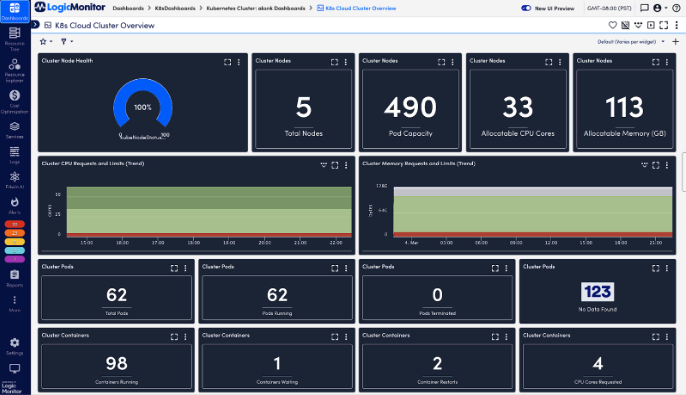
Kubernetes environments are dynamic, spanning hybrid cloud architectures and scaling rapidly. Maintaining real-time visibility into cluster health, resource usage, and performance anomalies has been a persistent challenge for IT teams.
LogicMonitor now includes automated discovery and monitoring for Amazon EKS and Azure AKS clusters, simplifying Kubernetes observability. These enhancements allow IT teams to track real-time changes, detect anomalies, and resolve issues before they disrupt performance. Logs and alerts are embedded within the monitoring environment, streamlining troubleshooting and reducing time spent diagnosing problems.
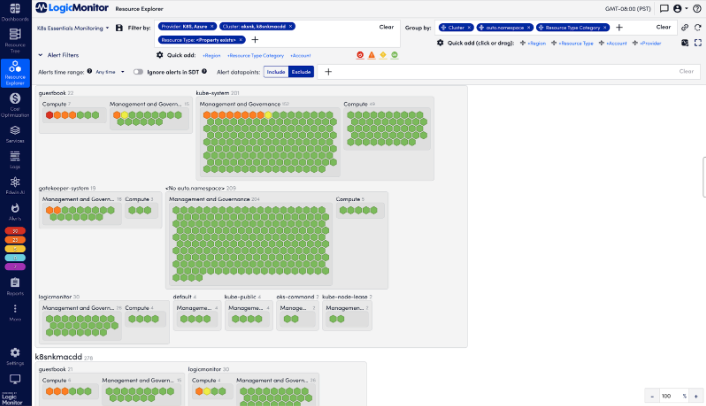 Monitor containers with confidence and scale
Advancing Network Monitoring for Cloud-Managed Devices
As network device manufacturers move management to the cloud, IT teams need observability solutions that support hybrid network environments. LogicMonitor has expanded monitoring capabilities to include Cisco Meraki and HPE Aruba Networking, ensuring IT teams can track performance across multi-vendor network environments.
This update provides a unified monitoring experience, allowing teams to oversee wired and wireless network infrastructure from a single platform. IT teams can quickly detect connectivity issues and optimize network performance across distributed environments, even as device management shifts to the cloud.
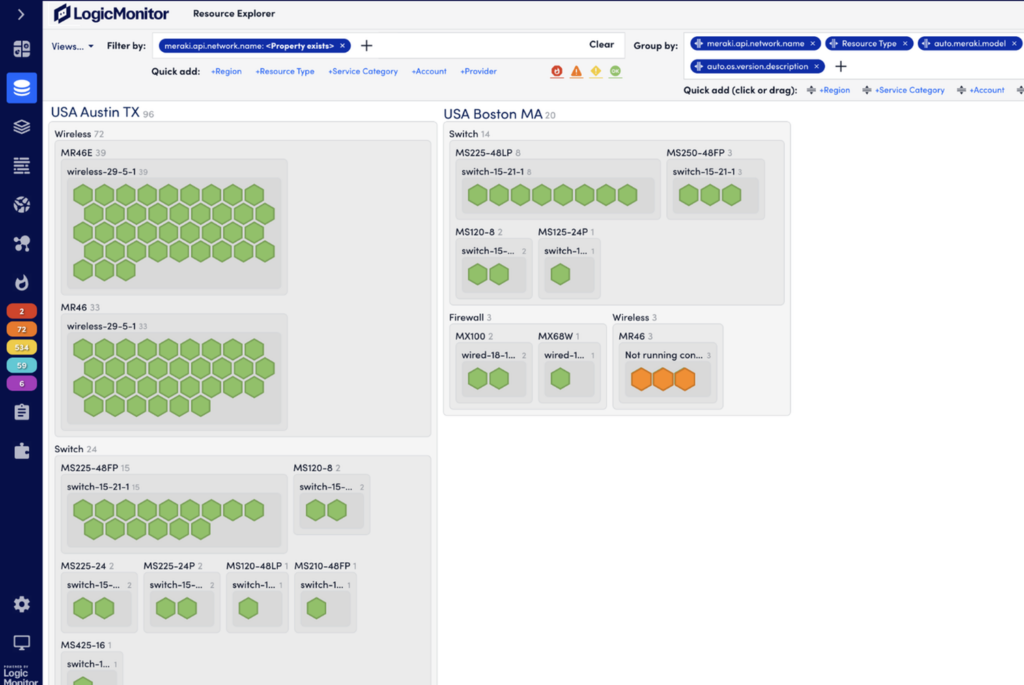 Gain full control of your network performance
Accelerating Troubleshooting with Logs
When troubleshooting IT incidents, teams lose time manually correlating logs, alerts, and performance metrics across multiple tools. LogicMonitor now embeds logs within the monitoring workflow, automatically associating them with relevant alerts and metrics for faster root cause analysis.
Recent and upcoming enhancements include:
- Query Sharing Library: Teams can save and share log queries, reducing redundant work and improving efficiency
- Enhanced Log Visualizations: New interactive charts and dashboards provide at-a-glance insights
- Log Metricization: Log data can now be converted into actionable metrics, making tracking trends and setting alerts easier
- Automated Windows Log Ingestion: Upcoming releases will enable seamless collection of Windows event logs
- Custom Log Partitions: IT teams can define retention policies based on compliance and operational requirements
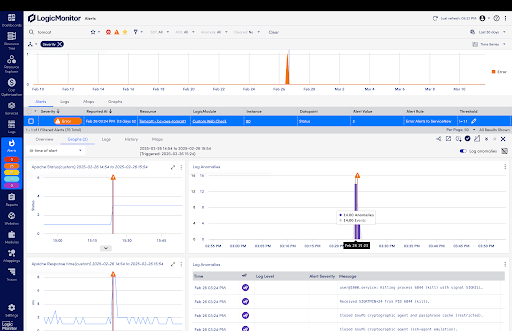

no queries or training needed. Prioritize and
resolve critical issues faster.
 Stay ahead with smarter log management
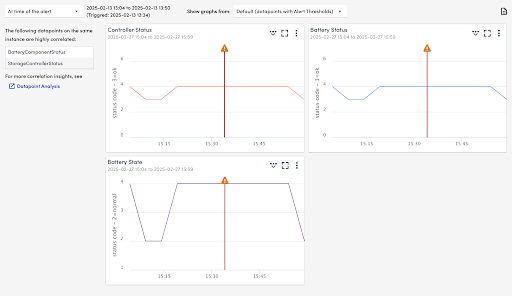
Optimizing Insights and Resolution with GenAI Agent
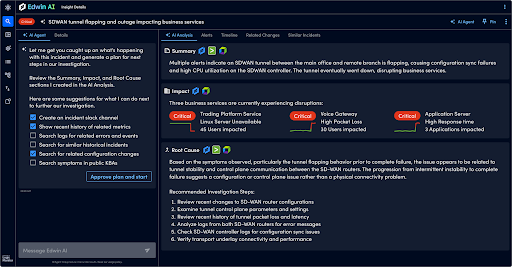
Incident response often stalls when data is fragmented across multiple tools. Every minute between detection and resolution is critical. Edwin AI, LogicMonitor’s GenAI-powered agent, eliminates these inefficiencies by automating troubleshooting and prioritizing critical alerts.
New integrations expand Edwin AI’s capabilities:
- Observability Integrations: Connects with Dynatrace, SolarWinds, and AppDynamics for a comprehensive view of incidents
- ITSM Integrations: Streamlines incident management with Jira ITSM, PagerDuty, and Microsoft Dynamics
Enhanced event intelligence helps IT teams move beyond basic alerting by recognizing patterns across historical incidents. The redesigned interface includes computational widgets, saved filters, and structured event details, making issue identification and resolution faster. AI-driven recommendations provide context-aware remediation steps based on past incidents, giving IT teams the confidence to act quickly.
 See how data transforms into action
Evolving IT Operations with Hybrid Observability Powered by AI
From AI-powered monitoring and cost optimization to GenAI-driven event intelligence, LogicMonitor equips IT teams with the capabilities to operate efficiently and proactively. These innovations reduce complexity, improve decision-making, and help IT teams deliver measurable business impact.
Connect with your Customer Success Representative or visit the LM Community to see our platform in action.


Subscribe to our blog
Get articles like this delivered straight to your inbox