In this article


Amazon Managed Streaming for Kafka (MSK) is an AWS service that helps build and run applications built on Apache Kafka. Kafka is a platform designed to handle continuous streams of small records or events generated from a large number of devices and applications.
In order to ensure your Kafka environment is running efficiently, it is important to adequately monitor it at both the cluster and broker level. This helps you identify performance bottlenecks, determine when it is necessary to scale your applications, and prove that they are successfully streaming messages through Kafka at low latency.
We expanded our monitoring coverage to include support for AWS MSK, and provide two DataSources to collect and alert on broker and cluster metrics. After adding your AWS environment and enabling the new services, import our newest DataSources to begin monitoring. Clusters and brokers will be automatically discovered and grouped together for easier management.
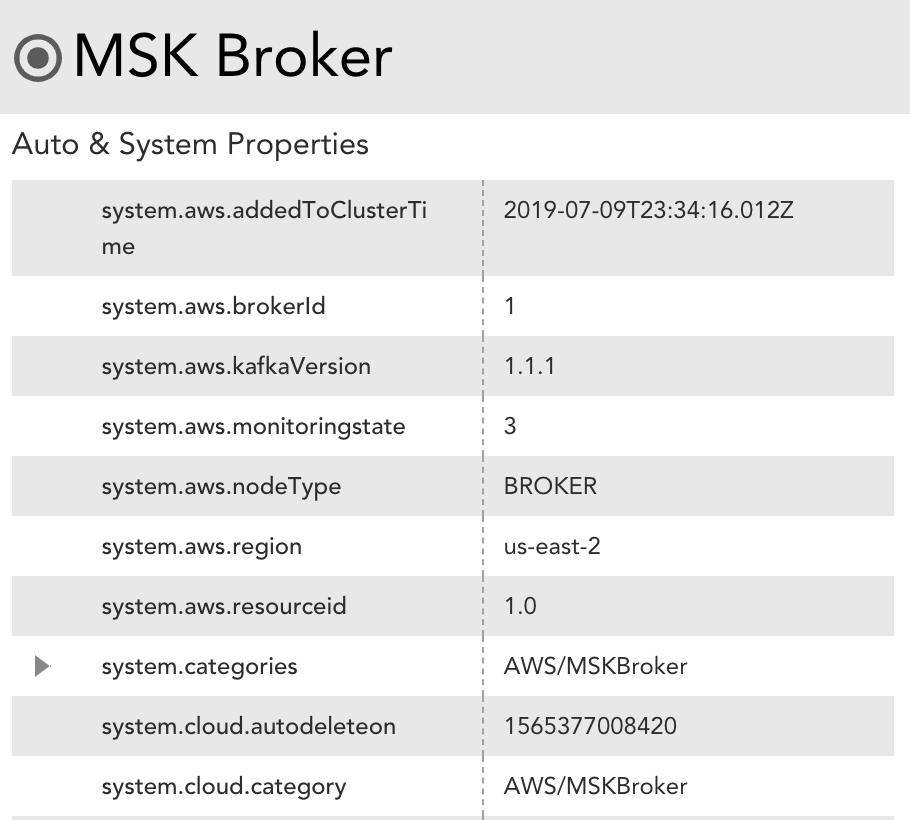
Additionally, both clusters and brokers will receive useful auto-properties such as broker identifier, node type, and Kafka version.
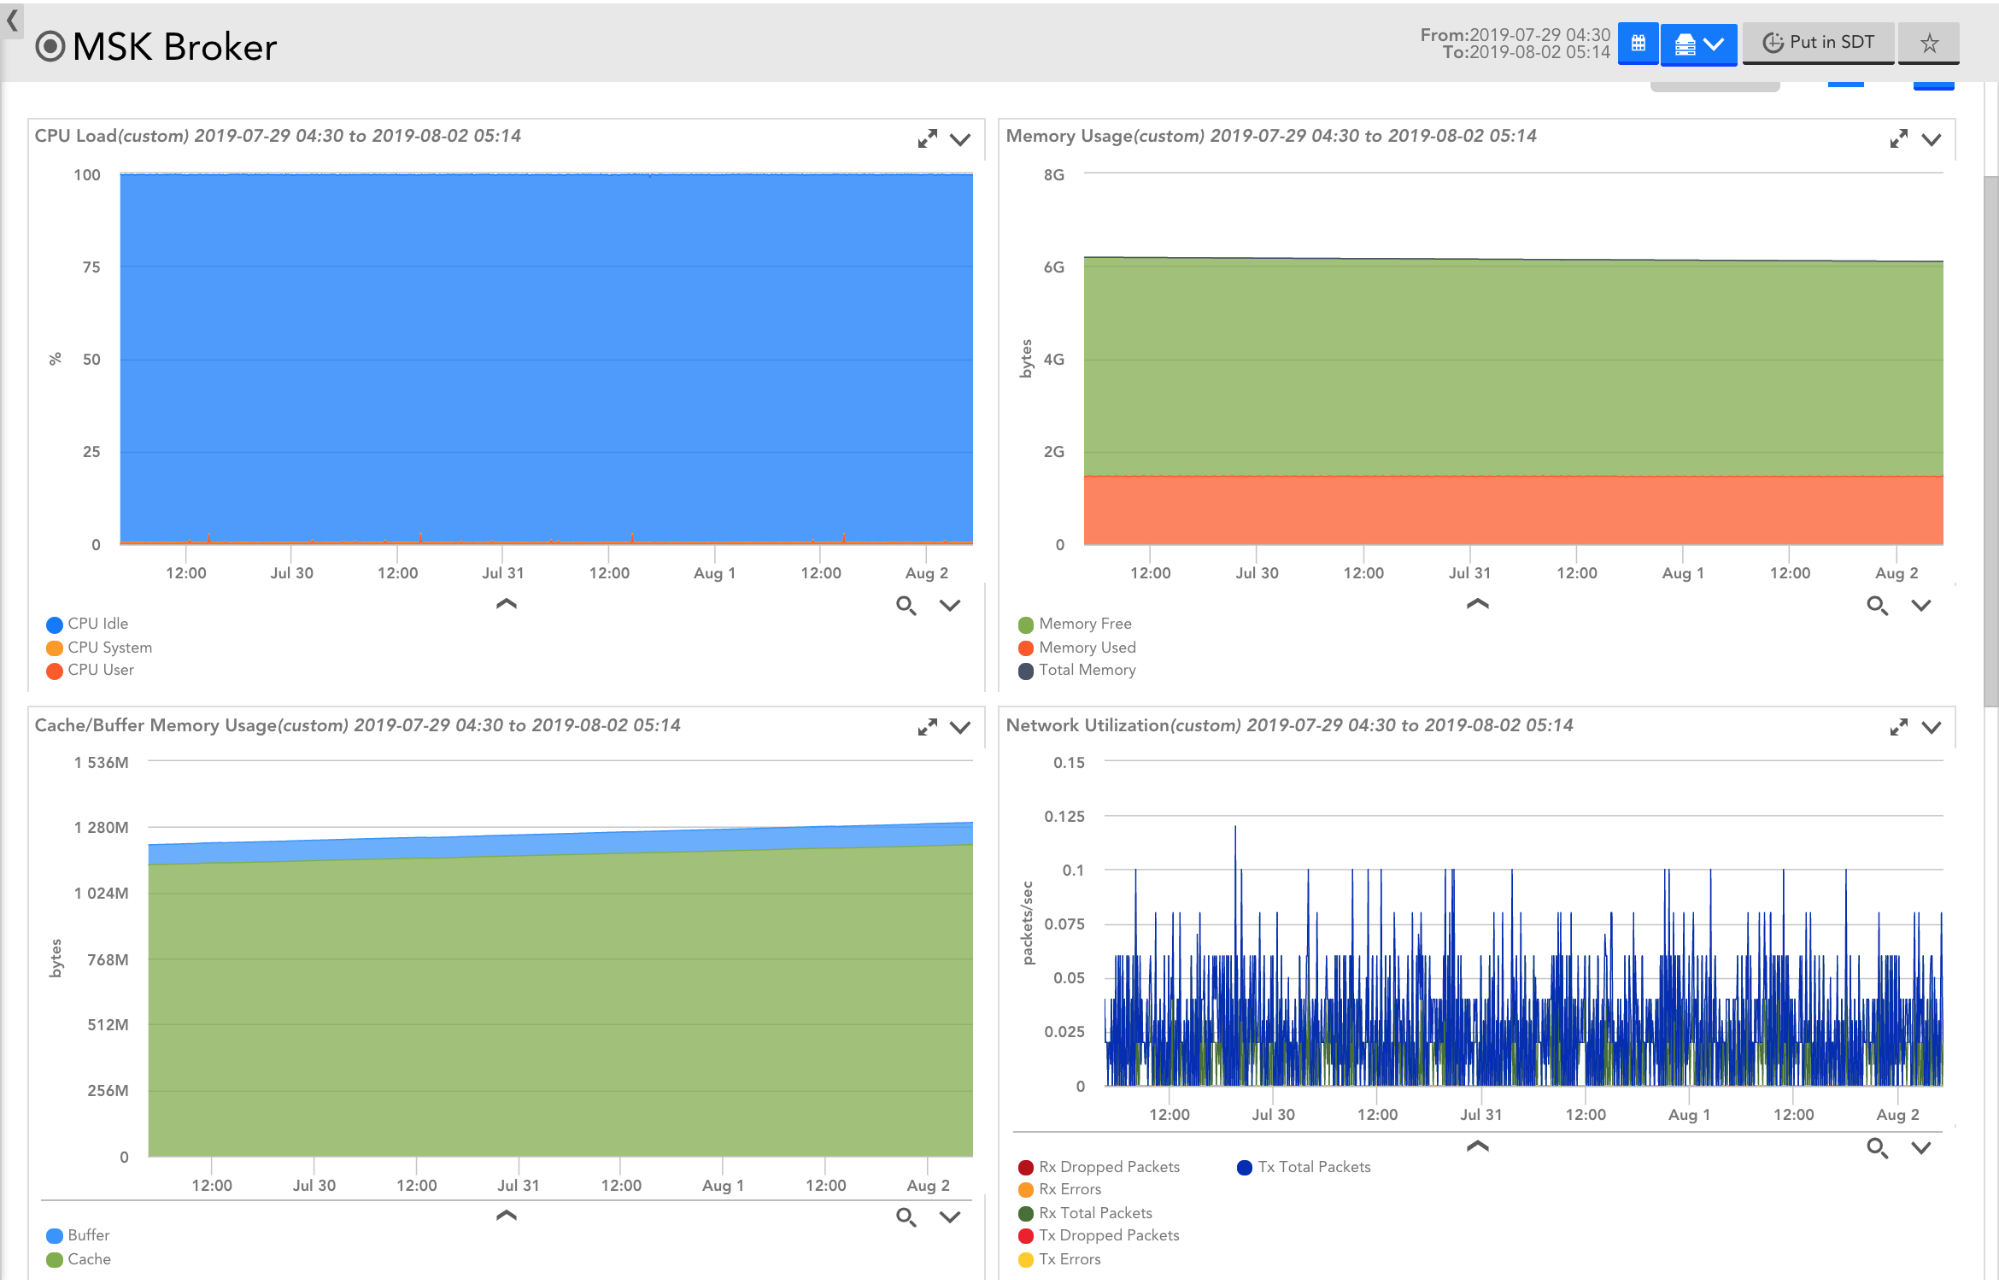
Using the Cloudwatch API, LogicMonitor polls directly from AWS and begins populating useful Kafka datapoints, such as controller count, partition count, disk used, and network traffic. Default alert thresholds provide advanced notification when potential issues are detected. As a best practice, we recommend keeping tabs on the following:
- Root Disk Used: This is a measurement of the percentage of the root disk used by a broker. It’s important to monitor the amount of free disk space available, because a full disk may cause interruptions to the Kafka service. By default, we include a threshold to alert when the space remaining reaches 5% or less.
- Active Controller Count: Only one controller per cluster should be active. A threshold is set to alert when more than one active controller is present within a cluster for an extended period of time.
- Offline Partitions Count: This measures the total number of partitions that are offline in the cluster. If partitions go offline, this may indicate the need to increase partition replication. This could also expose a need to scale up the broker count as well if fetches aren’t keeping up.
With LogicMonitor’s AWS MSK monitoring, you can collect, visualize, and alert on data from your cloud Kafka infrastructure alongside the rest of your hybrid infrastructure within a single pane of glass. Sign up for a free trial today!


Subscribe to our blog
Get articles like this delivered straight to your inbox