At the heart of LogicMonitor’s monitoring solution is the LogicMonitor Collector, a crucial application that gathers device data and sends it to the LogicMonitor platform. This real-time monitoring feature tracks the health and performance of Collectors and ensures continuous data collection by sending alerts about potential issues before they escalate. When issues arise, understanding the Collector Status is key to quickly resolving them.
This guide walks through steps for troubleshooting issues related to the Collector Status, ensuring that the monitoring setup remains reliable and effective.
Key takeaways


What is Collector Status?
Collector Status provides real-time insights into the health and performance of LogicMonitor Collectors. It tracks essential metrics such as CPU load, memory usage, and network connectivity, sending notifications to users about potential issues before they escalate into major problems. Regular monitoring of the Collector Status prevents downtime, optimizes performance, ensures continuous data collection, and gives the ability to personalize solutions.
Collector Status is the first line of defense in identifying and solving monitoring issues.
Ensuring a Healthy Collector Status: Key Troubleshooting Steps
Step 1: Check the Collector and Watchdog services
The first step in troubleshooting is to validate that the LogicMonitor Collector and Watchdog services are running properly on the host machine. These services are essential for maintaining communication between devices and the LogicMonitor platform. If either service is down, the status of the Collector will reflect this, and gaps in monitoring data may become apparent.
- Action: Verify that both services are active by checking the status on the host machine. If they are not running, attempt to restart them. If the services fail to start, investigate further by checking operating system logs or updating the services.
Learn more about troubleshooting and managing Collector services.
Step 2: Verify credentials and permissions
Incorrect credentials or insufficient permissions can cause the Collector to fail to communicate with your monitored devices, which will be reflected in the Collector Status. This is a common issue, particularly in Windows environments.
- Action: Ensure that the credentials the Collector and Watchdog services use have the correct permissions. The Collector service should have “Log on as a service” rights under the Local Policy/User Rights Assignment settings in the host OS. If not using an account on the same domain, ensure the local administrator credentials are correct by verifying wmi.user and wmi.password properties in LogicMonitor. This will help maintain a healthy Collector Status.
Step 3: Check the Collector connection to LogicMonitor servers
A common reason for a degraded Collector Status is connectivity issues. The LogicMonitor Collector needs to connect to LogicMonitor’s cloud servers over port 443 using HTTPS/TLS. If this connection is interrupted, the Collector cannot send data, and monitoring will be disrupted.
- Action: Test the connectivity from the Collector host to LogicMonitor’s cloud servers. Do this by accessing the LogicMonitor portal from a web browser on the Collector host. Ensure that firewall rules and whitelists (if using IP address whitelisting instead of DNS) are up to date to allow traffic over port 443. I
Get detailed instructions on monitoring Collector connectivity and health.
Understanding how the Collector communicates with LogicMonitor is key to resolving downtime quickly.
Step 4: Review antivirus software settings
Antivirus software can sometimes interfere with the Collector’s operation by blocking necessary files or processes. This can lead to a poor Collector Status as the Collector may not be able to perform its functions correctly.
- Action: Check antivirus software settings and ensure the LogicMonitor directory is added as an exclusion (C:\Program Files (x86)\LogicMonitor\ by default). This will prevent the antivirus from blocking the Collector’s operations, helping to maintain a positive Collector Status.
Step 5: Monitor Collector health with Collector Status
The Collector Status in LogicMonitor is the primary tool for monitoring the health and performance of Collectors. Regularly reviewing the Collector Status can help to identify potential issues, such as high CPU load, memory overuse, or connectivity problems, before they lead to downtime.
- Action: Regularly check the Collector Status in the LogicMonitor portal. Look for any warning or error messages related to load, memory, or failed polls, and address them promptly to keep monitoring infrastructure running smoothly.
Explore LogicMonitor’s guide to best practices for optimizing Collector performance.
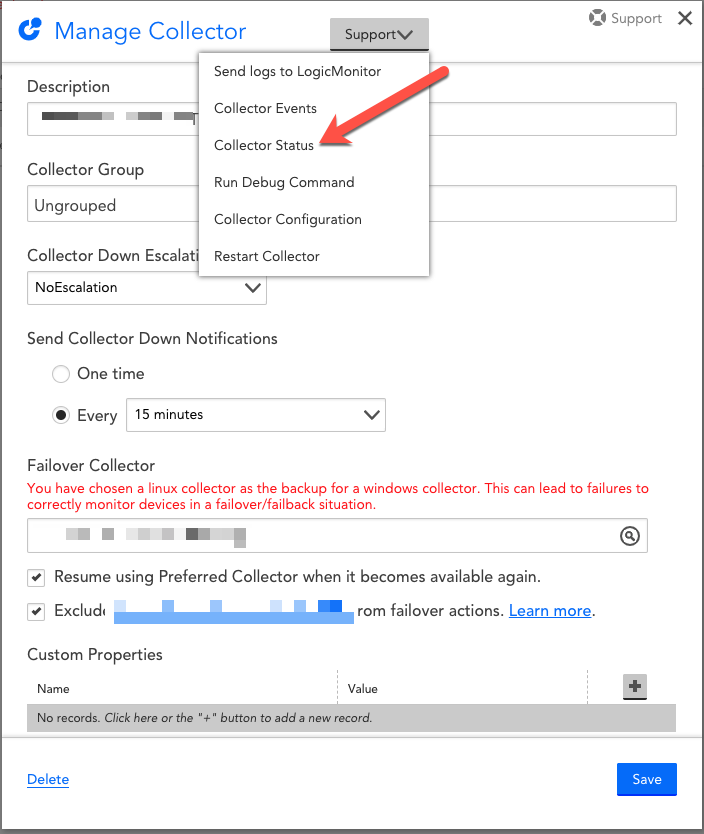
Collector Status is a great place to check on Collector health. It can indicate potentially problematic load issues and LogicModules with abnormally high numbers of failed polls.
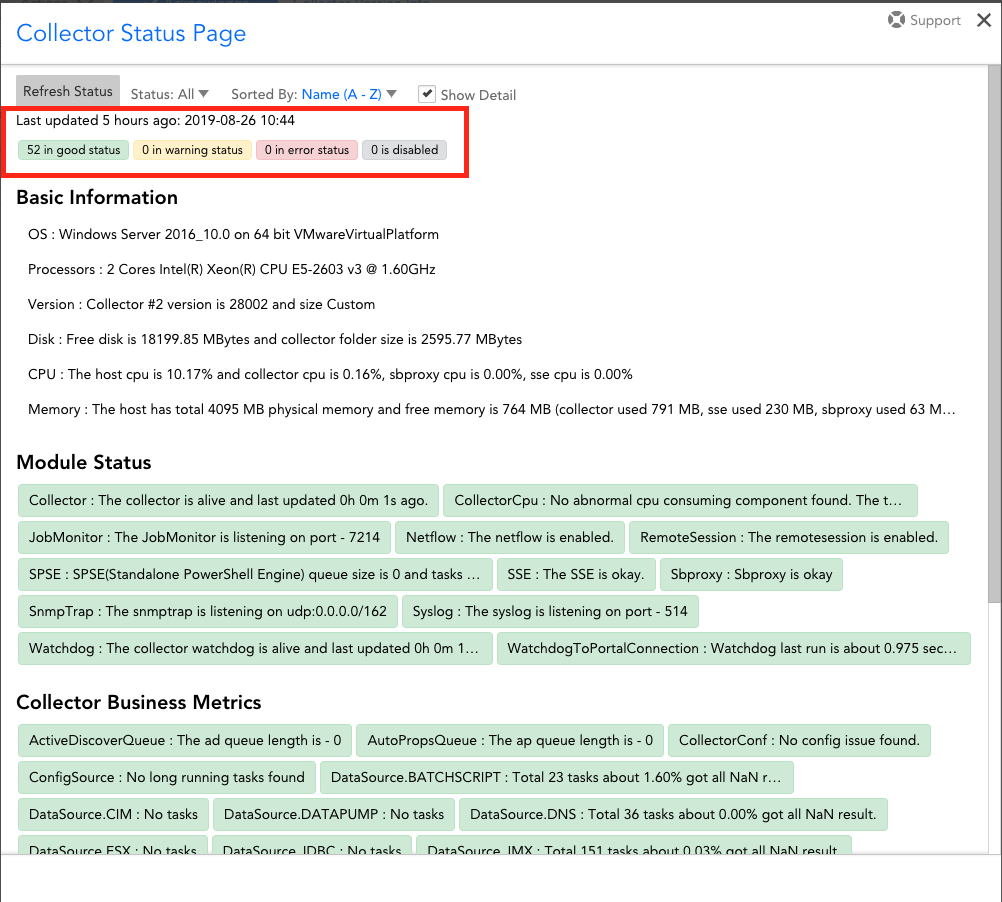
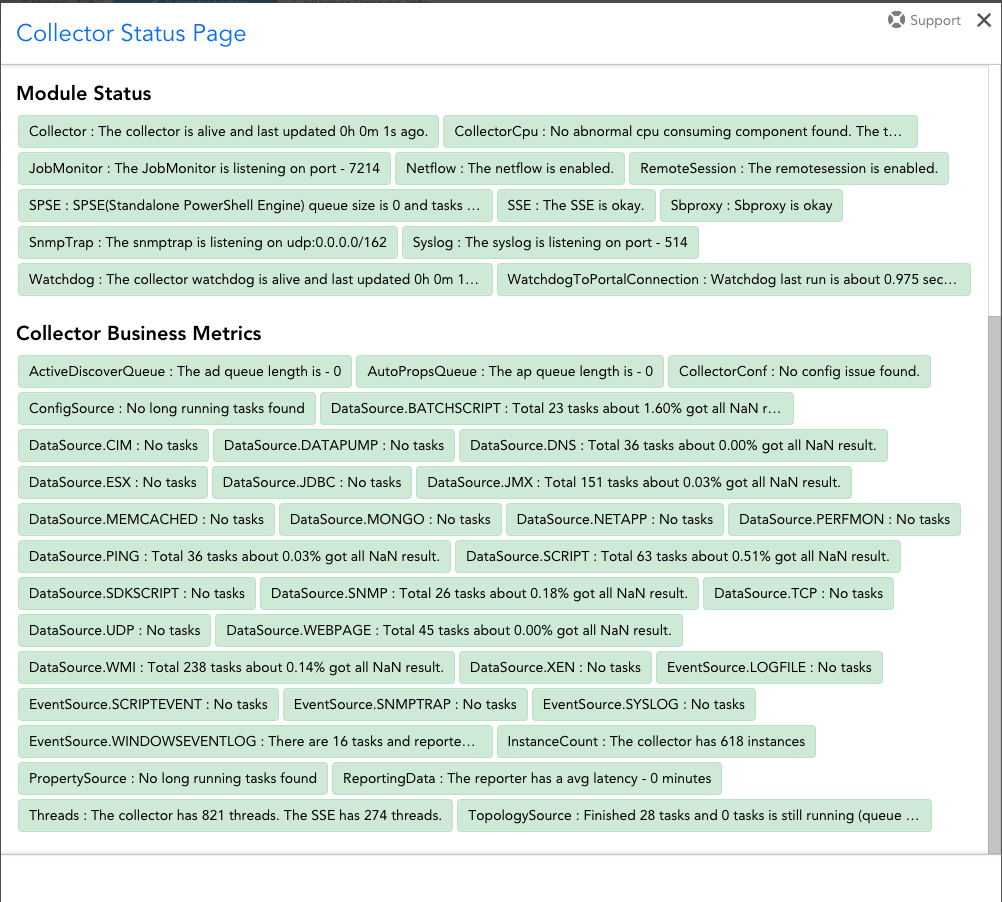
Collector Status is not intended to provide a complete view of Collector performance but is an excellent tool for quickly identifying the source of issues. It offers several features that help IT teams quickly pinpoint problems and get an overview of a Collector’s overall health:
- Highlighted issues: Instantly find issues that point to an area of concern that may impact the Collector’s health.
- Configuration check: Find potential issues with Collector configuration that may impact performance.
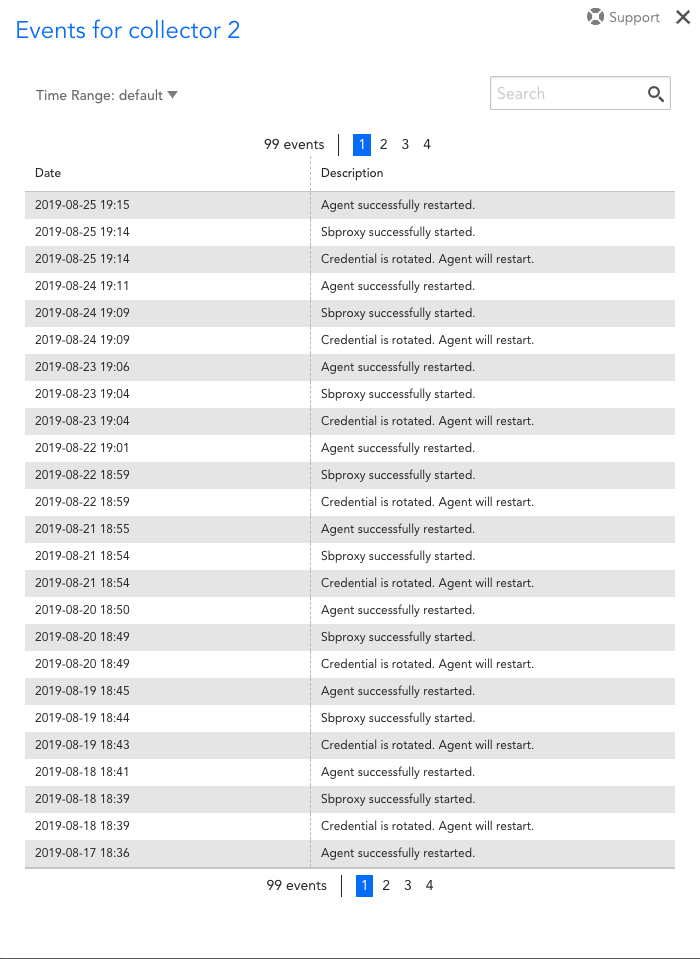
The Collector also tracks restarts and errors reported by Watchdog, which is very useful when looking for patterns that indicate problems.
Step 6: Set up resilient monitoring
To further protect the monitoring setup, consider implementing resilient monitoring strategies. This includes setting up a backup Collector or using an Auto-Balanced Collector Group to distribute the monitoring load across multiple Collectors. This helps maintain a healthy Collector Status and ensures that monitoring continues without interruption, even if one Collector goes down.
- Action: Evaluate the current monitoring setup and determine if adding a backup Collector or implementing Auto-Balanced Collector Groups would benefit the environment. These steps can significantly reduce the risk of downtime and improve your overall monitoring resilience.
LogicMonitor’s article, Collector Capacity, offers a broader understanding of how Collectors handle workloads.
Maintain a healthy Collector Status
Understanding and regularly checking the Collector Status ensures that LogicMonitor Collectors are performing optimally and providing continuous and reliable monitoring for IT infrastructures. Implementing the steps outlined in this troubleshooting guide can help resolve issues that arise and guide the setup of a resilient monitoring system that protects against future problems.
Subscribe to our blog
Get articles like this delivered straight to your inbox


