Observability 101: a chat with Jude Bakeer

LogicMonitor + Catchpoint: Enter the New Era of Autonomous IT

Proactively manage modern hybrid environments with predictive insights, intelligent automation, and full-stack observability.
Explore solutionsExplore our resource library for IT pros. Get expert guides, observability strategies, and real-world insights to power smarter, AI-driven operations.
Explore resources
Our observability platform proactively delivers the insights and automation CIOs need to accelerate innovation.
About LogicMonitor
We recently sat down with Jude Bakeer, one of LogicMonitor’s Solutions Engineers, to talk about the future of IT and Observability. Part of Jude’s role requires her to talk to customers and enterprises every day. Over the years, she’s gathered unparalleled insights into key trends across these industries and segments – from ops teams to C-level executives. In her day-to-day experiences, Jude sees Observability up close and personal and uses feedback from customers and prospects to continuously improve.
While Jude didn’t have a crystal ball on hand, we did get into what her current ecosystem looks like and what we can expect moving forward into a hybrid world. Jude gave us a look into the market as she sees it, along with what she thinks could be the roadmap for a better future.
LogicMonitor: Thanks for joining us today. So Jude, what’s on your mind regarding the state of IT today?
Jude Bakeer: There are so many buzzwords right now: “online presence” (thanks COVID), more “sophisticated workflows,” “modernization,” “cloud-native,” “ephemeral,” “containerization,” “ITOM,” “synergy,” etc. But I’d boil it down to a single word: “change.” IT is like shifting water; if you embrace the changes, you’ll flow right along. What we thought was impossible just five years ago is now our everyday. Having an open mind to the continual evolution happening around us is critical. And right now, that big shift is Observability.
LM: So what exactly is Observability, and how do you achieve it?
JB: The IT landscape is built on various technologies and vendors. But things change. Teams adopt new processes or tech, and it’s out with the old and in with the new. Observability gives us a method for finding the answers to our questions. Observability measures how well internal states of a system can be inferred from knowledge of its external outputs – technological, mechanical, anatomical, or something else entirely.
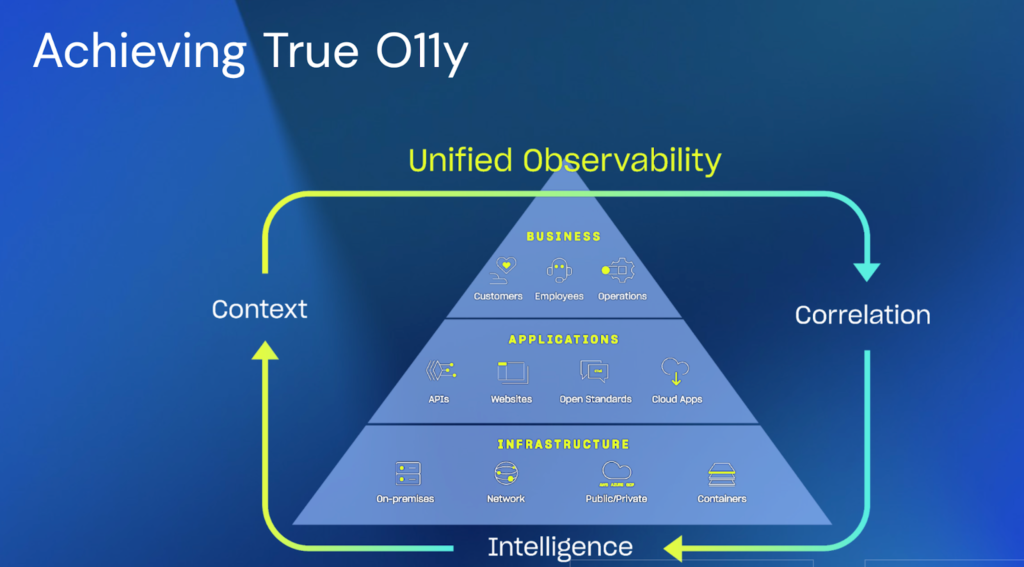
To observe the performance of our IT environments appropriately, we’ll need answers that span across these layers. Those answers are delivered through data that we can correlate, process, and contextualize. We’re taking what’s displayed outwards to determine what’s internally happening.
Why’s this important? We make better decisions when we have good data. Full-stack Observability is the KEY to gaining control and visibility of systems as the landscape evolves.
LM: What do you mean by “full stack” Observability?
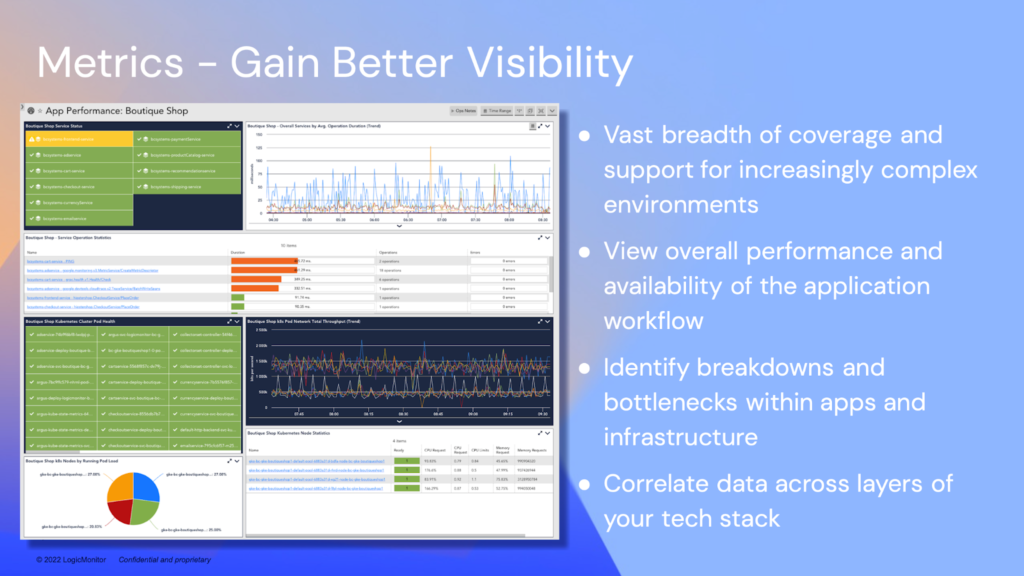
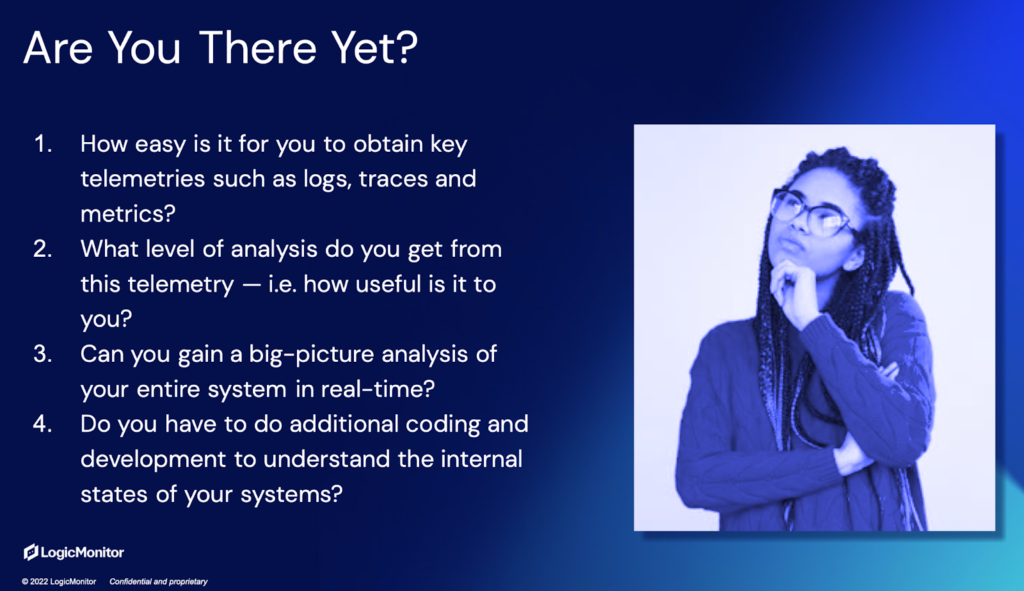
JB: There are three main types of data required for this view: metrics, traces, and logs.
Some metrics involve tracking CPU, memory, and disk performance. This helps make decisions regarding processor speed or RAM, but modern-day DevOps need access to other metrics. Through application performance monitoring (APM), metrics like page load times and error rates can be incorporated for maximum Observability.
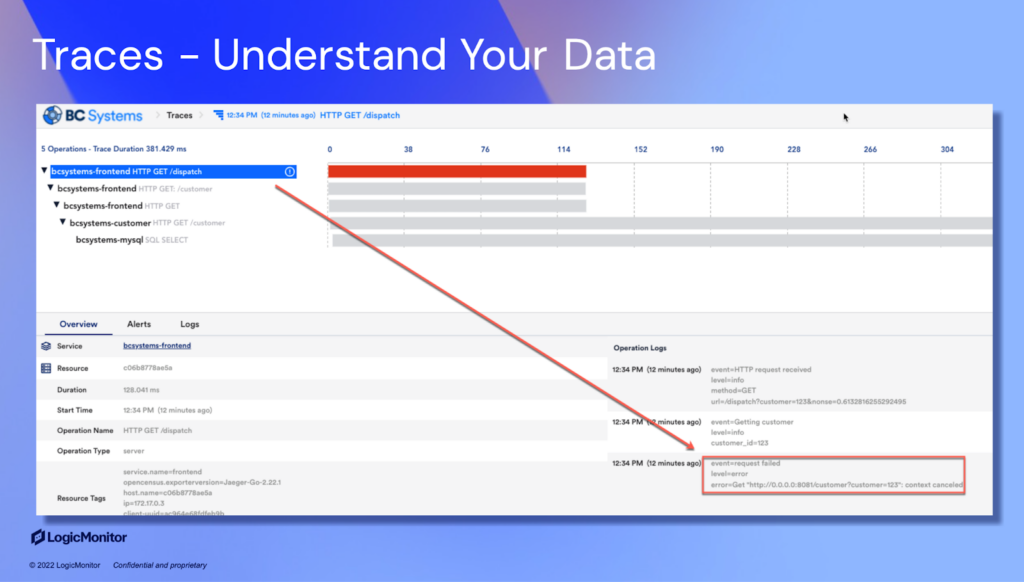
Next, we’ve got Traces. A trace paints a clear picture of individual events within the system (known as spans) but also showcases the interactions between parent and child cases.
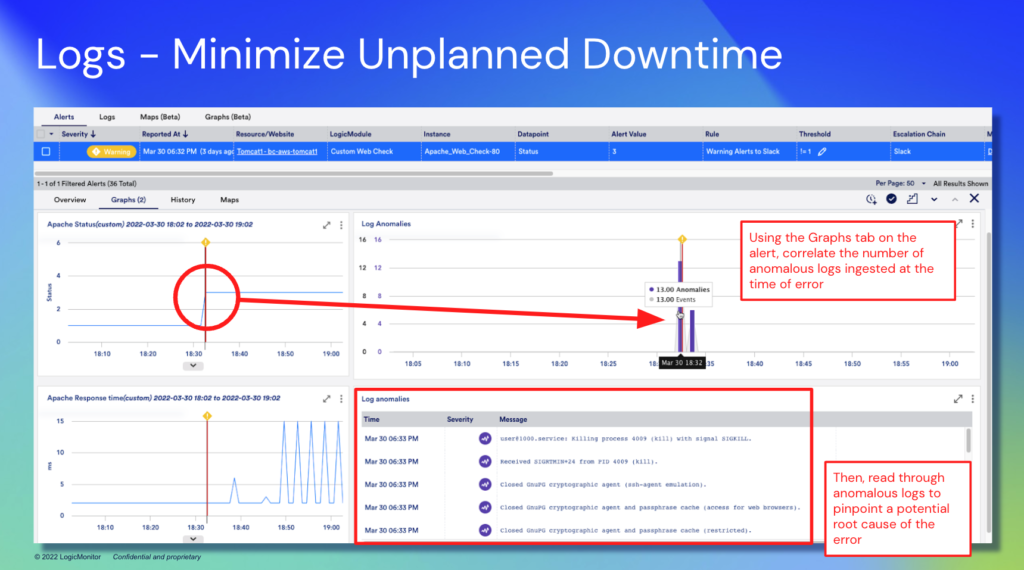
And finally, we’ve got the logs (flat log files), which can be generated through programming languages and framework libraries based on the running code. By aggregating these logs, you can send and store them to be accessed later, saving time and making the use of logs more effective for debugging.
LM: Great explanation. So how can businesses get started with Observability? What’s your advice?
JB: Plan accordingly. Navigating the ever-changing infrastructure landscape, answering questions, and being confident in your ability to provide insight through Observability will make your team leaner and meaner. Here’s a good outline to follow:
LM: What are some challenges that might make businesses turn to an Observability solution?
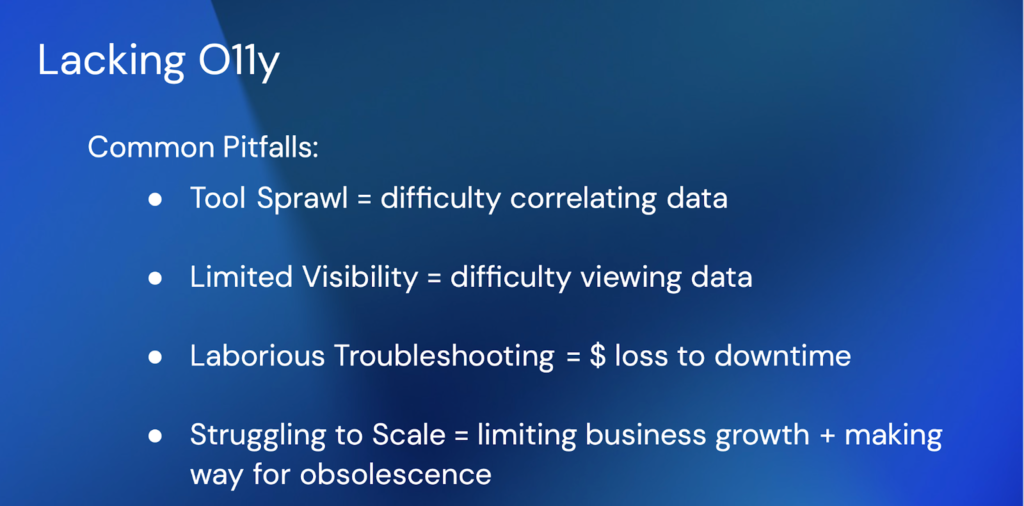
JB: It all comes down to not having the right monitoring tools or platform for your teams to achieve Observability. Achieving an actual state of Observability means that we must avoid common pitfalls when s*** hits the fan. Things like tool sprawl, I’m talking swivel-chair, emailing multiple teams, waiting on responses, writing and re-writing emails because of miscommunication, and then running the right reports on components contributing to an application’s health. And then there’s limited visibility – even if we’ve got the data for the reports! It boils down to asking: do we have the ingredients to bake this cake, or do we gamble on a substitution?
How long is it taking to get answers from the multiple tools and the half-built reports? When something takes time like that, it means we’re losing money. And then there’s struggling to scale, which keeps businesses limited to legacy technologies, and everything is stuck in the same gear.
LM: What is the main thing you advocate for in terms of Observability?
JB: Even some of the most advanced monitoring tools still provide a limited view of an app or software’s overall health and functionality. This is often because data can be inaccurate, or the data collected may be irrelevant. Observability offers improved visibility so that developers and businesses can make well-informed decisions. A traditional monitoring tool may show an error on an event log. You’d be made aware that there was an error, but there would be little information about why this error occurred. With Observability, you’d receive information from the event log along with metrics and traces that would point you in the direction of “why.” This allows DevOps or ITOps teams to better understand a system and prevent similar situations.
LM: Be predictive when you can.
JB: Exactly! When Observability is in place, developers experience less stress. They can identify any issues in real-time, focusing on fixing them instead of wasting countless hours identifying a problem. The result is less unplanned downtime. This enhances customer satisfaction and boosts the overall quality of an app or system.
When software development and IT operation teams work with observable systems, they spend less time troubleshooting and remedying hang-ups. This enables them to focus on UX, which leads to a more profitable and streamlined app or software. Organizations that adopt agile environments and prioritize Observability are in a prime position for effective scaling. An observable system allows a company to operate more without sacrificing security.
LM: This is great. Thanks so much. So where can I go to learn more?
JB: Thanks for having me! It has been a great chat. If you’re curious to learn more about Observability or my thoughts on the industry, let’s connect. You can follow me on Linkedin here.
© LogicMonitor 2026 | All rights reserved. | All trademarks, trade names, service marks, and logos referenced herein belong to their respective companies.
