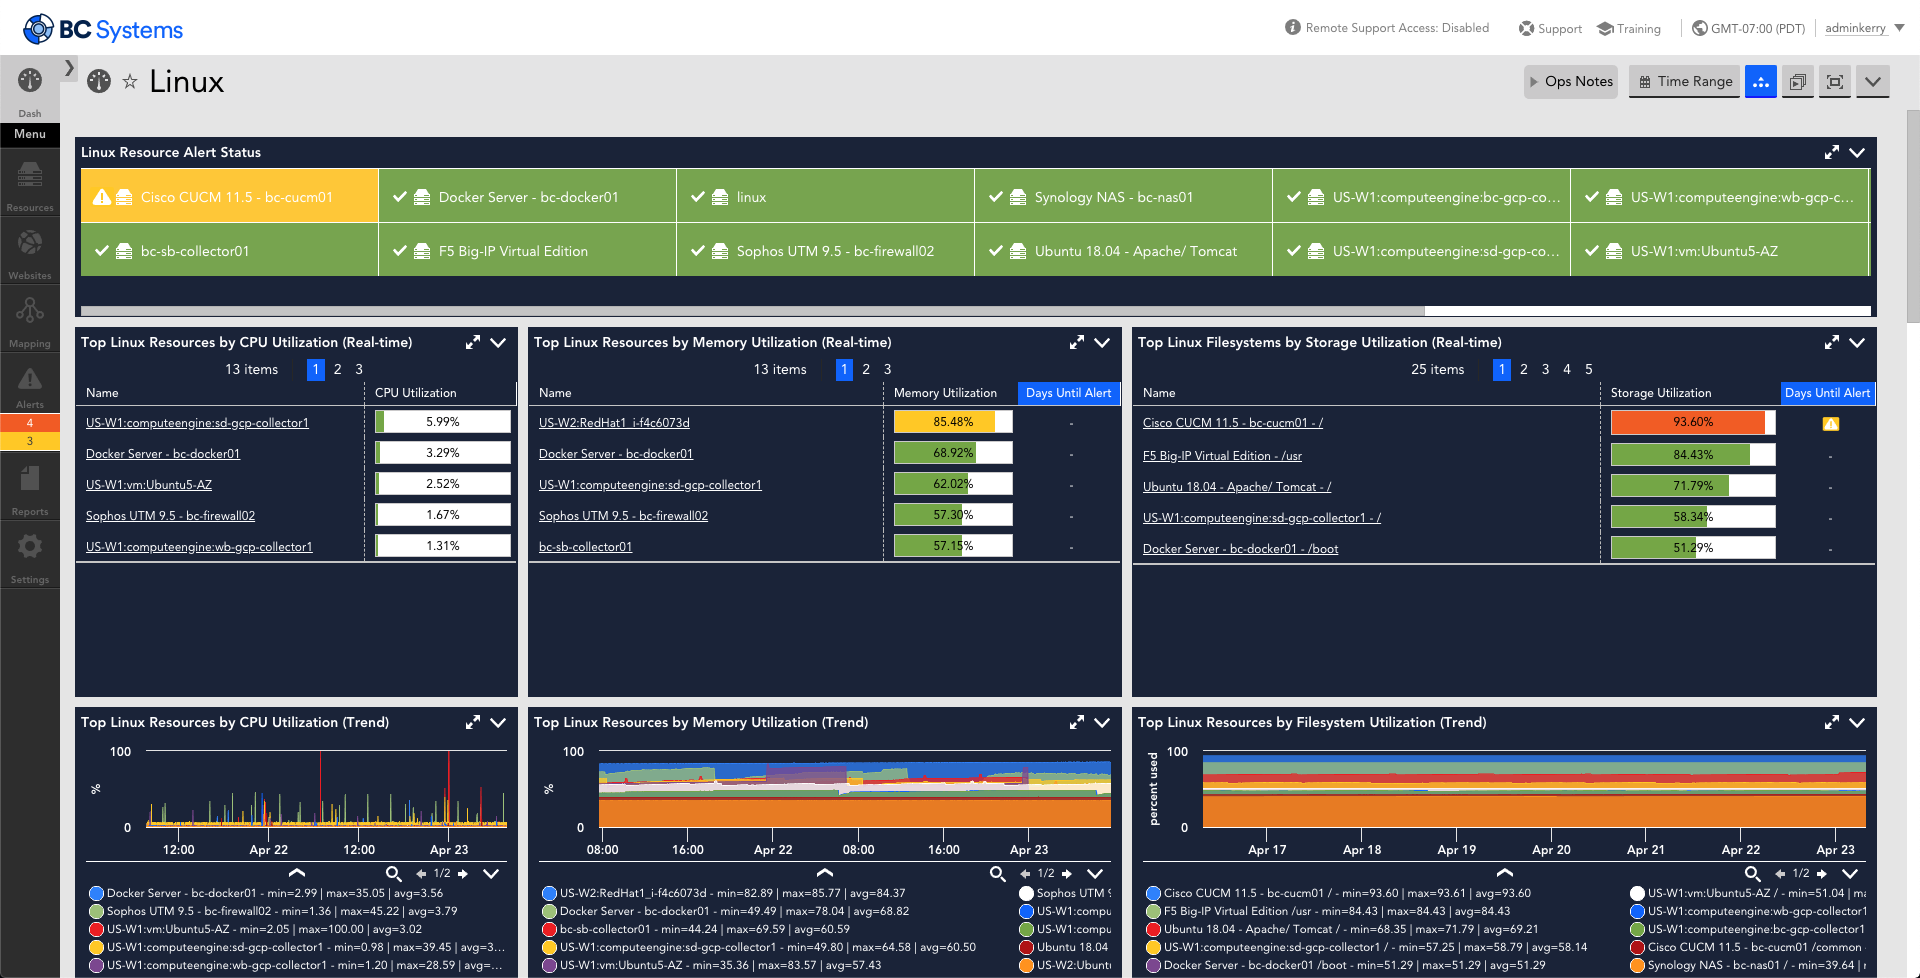
Join fellow LogicMonitor users at the Elevate Community Conference and get hands-on with our latest product innovations.

Register Now

Resources

Explore our blogs, guides, case studies, eBooks, and more actionable insights to enhance your IT monitoring and observability.

View Resources

About us

Get to know LogicMonitor and our team.

About us

Documentation

Read through our documentation, check out our latest release notes, or submit a ticket to our world-class customer service team.

View Resources

Linux

As you add Linux devices, this dashboard will auto-populate with vital statistics about their health and activity.

http://This%20dashboard%20provides%20an%20a%20listing%20of%20various%20metrics%20that%20are%20monitored%20for%20Linux%20servers%20using%20SNMP%20or%20SSH.%20The%20metrics%20displayed%20are%20status,%20real-time%20CPU%20utilization,%20real-time%20memory%20utilization,%20real-time%20storage%20utilization,%20CPU%20utilization%20over%20time,%20memory%20utilization%20over%20time,%20storage%20utilization%20over%20time.

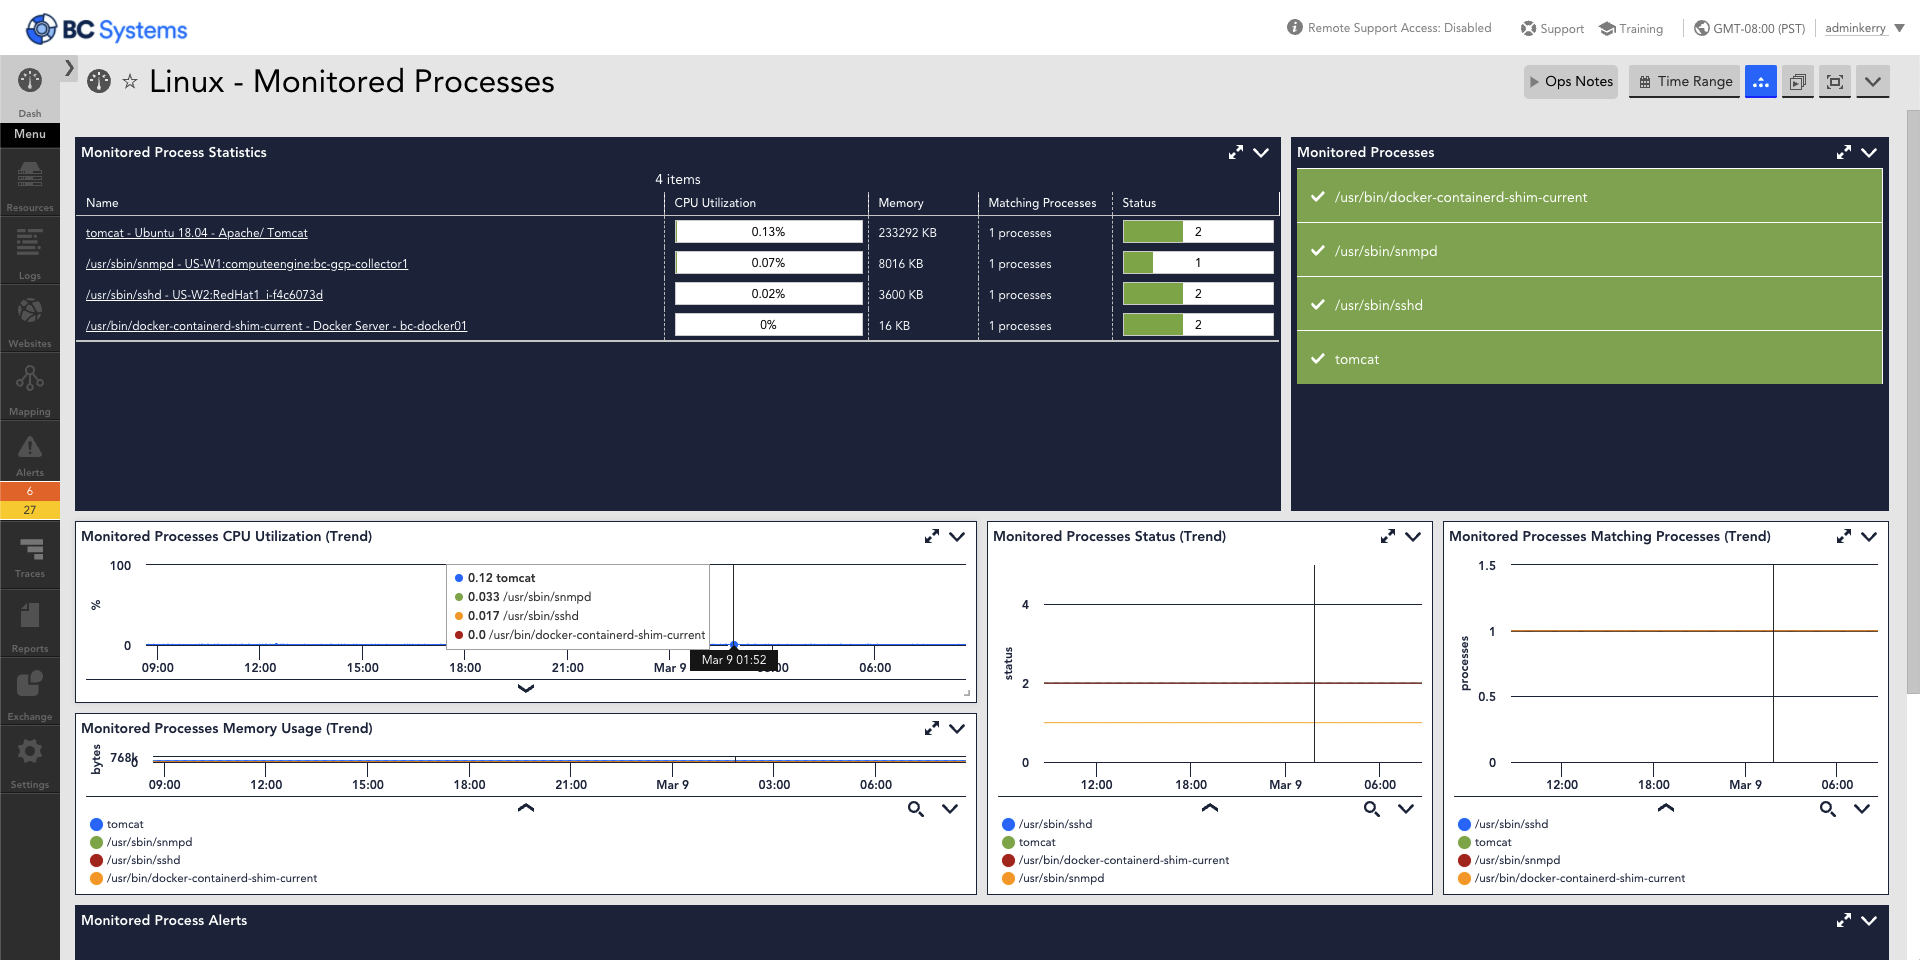
Linux – Monitored Processes

Monitor the performance of individual processes on Linux box with this dashboard provided out-of-box.

http://Monitor%20the%20performance%20of%20Linux%20processes%20with%20this%20LogicMonitor%20dashboard

Linux SSH

As you add Linux devices, this dashboard will populate with vital statistics about their health and activity.

http://This%20dashboard%20provides%20an%20a%20listing%20of%20various%20metrics%20that%20are%20monitored%20for%20Linux%20servers%20using%20SNMP%20or%20SSH.%20The%20metrics%20displayed%20are%20status,%20real-time%20CPU%20utilization,%20real-time%20memory%20utilization,%20real-time%20storage%20utilization,%20CPU%20utilization%20over%20time,%20memory%20utilization%20over%20time,%20storage%20utilization%20over%20time.

In This Category

Get Started with LogicMonitor