Oracle
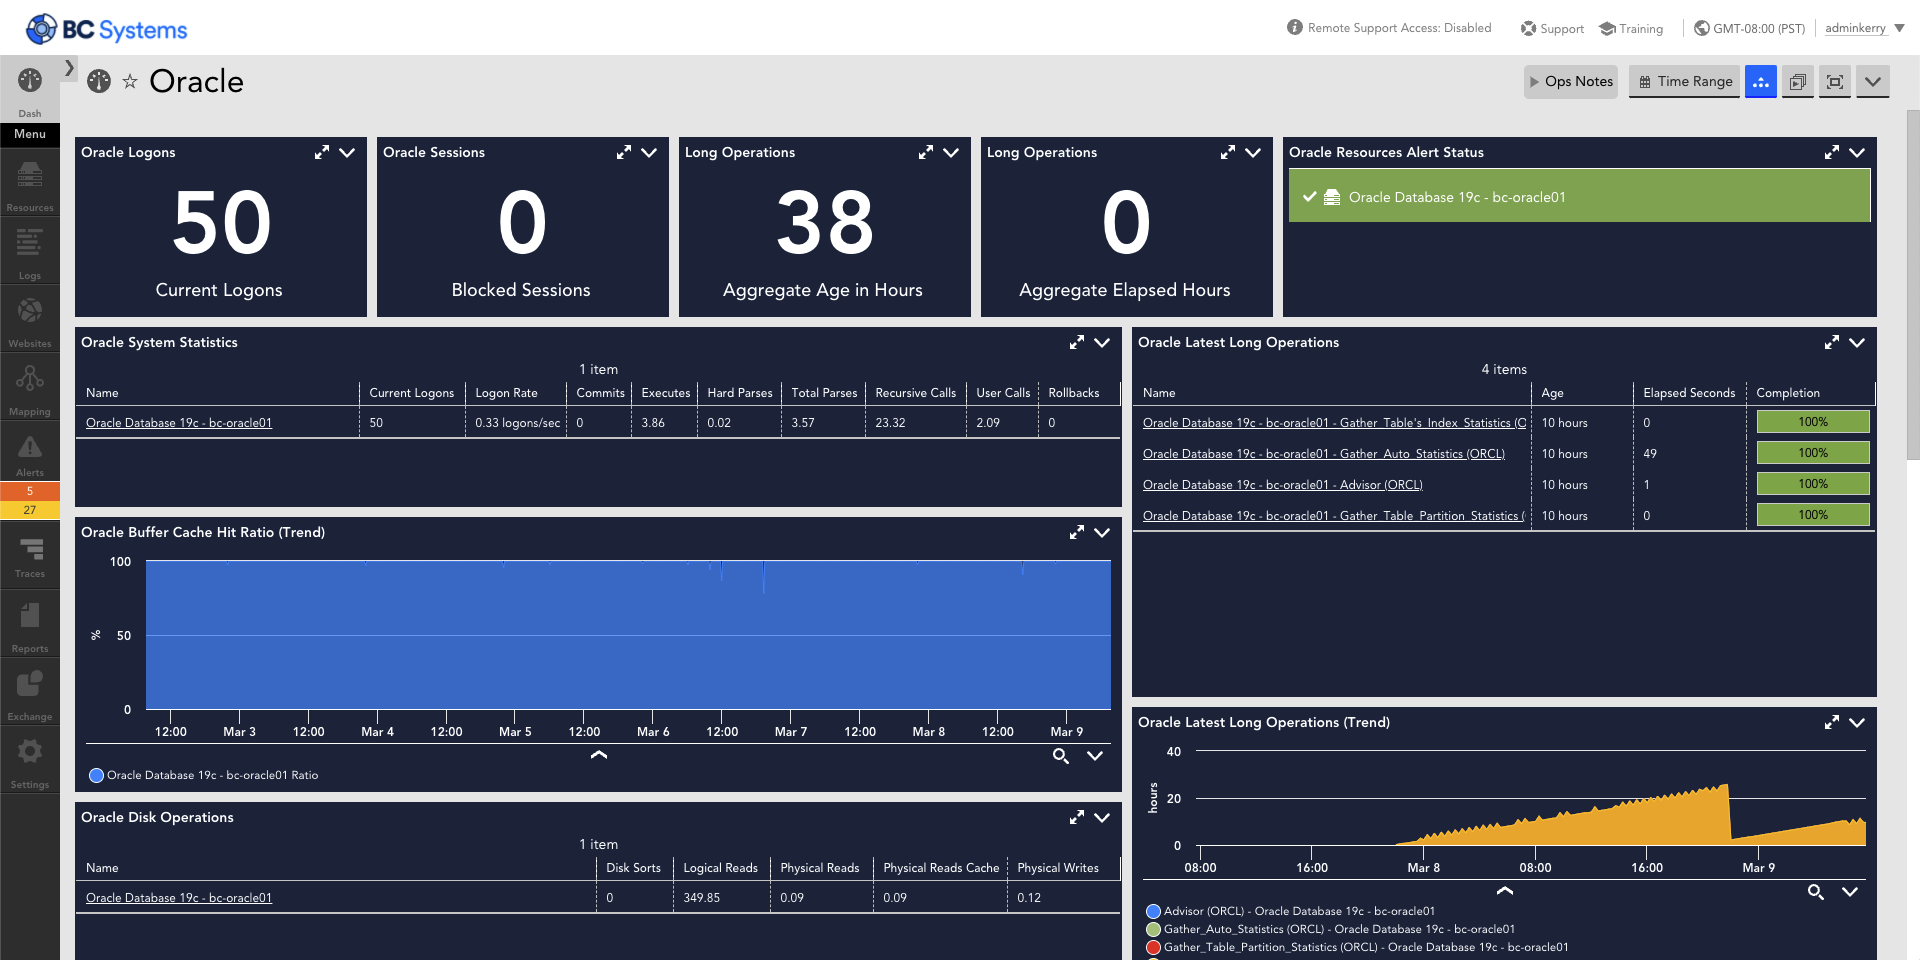
LogicMonitor includes support for monitoring technologies from Oracle. We include LogicModules out-of-the-box that monitor critical Oracle performance metrics to build out dashboards that show the data critical to your IT Operations.

Comprehensive monitoring
LogicMonitor provides end-to-end monitoring of Oracle databases, including server, database, and application-level metrics, giving you a complete view of your environment.

Automatic discovery
Automatically discover all Oracle instances and databases in your environment, making it easy to add new databases as your environment changes.
Pre-built templates and dashboards
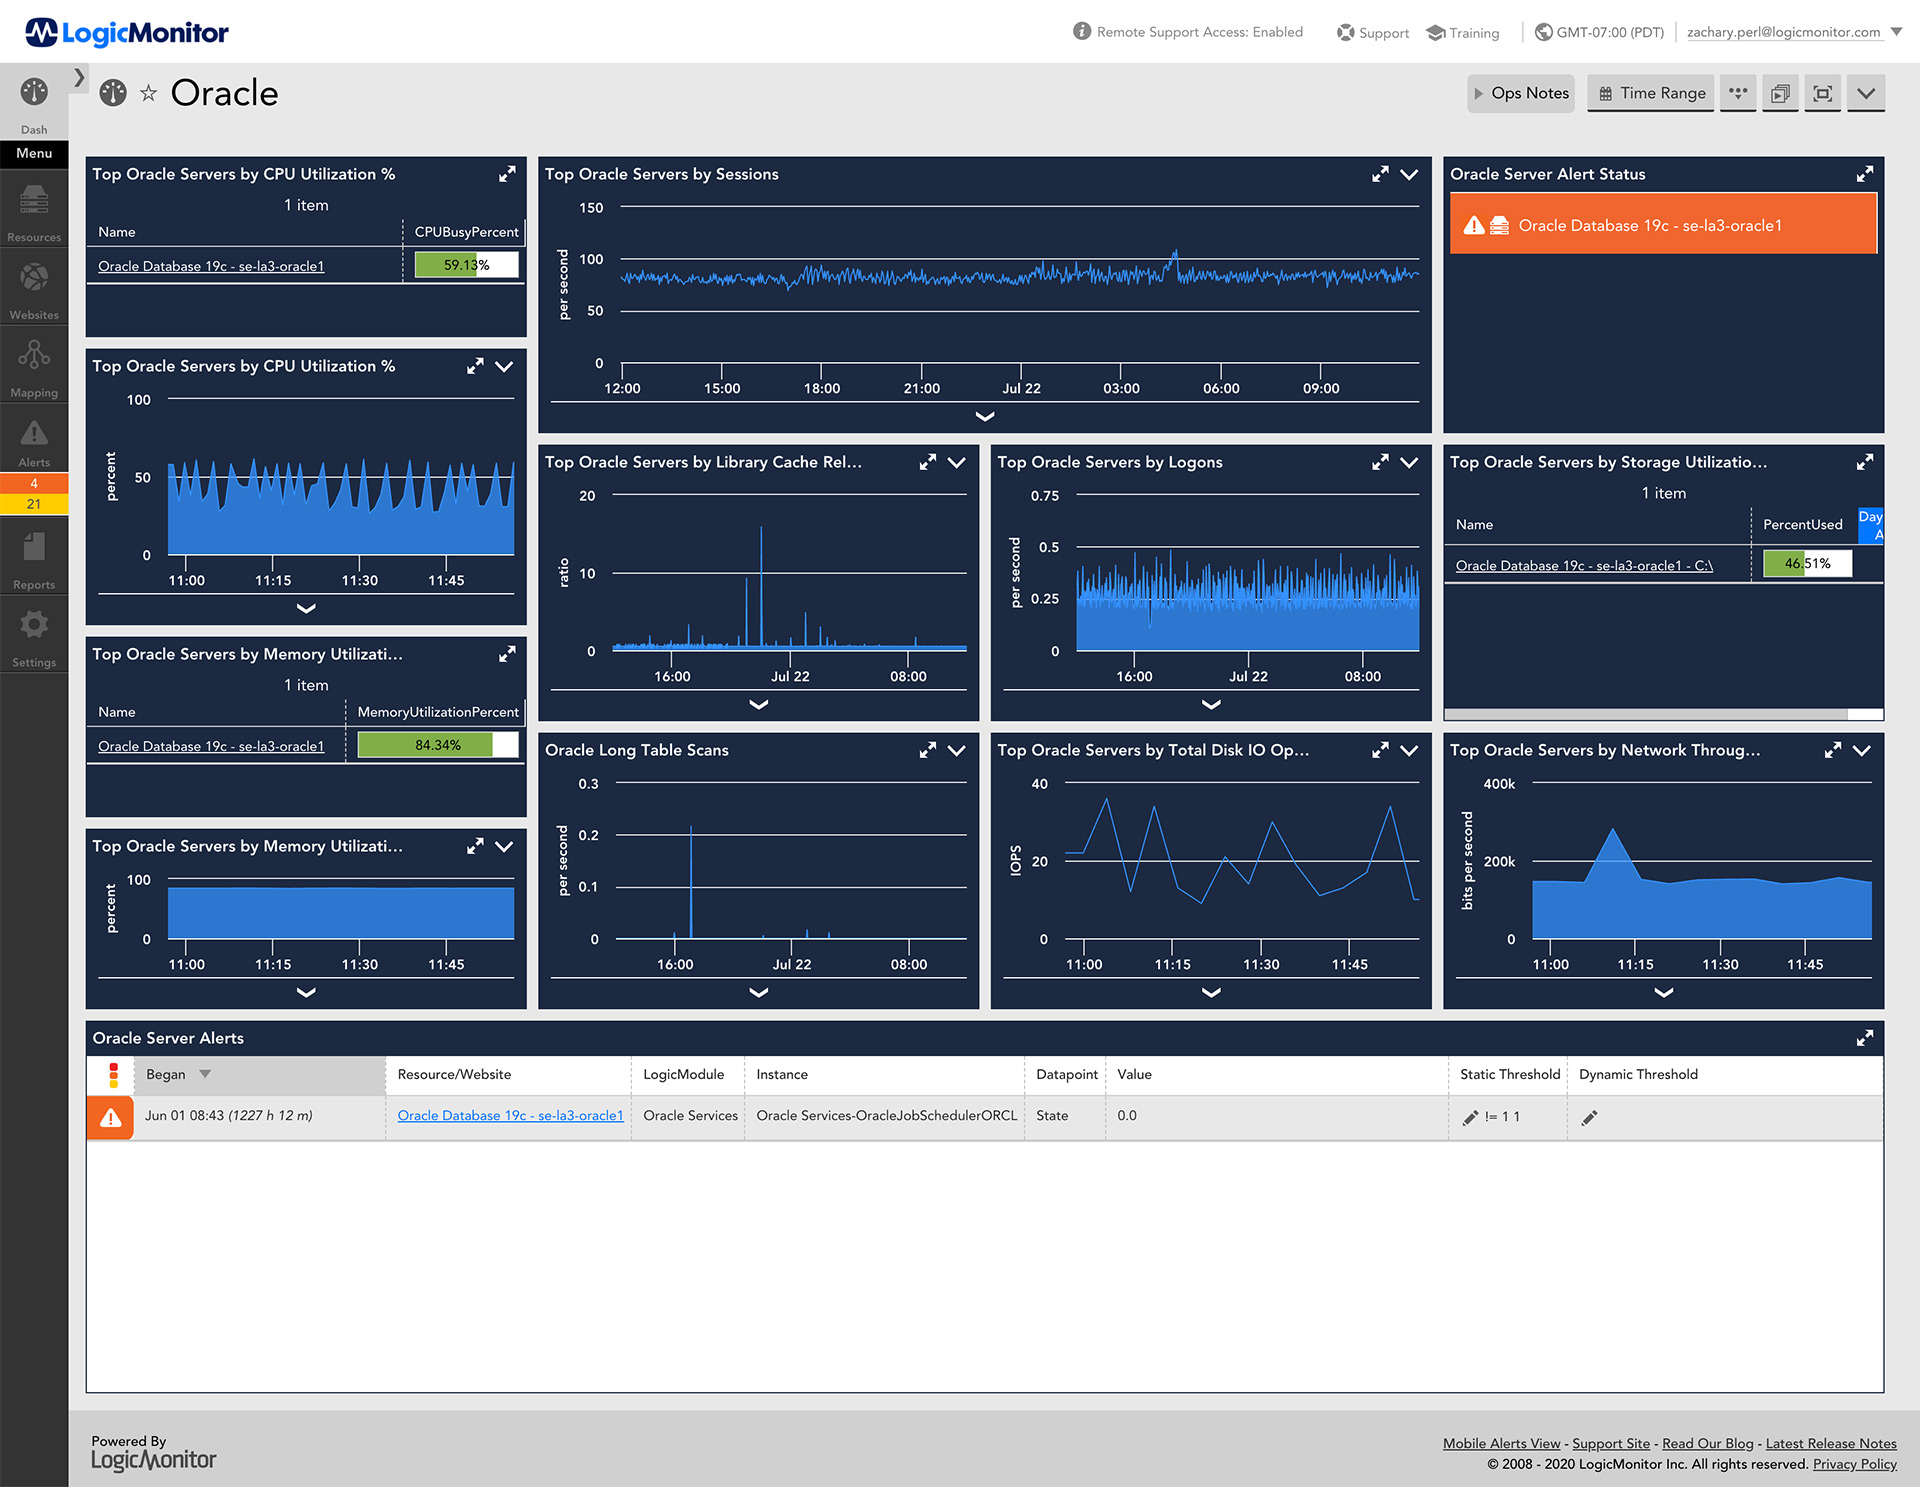
The LogicMonitor platform comes with pre-built monitoring templates that allow you to monitor critical metrics such as buffer cache hit ratios, I/O rates, and database response times out of the box.

Alerting and notifications
LogicMonitor’s alerting and notification capabilities ensure that you are immediately notified of any issues with your Oracle databases, so you can quickly take action to resolve them.

Scalability
LogicMonitor is designed to scale with your environment, ensuring that you can monitor all of your Oracle databases as your organization grows.
Performance metrics that matter
Monitor Oracle performance indicators that include: disk sorts, executes, physical read/writes, and current/total logons and more, including:
- DB Block Changes
- Block Changes per Transaction
- Buffer Cache Hit Ratio
- Disk Sorts
- SQL Executed
- Logical Reads
- Logon info
- Long Table Scans
- Parse Rate
- Physical IO
- Redo Bytes per sec
Do more automatically with JDBC
LogicMonitor uses JDBC to retrieve Oracle performance metrics such as CPU usage, memory usage, and response times. JDBC provides a standard interface for connecting to different types of databases, so collected data is consistent and reliable.
For clients with correctly configured systems (SSH for Linux or WMI for Windows access), LogicMonitor will automatically begin monitoring new databases as they are found/created.
