Introduction
LM Logs offer intelligent log analysis with querying capabilities for all experience levels to analyze log data. But it’s most effective to know when to investigate deeper and conduct further analysis instead of trying to identify hidden trends in log data manually. The best way to determine what’s relevant now is to see if the amount of log data and message types produced in a device or service have drastically changed. LogicMonitor’s latest logs product enhancement helps improve efficiency and reduce risk by identifying unforeseen trends that could bring services down or impact the end user.
Query Tracking is now available for all LM Logs customers to find what’s relevant in your data today, so you can better prepare for tomorrow.

Announcing LM Logs Query Tracking
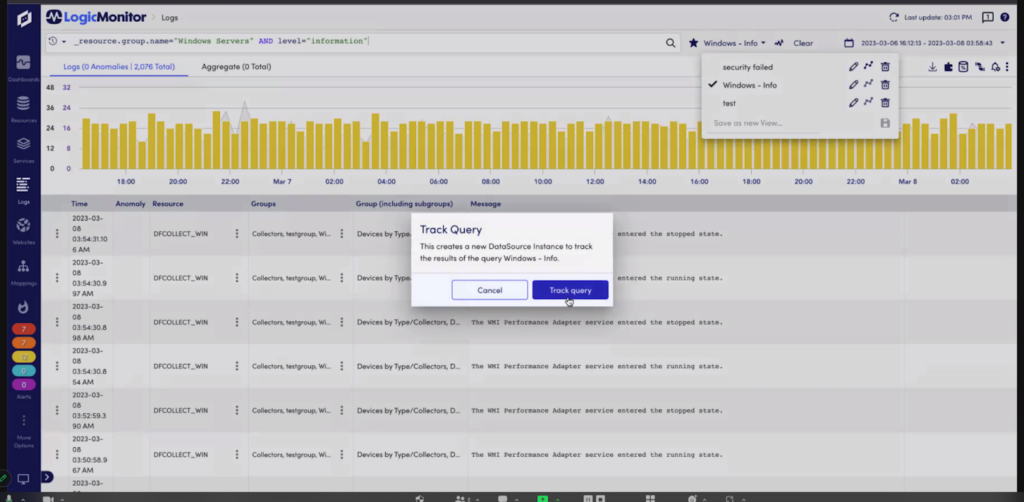
LM Logs now supports Query Tracking that lets you save log-data search queries and create LogicMonitor data points to visualize within dashboarding, keeping an early eye on trends. Think about a few queries you may have saved within LM Logs, like various severity levels of log events within your Windows servers
- _resource.group.name = “Windows Servers” AND level=“INFORMATION”
- _resource.group.name = “Windows Servers” AND level=“ERROR”
- _resource.group.name = “Windows Servers” AND level=“WARNING”
Select one of these saved queries within LM Logs and select “Track Query” within the drop-down to prepare future trend analysis within LogicMonitor dashboards. The actual message within each of these events isn’t that useful. With Query Tracking, you no longer need to manually check at a given time to see the count of “INFORMATION” or “WARNINGS” events. Instead, you can expand your coverage by alerting for new trends within your log data.
So if you see a spike in the count of ‘INFORMATION” log events after the last OS update, maybe this is something to explore. You can proactively make decisions based on automated findings.
Trends within LM Dashboards
LogicMonitor dashboards do more than visualize the health and performance of your connected IT devices. LogicMonitor’s machine-learning algorithms establish expected data patterns for your metrics. Anomaly detection identifies data patterns that fall outside these patterns and surfaces them for customers to take action. What does this mean for log data? LogicMonitor’s algorithms now identify trends in the count of your log events that indicate a deviation. You can browse dashboards and identify interesting patterns in the frequency of your log data to predict something that requires your attention, removing surprises. The spike in the count of “INFO” log events in a given interval is more important for this analysis than the message itself.
If you pushed out multiple Windows patches across your environment, LogicMonitor’s dynamic thresholds would apply to your tracked queries for the Windows Servers log events to alert you of abnormal log volume changes. Being immediately alerted that a spike in “ERROR” or even “CRITICAL” after a rollout could direct attention to minimizing the potential issue and reducing risk.

Getting started with Query Tracking
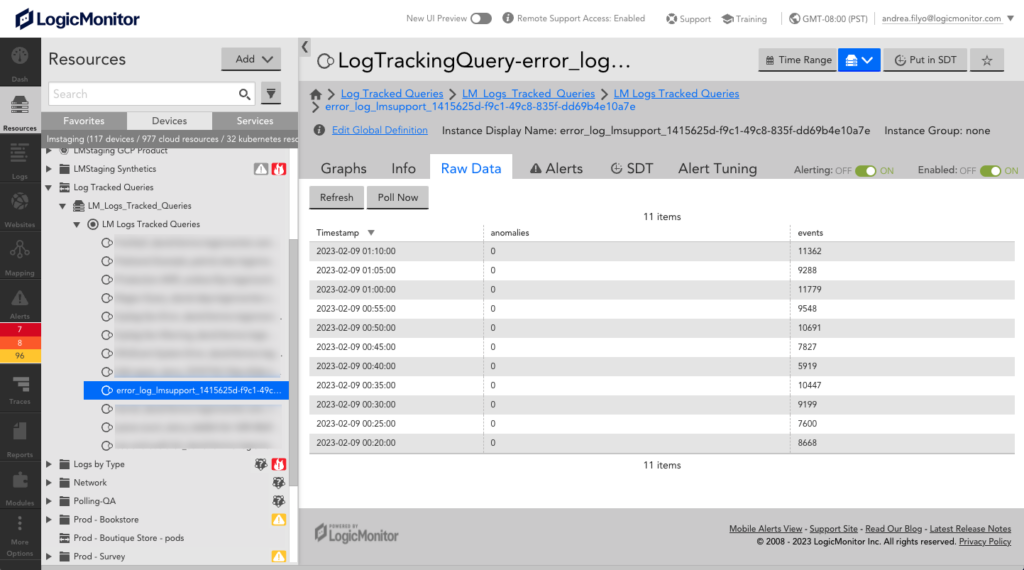
Let’s return to the example saved query for _resource.group.name = “Windows Servers” AND level=“INFORMATION”. On a typical week, you may run this query and see thousands of low-level, relatively meaningless data within the message of each event. Once you enable tracking for this data set, LogicMonitor runs this query every five minutes to return a metric of the count of the logs and log anomalies that match the criteria. This metric is saved to the tracked query instance in a new LM resource group, Log Tracked Queries.
If you hop to the specific resource group in LogicMonitor, the new Log Tracked Queries group shows you the frequency of your log data. In the case of the _resource.group.name = “Windows Servers” AND level=“INFORMATION” you would see a steady count of somewhat noisy data within each interval. If an error occurred somewhere within your resource group, you would see a potential spike in the graph’s count, indicating you should dive into LM Logs to analyze log data for the time range.

Building proactive workflows
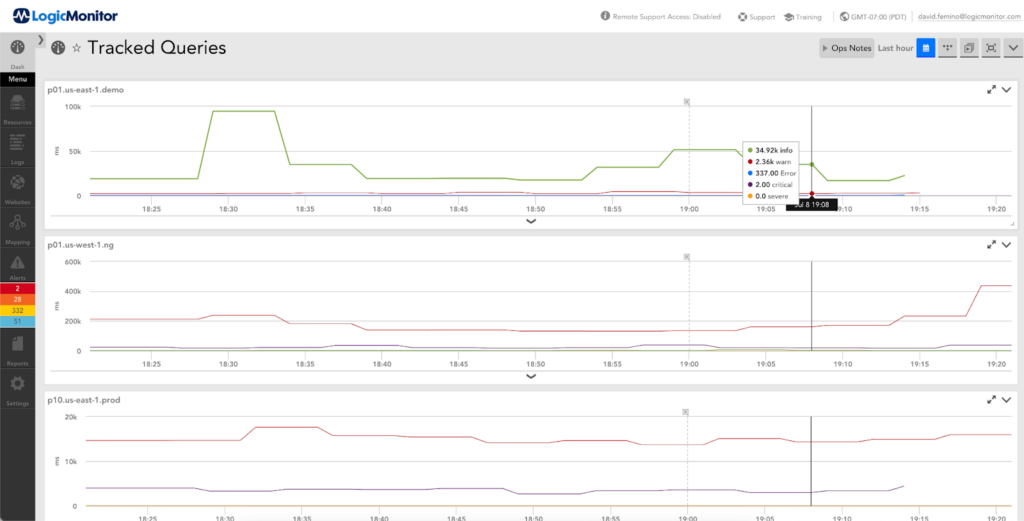
You can track the performance of these Windows Servers further in LM Dashboards. Create a new custom graph where the data source is “LM Logs Tracked Queries.” You can see all instances of tracked queries and the selected user. As seen above, you could stack the counts of multiple log queries into one chart to show the rise and fall of all the levels of logging events: “INFO,” “ERROR,” “WARNING,” and “CRITICAL.” Now you can look at high-level activity trends within your tracked resource, like the number of “WARNING,” to see if you need to filter into logs for the time frame.
LM dashboards now show trends of IT metrics and log queries in the same dashboard. Better understand the frequency of insightful events with dynamic thresholds configured for your important log queries to identify insights worth troubleshooting.
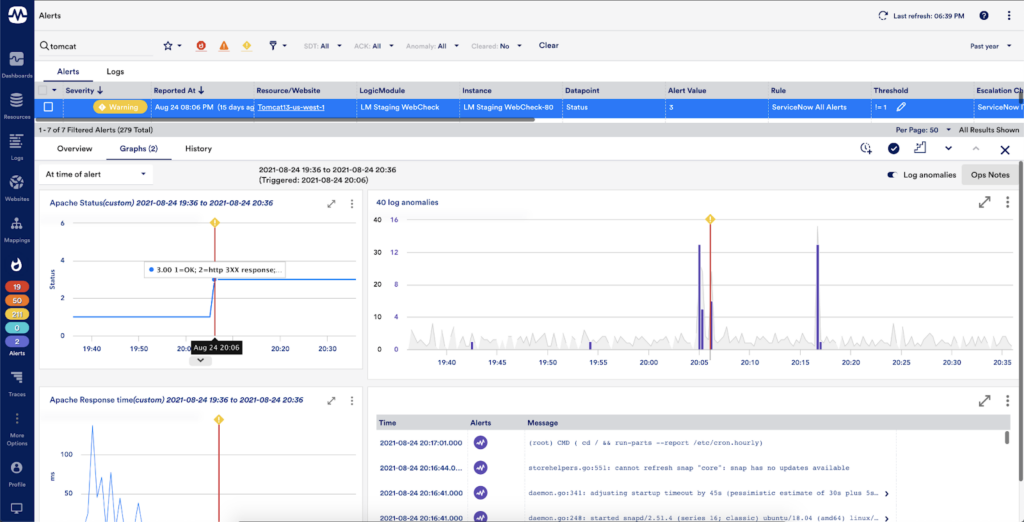
Tracked Queries also strengthen your control over log alert conditions for your data set. Instead of just managing alert conditions on specific log queries for the Windows Servers when certain events reach a threshold, now you can elevate this alert condition for trends when the count of log events deviates outside standard counts. LogicMonitor continues to provide more personalization to let you decide which of your data warrants deep analysis.

Taking action
Take your log analysis to the next level and start understanding trends and patterns within your data set. Query Tracking is now available for all LM Logs customers. Take your most recent Saved Search to save as a query or create new useful queries to expand your insights. With LogicMonitor, now you can clearly see when it’s time to dive into log analysis.
Subscribe to our blog
Get articles like this delivered straight to your inbox


