
Network topology mapper
Simplify network visualization, accelerate troubleshooting, and enhance collaboration—all in one platform.

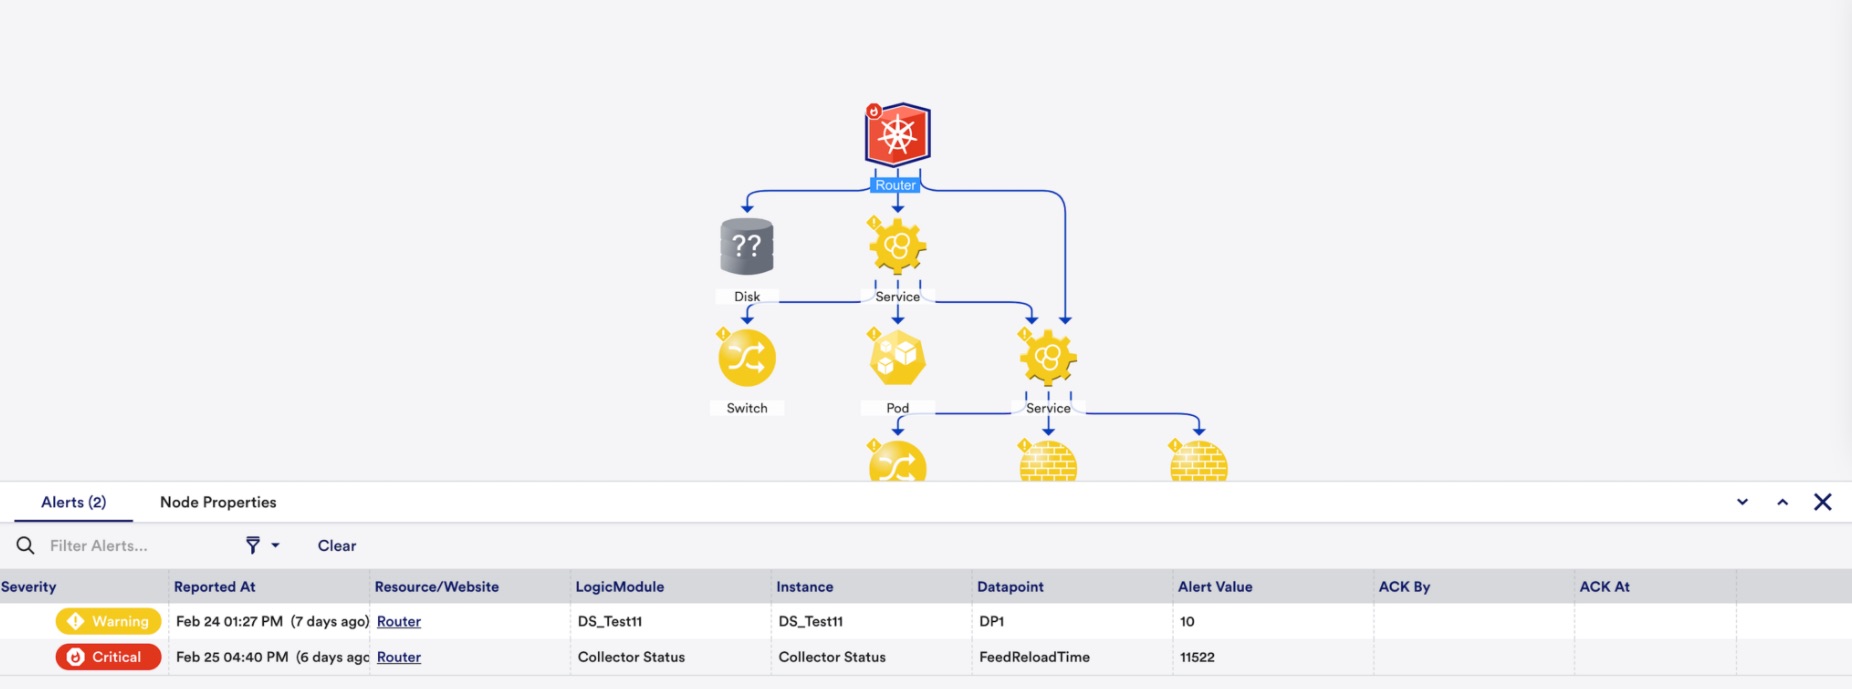
Root cause troubleshooting
Pinpoint and resolve issues faster with real-time insights
- Quickly identify the root cause of incidents directly on the topology map.
- Highlight dependencies between resources and suppress redundant alerts for efficient resolution.
- Integrates seamlessly into workflows to reduce downtime and boost team productivity.
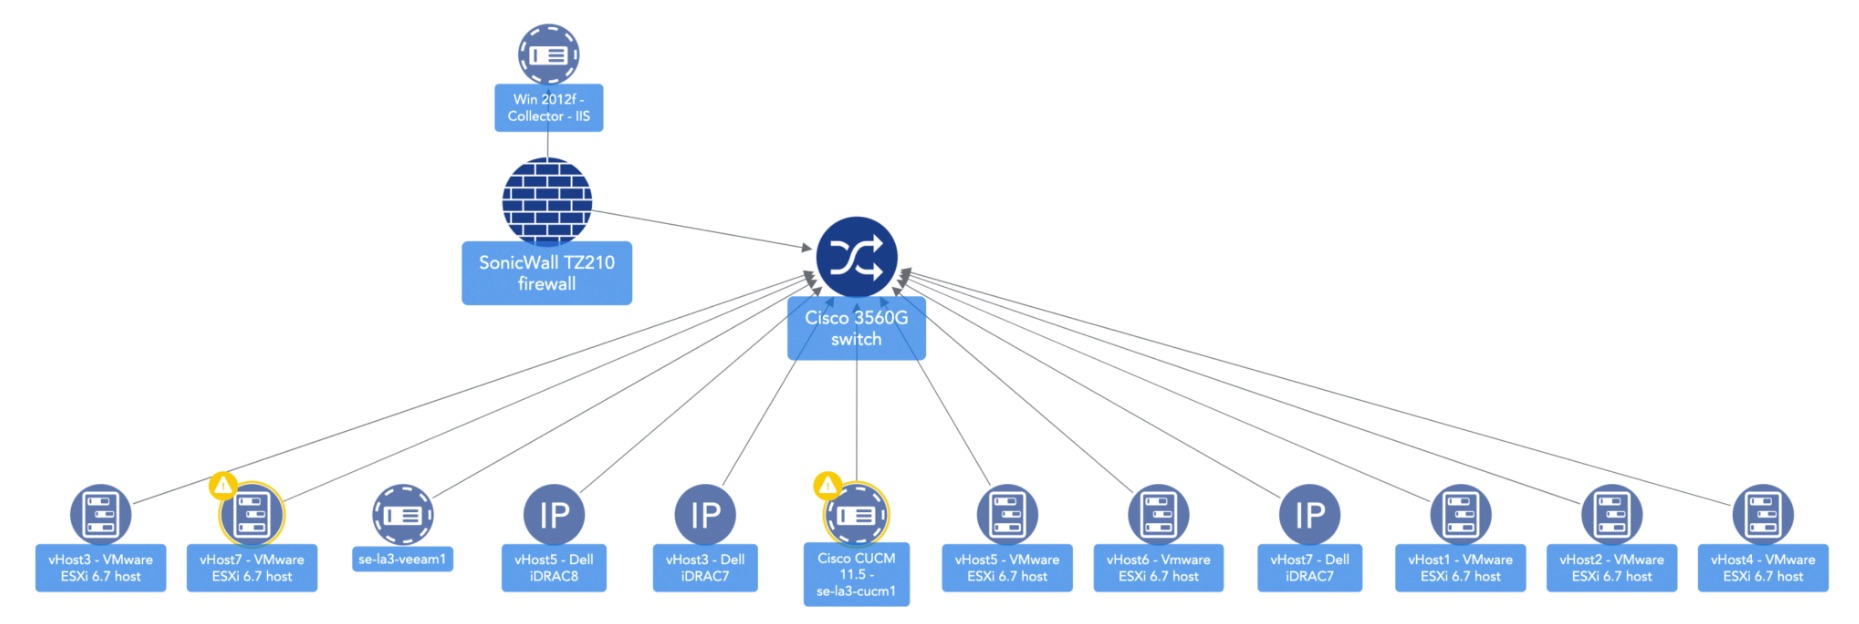
Dynamic network visualization
Visualize your entire network in one unified view
- Gain real-time visibility into Layer 2 and Layer 3 relationships using advanced protocols like LLDP, CDP, BGP, and OSPF.
- Understand traffic flows across switches, routers, firewalls, and other critical components.
- Interactive maps automatically update to reflect changes in your environment.
Alert & dashboard integration
Turn alerts into actionable insights
- Generate topology maps based on alerts to streamline troubleshooting workflows.
- Visualize resource statuses and easily navigate alerts for contextual insights.
- Add topology maps to dashboards for a centralized, unified monitoring experience.
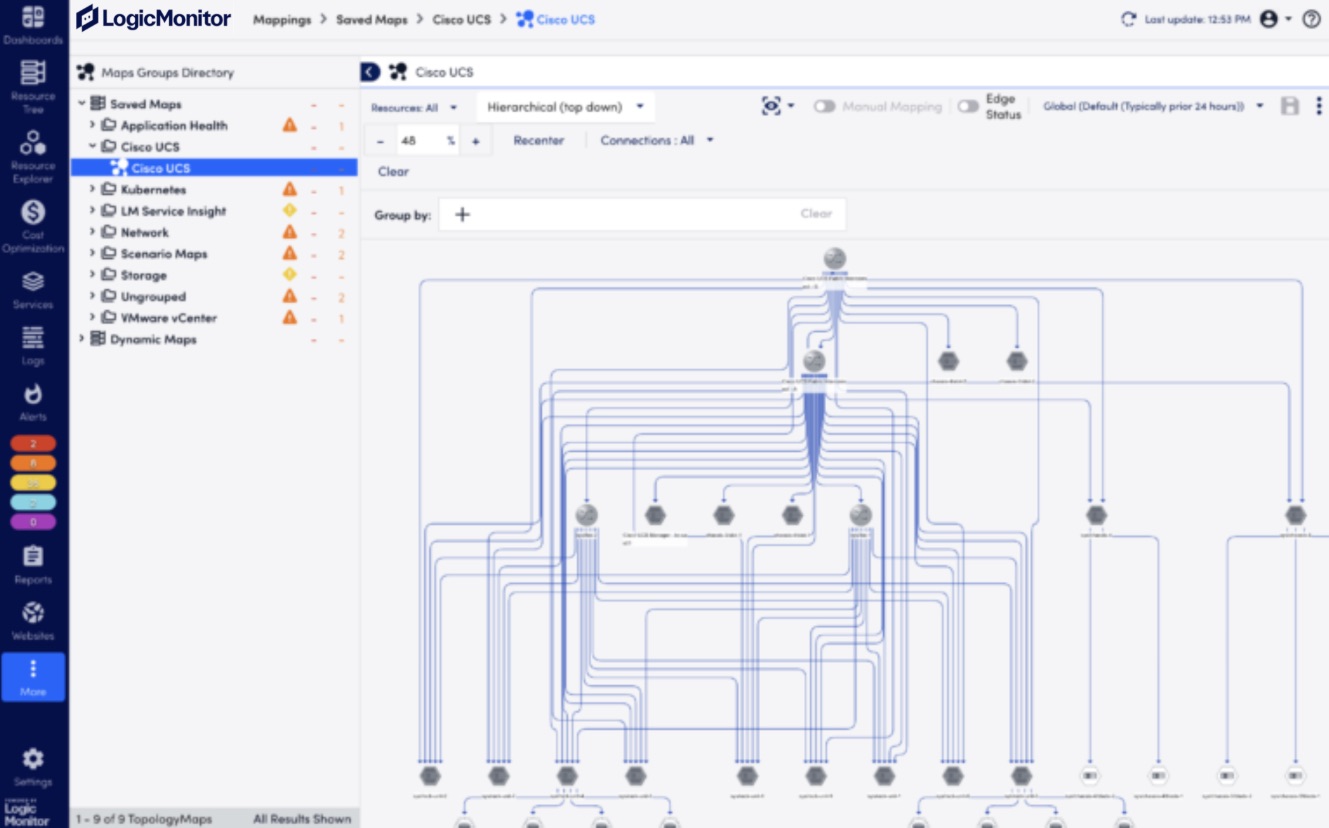
Customizable & shareable maps
Tailor your maps to fit your team’s needs
- Save and share frequently used maps for collaboration and continuity.
- Customize layouts with multiple views, such as hierarchical, radial, and circular.
- Integrate topology maps into dashboards and reports for actionable visibility.
Trusted by leading companies


Frequently asked questions
- What types of network relationships does LogicMonitor’s topology mapping support?
LogicMonitor supports Layer 2 and Layer 3 mappings, including device-to-device connections, routing, and traffic control relationships. It leverages protocols such as LLDP, CDP, BGP, and OSPF to provide a complete view of your network infrastructure.
- How does topology mapping improve troubleshooting?
LogicMonitor’s topology maps enable you to quickly identify the root cause of incidents by showing dependencies between resources. You can visualize alerts in context, suppress redundant notifications, and resolve issues faster, reducing downtime.
- Can I customize and share topology maps with my team?
Yes! You can save, customize, and share topology maps tailored to your specific monitoring needs. Multiple layouts, including hierarchical and radial views, are available to suit different use cases. Saved maps can also be integrated into dashboards for better collaboration.
- Does topology mapping work with existing LogicMonitor dashboards and alerts?
Absolutely. LogicMonitor’s topology maps integrate seamlessly with dashboards and alerts. You can generate maps directly from alerts for faster troubleshooting and include them in dashboards for centralized monitoring.