
In this article
More in this series


Comprehensive Network Monitoring in One Platform
Explore LogicMonitor’s full suite of network monitoring capabilities
Network monitoring isn’t just about having the right tools; it’s about implementing a comprehensive strategy built on core concepts. Think of these concepts as the posts that support your entire monitoring infrastructure, ensuring you gain the visibility and control needed to keep your network running smoothly.
1. Discovery: Network Fundamentals
Before you can effectively monitor your network, you need to know exactly what’s on it. you need a clear understanding of what’s on it. Discovery is the essential first step, involving the identification of every device connected to your network. This process covers everything—from key infrastructure components like routers, switches, and firewalls to often-overlooked endpoints such as workstations, printers, servers, and IoT devices. Think of it as creating an inventory of your entire digital ecosystem.
Initial Identification to Understand your Digital Environment
The foundation of network monitoring begins with a comprehensive inventory of all devices within your network. This initial identification lays the groundwork for understanding how these devices interconnect, ensuring you gain full visibility into your ecosystem.
Building a Comprehensive Device Inventory
An inventory isn’t just a simple device list; it’s a detailed catalog that includes servers, routers, switches, IoT devices, and endpoints. This detailed approach minimizes blind spots and provides clarity across your network. Automated protocols such as SNMP, ICMP, and NetFlow simplify this process, continuously scanning and updating the inventory as your network evolves.
Securing Connected Devices and Endpoints
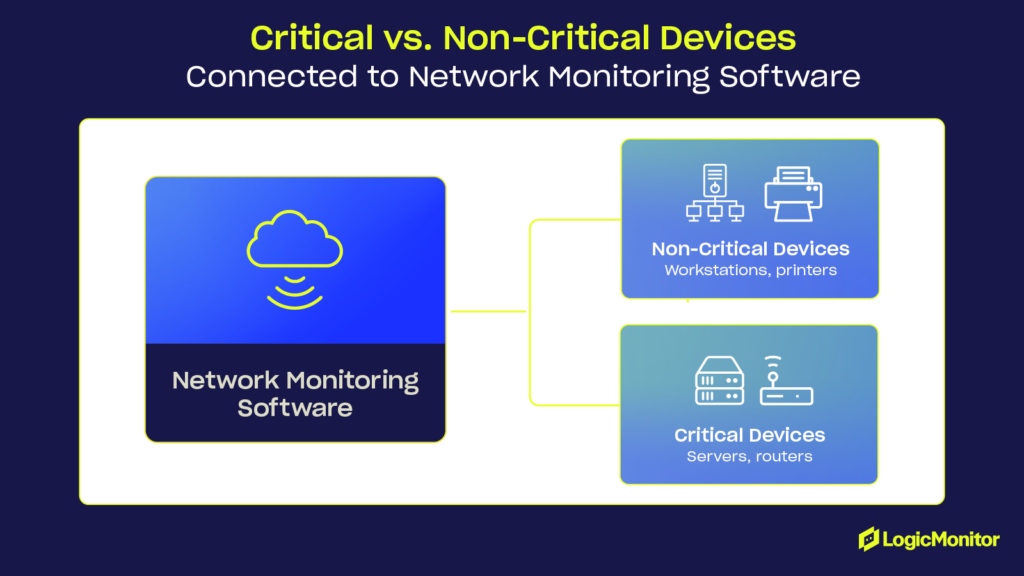
Every connected device, whether it’s a laptop, smartphone, printer, or security camera, represents a potential vulnerability. Identifying and monitoring these endpoints ensures traffic optimization, performance improvement, and better security. It’s equally important to include external assets, such as cloud connections, in your strategy to maintain a holistic view of your network.
Mapping the Digital Ecosystem
Modern networks are increasingly complex, spanning on-premises systems, hybrid environments, and multi-cloud setups. Mapping these interactions is critical. By leveraging visual tools like topology maps, you can better understand dependencies, prioritize mission-critical systems, and pinpoint potential failure risks, ensuring smooth operations across your entire infrastructure.
Automated Discovery Tools
Many network monitoring solutions offer automated discovery features that act like digital detectives, using protocols like:
- SNMP (Simple Network Management Protocol): This protocol gathers device information and performance metrics, acting as a conversational tool to extract details like CPU usage and memory consumption.
- LLDP (Link Layer Discovery Protocol): Used to advertise device information to neighbors on the local network. Think of it as devices introducing themselves to each other, making it easier for you to map their relationships.
- CDP (Cisco Discovery Protocol): A Cisco-specific protocol that provides detailed insights into Cisco devices, making it easier to manage and monitor these critical components.
Manual Verification
While automated tools are powerful, they may miss devices that don’t use standard protocols or are intentionally hidden (shadow IT). To ensure complete visibility and eliminate blind spots, manual verification is essential:
- Regular manual audits: Conduct periodic spot checks to validate your automated inventory and ensure all critical devices are accounted for.
- Accurate device registration records: Maintain an up-to-date master list of all authorized devices, ensuring nothing is overlooked.
- Routine network scans: Use scanning tools to actively probe your network, uncovering new or unauthorized devices. Think of this as sweeping your network with a metal detector to catch hidden surprises.
Pro Tip: In hybrid environments, it’s especially important to track cloud-based resources, which change frequently. Cloud instances can spin up and down dynamically, making it crucial to have a monitoring solution that can keep pace with these changes.
2. Mapping: Visualizing Your Network for Greater Insights
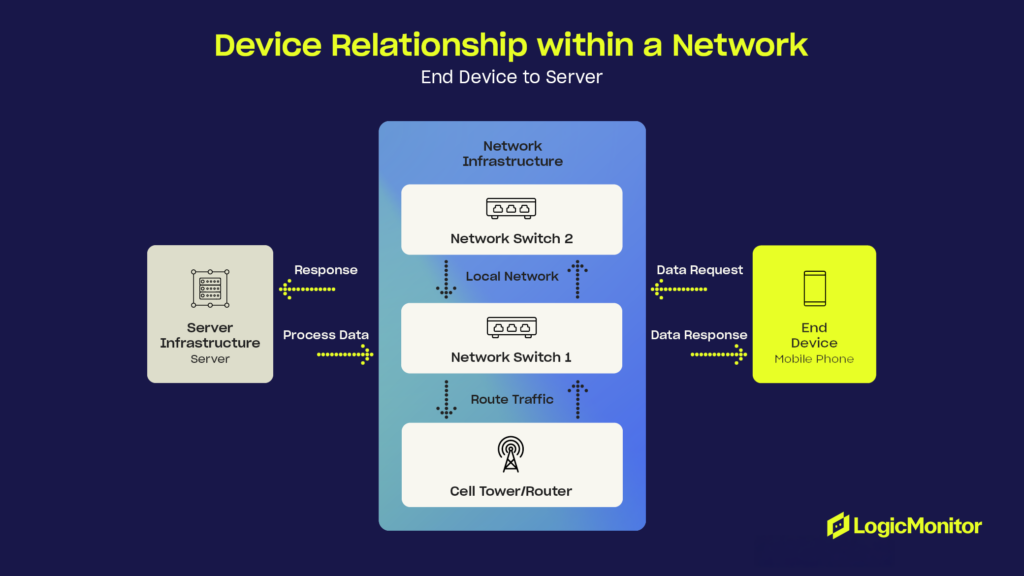
Once you’ve identified your network devices, the next step is to understand how they’re interconnected. Network mapping provides a visual representation of your network topology, like a blueprint of your digital world, showing the relationships and dependencies between devices.
Visualizing Network Topology
A network map visually represents how devices connect and data flows, helping identify bottlenecks, optimize traffic, and boost performance. Tools like topology diagrams quickly pinpoint issues like loops or misconfigurations for a smoother, more efficient network.
Establishing a Network Blueprint
A network map acts as a foundational blueprint, highlighting devices, their locations, and roles. This overview aids in planning, upgrades, troubleshooting, and onboarding new team members.
Mapping Device Relationships
Understanding device interactions is essential for prioritizing assets and ensuring redundancy. Relationship mapping reveals critical connections, such as which servers support applications or how routers handle traffic, allowing for swift responses in case of failures.
Through effective network mapping, you gain the ability to:
- Visualize how data flows through your network, identifying bottlenecks and single points of failure.
- Uncover hidden dependencies that might not be obvious from a simple device inventory. Understanding these relationships helps mitigate the cascading impact of a failure.
- Enhance resilience by visualizing failover paths and backup systems, ensuring your network can withstand unexpected disruptions.
Dynamic Mapping for a Changing Network
In fast-changing environments, automated mapping tools make it easy to keep your network visualization accurate and up to date. They adapt smoothly to changes, so your infrastructure stays on track without losing visibility.
- Real-time updates: Automated tools continuously refresh your network map, instantly reflecting any additions, removals, or adjustments to devices. This ensures you always have the most current view of your network.
- Configuration changes: Whether you’re reconfiguring a router, updating firewall rules, or modifying device settings, mapping tools capture and display these changes, helping you identify and address potential misconfigurations.
- Infrastructure evolution: As your network grows or transitions—such as integrating hybrid or cloud environments—mapping tools evolve alongside it, offering an accurate representation of your infrastructure’s latest state.
Example: A network map might reveal that your primary firewall and its backup both rely on the same network switch. This could be a single point of failure! With this knowledge, you can reconfigure your network to eliminate this vulnerability.
3. Monitoring: Performance Tracking for Reliability
Continuous monitoring is the heart of any effective network monitoring strategy. This involves collecting and analyzing a wide range of performance metrics from your network devices and applications. It’s like taking the pulse of your network, constantly checking for signs of health or distress.
Real-Time Data Collection and Analysis
Continuous monitoring relies on capturing real-time data from devices, applications, and endpoints, including metrics like bandwidth usage, latency, packet loss, and CPU utilization. These metrics provide critical insights into network behavior, enabling rapid detection of anomalies like unexpected traffic spikes or device failures. For example, a sudden surge in bandwidth usage might indicate a distributed denial-of-service (DDoS) attack, while rising packet loss could suggest hardware degradation or faulty connections.
As data flows in, monitoring tools analyze it to uncover trends, patterns, and potential bottlenecks. Metrics like response time and throughput can highlight underperforming or overburdened systems. This analytical capability ensures your resources are efficiently utilized, avoiding scenarios where underused components coexist with overloaded devices, leading to performance inefficiencies.
Proactive System Health Checks
Regular system health checks form a vital part of monitoring, assessing the operational status of critical components like servers, routers, and firewalls. These automated evaluations trigger alerts when predefined thresholds are exceeded, enabling proactive resolution of issues before they affect users. For instance, if a server’s CPU consistently operates at peak capacity, monitoring alerts can help preempt a potential system failure or degraded user experience.
Essential Metrics
Comprehensive monitoring involves tracking a range of critical metrics, each offering unique insights into network performance:
- Bandwidth utilization: Monitoring how much bandwidth is being used helps identify congestion points. This can be compared to managing traffic flow on a highway—ensuring smooth movement and avoiding gridlock.
- Latency: Measuring data transmission delays is essential for maintaining optimal application performance, especially for real-time services like video conferencing or online gaming, where even minor delays can frustrate users.
- CPU usage: Keeping tabs on processing loads reveals potential bottlenecks. A device consistently running at maximum capacity may be struggling to meet demand.
- Disk performance: Tracking disk I/O and storage capacity helps prevent performance degradation. Slow disk access can impact application responsiveness and user satisfaction.
- Memory consumption: Ensuring adequate memory is critical for stability. Insufficient memory resources can lead to crashes or instability that disrupt network operations.
Holistic and Comprehensive Monitoring
Monitoring should extend beyond hardware to include key services and protocols like HTTP, FTP, and TCP/IP. This provides a holistic view of network and application activity, allowing you to correlate metrics across layers and identify the root cause of performance issues.
- Service-level tracking: Monitoring services like HTTP, FTP, DNS, and databases ensures applications stay accessible and responsive. It helps detect downtime, performance issues, or misconfigurations, enabling faster resolution and improving user experience.
- Protocol monitoring: Key network protocols like TCP/IP, SNMP, and ICMP are crucial for communication. Monitoring them assesses data flow, identifies interruptions, and ensures reliability.
- Cross-layer correlation: Comprehensive monitoring combines metrics from hardware, services, and protocols, providing a holistic view of network activity. This helps pinpoint the root cause of issues for more effective troubleshooting and optimization.
Example: You might notice that application response times are slow. By monitoring CPU usage on the application server, you can see if the server is overloaded and causing the slowdown.
4. Reporting: Turning Data into Actionable Insights
Raw data is much like a scattered puzzle—it holds potential but lacks value until the pieces are assembled. Reporting bridges this gap by transforming the data collected by monitoring tools into clear, actionable insights that inform strategic decision-making and operational improvements.
The process begins with data transformation, where raw data is cleaned and organized to eliminate irrelevant or extraneous information. This step is crucial for identifying meaningful patterns, trends, and anomalies that require attention. Once processed, the data is analyzed to uncover insights about network performance, emerging security risks, or operational inefficiencies. For instance, a report might highlight network congestion, pinpoint a system failure, or forecast potential issues, enabling timely and targeted responses.
From Data to Decisions
The insights generated through reporting serve as a foundation for informed decision-making. Whether reallocating resources, addressing vulnerabilities, or planning infrastructure upgrades, reports provide stakeholders with the information they need to act. These insights enhance the reliability and efficiency of network operations, ensuring proactive measures replace reactive fixes.
The Value of Reporting
One of the key benefits of reporting is its ability to reveal trends and patterns. Analyzing historical data provides a better understanding of network behavior, helping teams identify recurring issues and address them before they escalate. Additionally, tracking critical key performance indicators (KPIs) such as uptime, response times, and error rates offers a comprehensive view of network health and performance.
Reports also play an essential role in capacity planning, enabling teams to forecast future resource needs based on past usage trends. This foresight helps prevent bottlenecks and ensures the network can accommodate future growth. Moreover, reporting facilitates effective communication, providing tailored insights for different stakeholders—from technical teams needing granular details to executives requiring high-level summaries.
Dashboards: A Real-Time Window into Network Health
Real-time dashboards act as the network’s vital signs monitor, offering an up-to-the-minute snapshot of the IT infrastructure’s current health. By providing live visibility into performance metrics, they enable rapid identification of emerging issues. Complementing this, historical reports delve deeper, revealing long-term performance trends and uncovering areas for improvement. Together, these tools create a comprehensive reporting framework that empowers teams to maintain optimal network performance and stay ahead of potential challenges.
5. Alerting: Your Network’s Early Warning System
Proactive alerting is critical for preventing minor issues from spiraling into major disruptions. Think of alerting systems as your network’s early warning mechanism, designed to notify your team the moment predefined thresholds are breached. With timely alerts, you can respond quickly and effectively, safeguarding the reliability and performance of your infrastructure.
- Threshold monitoring: Alerts begin by continuously monitoring predefined thresholds for key metrics like bandwidth usage, CPU load, or latency. When these limits are exceeded, alerts are generated to help prioritize and address anomalies quickly.
- Proactive early warning system: A strong alerting system acts as an early warning mechanism, identifying issues like device failures, excessive traffic, or security breaches in real-time. This visibility allows you to resolve problems before they become major disruptions.
- Facilitating rapid response: Alerts are designed for quick action, delivering timely, detailed notifications via email, SMS, or dashboard integrations. This ensures your team can efficiently diagnose and resolve issues, minimizing downtime.
Pro Tip: Don’t just rely on built-in thresholds. Customize your alerts based on your specific needs and risk tolerance. For example, you might set tighter thresholds for critical systems or applications that require high availability.
Intelligent Alerting Features for Enhanced Efficiency
Modern monitoring tools come equipped with advanced alerting features that cut through the noise, ensuring you only receive actionable notifications:
- Dynamic thresholds: Instead of static limits, thresholds adapt to normal network behavior patterns. This reduces unnecessary alerts caused by routine fluctuations and allows you to focus on genuine issues.
- Alert correlation: Intelligent systems group related alerts into a single, actionable notification, pinpointing the root cause of problems rather than flooding you with alerts for each symptom. For example, rather than separate alerts for high latency, packet loss, and application failure, you might receive one alert identifying a router malfunction as the cause.
- Escalation procedures: Critical alerts are automatically routed to the right teams or individuals, ensuring urgent issues are addressed promptly. Escalation paths can be tailored to your organization’s structure, ensuring that no critical problem goes unaddressed.
Integration Capabilities for Streamlined Incident Management
An effective alerting system doesn’t operate in isolation—it integrates seamlessly with incident response platforms like PagerDuty or ServiceNow. These integrations automate the escalation process, streamline workflows, and ensure rapid resolution. From the moment an alert is triggered, it can be routed through your incident management system, assigning tasks, notifying the appropriate stakeholders, and tracking the issue to completion.
Wrapping Up
Mastering the five key concepts of network monitoring—discovery, mapping, monitoring, reporting, and alerting—is essential for building a resilient, high-performing network. These practices provide the visibility to uncover blind spots, the control to address vulnerabilities early, and the insights to make strategic, business-aligned decisions.
A strong network monitoring strategy ensures smooth operations while empowering organizations to adapt and thrive in an ever-changing digital landscape. Proactive alerts minimize costly downtime, and actionable reports optimize performance, protecting and enhancing your IT ecosystem.
With a strong foundation in these 5 core concepts, the next step is understanding the key metrics and protocols that keep your network running efficiently. Learn which data points matter most and how to collect them for deeper insights.

Subject matter expert in IT and Managed Services with 20+ years of experience across NOC operations, product management, and service delivery.


Subscribe to our blog
Get articles like this delivered straight to your inbox