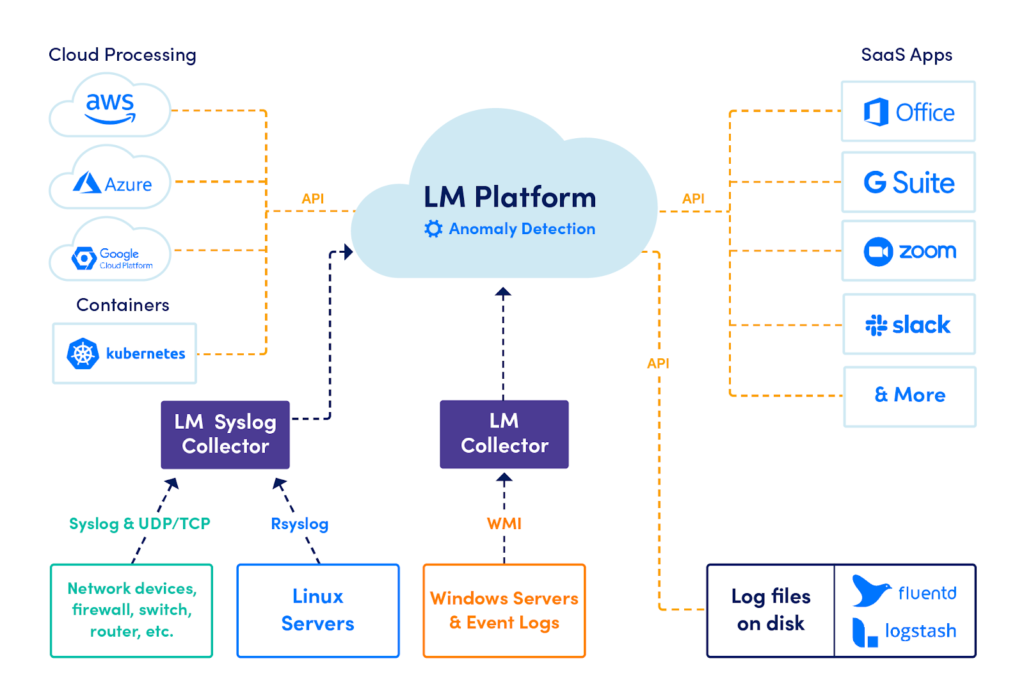
Sifting through logs in real-time or post-mortem to pinpoint the problem can take hours – and is often like trying to find the needle in the alert/log haystack. Further, keeping the troubleshooting process efficient can be a challenge due to context switching and relying on manual interpretation of events and technology-specific knowledge. LM Logs centralizes all of your log data and IT infrastructure performance metrics in a single, unified status-based platform, so you can answer what is happening, where it is happening, and why it is happening.
Keep reading to understand the benefits that the LogicMonitor technical operations team has experienced with LM Logs and how it can directly apply to the log challenges facing today’s greater ITOps and DevOps teams.
TechOps at LogicMonitor
The mission of the TechOps team at LogicMonitor is to build, scale, and maintain a reliable computing platform, which provides the LogicMonitor service for customers. Their work can be classified into two major categories:
#1- Making the customer experience better by improving service availability.
#2- Making their co-workers’ jobs easier by scaling or automating processes, actively tuning alerts, and fulfilling requests from other departments.
Goals include providing LogicMonitor service reliably for customers, achieving awareness of disruptions either potential or before customers notice them, spending time in the proactive zone versus reactive zone, avoiding the accumulation of technical debt, and utilizing LogicMonitor to ensure the reliability of LM servers.
Log Analysis With LM Logs
Logs are records of events that happen in computing systems, either by a person or by a running process. Logs help track what happened and troubleshoot problems — they are a critical part of monitoring coverage for any application or time series metrics.
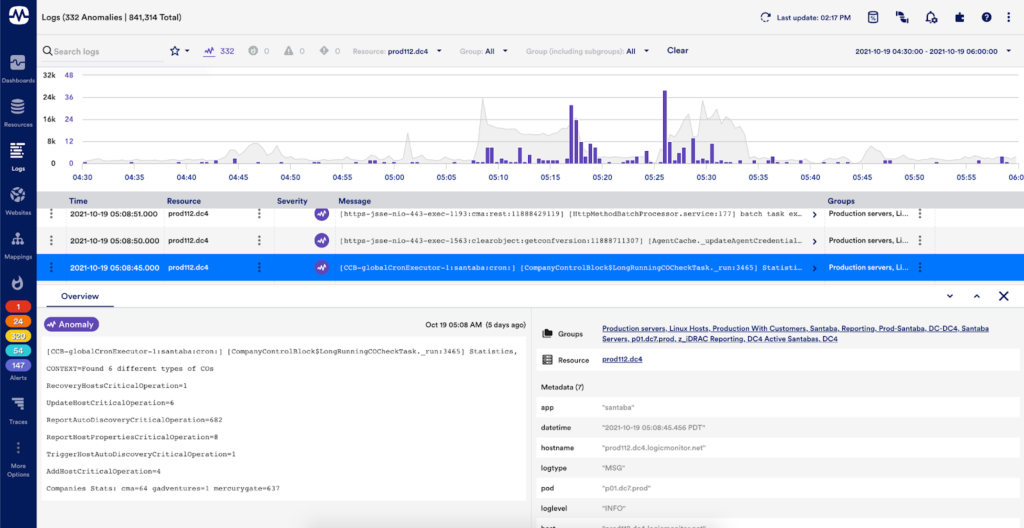
Reviewing logs is challenging, time-consuming, and oftentimes requires expertise to understand them. Insert LM Logs. LM Logs utilizes a powerful patented algorithm to automatically analyze every element of a log, data, and event at the time of ingestion without the need to learn proprietary search query languages. LM Logs takes a centralized log aggregation approach a step further by proactively identifying anomalies in logs and escalating these events automatically. In addition, log-in metric data is truly integrated – meaning log data can be analyzed in context immediately from any performance metric dashboard or graph.

How LM Logs Adds Value for ITOps and DevOps Teams
LogicMonitor believes logs should be accessible and painless for every Ops team, accordingly, LM Logs is the first solution that has been built with IT Operations and DevOps teams in mind. Let’s dive deeper into examples of how the LM TechOps team has benefitted from integrating LM Logs that has ultimately led to a decrease in MTTR, a decrease in the amount of time required to determine a root cause analysis, and a focus on performance or availability impacting log events immediately without having to decipher what is normal or abnormal.
#1- Resolving Hardware Issues When a Kafka Broker Stops
The team encountered a server that was still functioning but the Kafka broker had lost leadership and was not properly replicating data. Before LM Logs, the application logs from Kafka itself were useless in determining the cause of the problem and many hours were spent by multiple people trying to figure out exactly what the problem was. After LM Logs, the team received an alert for the same issue on a different server. This time, they discovered the problem immediately, not from institutional knowledge but rather from LM Logs surfacing the log message along with the alert. Having metric-based alerts alongside anomalous log messages surrounding the event timeline brought clarity to the situation.
#2- Discovering the Issue for TSDB and a Decrease in RCA Time
A multi-tenant TSDB server had stopped consuming messages from Kafka. This server provided service for over a hundred and fifty different customers. Normally, diagnosing a situation like this would require sophisticated log aggregation queries by someone well versed in the application server logs. Before LM Logs, this issue could take hours or days to investigate if a root cause could be surfaced at all. After LM logs, the root cause analysis process was able to be tracked down to a single customer. Over the course of only 80 minutes, 91 anomalies were found, out of 6.2 million log lines, meaning only .0000145% of the logs during this time period were relevant to the problem. Thanks, LM Logs.
#3- Finding the Needle in the Haystack and Decreasing MTTR
Operations teams must be able to proactively identify issues when customers experience a performance issue related to a capacity constraint. In this instance, an on-call engineer received a metric-based alert indicating response time had degraded. Occasionally, reading through the actual logs is required to surface an issue and before LM Logs, this was not feasible with 800,000+ messages to scroll through. After LM Logs and upon fielding the alert, the on-call engineer was able to quickly view the related log anomalies. The log anomaly revealed a bug that required manual intervention to resolve in the short term, but it also provided the data required to create a follow-up action for preventing this issue in the future. In this case, log anomaly represented .04% of the total log volume during the 90 minutes, where the performance issue was discovered.

All in all, LM Logs centralizes all of your log data and IT infrastructure performance metrics in a single, unified status-based platform. It automatically detects and surfaces log anomalies utilizing powerful algorithms and removes labor-intensive analysis. LM Logs significantly reduces troubleshooting and root cause analysis times, avoiding incident war room scenarios, and helps to not only understand what the cause is, but what needs to be fixed to resolve the issue for good.
To learn more about how LM Logs can help your teams decrease troubleshooting, streamline IT workflows, and increase control to reduce risk, check out this on-demand webinar.
Subscribe to our blog
Get articles like this delivered straight to your inbox


