LogicMonitor vs Paessler (PRTG)
Upgrade to LogicMonitor for seamless scalability, real-time insights, and proactive monitoring. Customers who switch from PRTG gain complete visibility, advanced analytics, and automated alerts—all in one platform. Say goodbye to monitoring limitations and hello to a smarter, more efficient way to manage your network.
A hybrid observability platform powered by AI
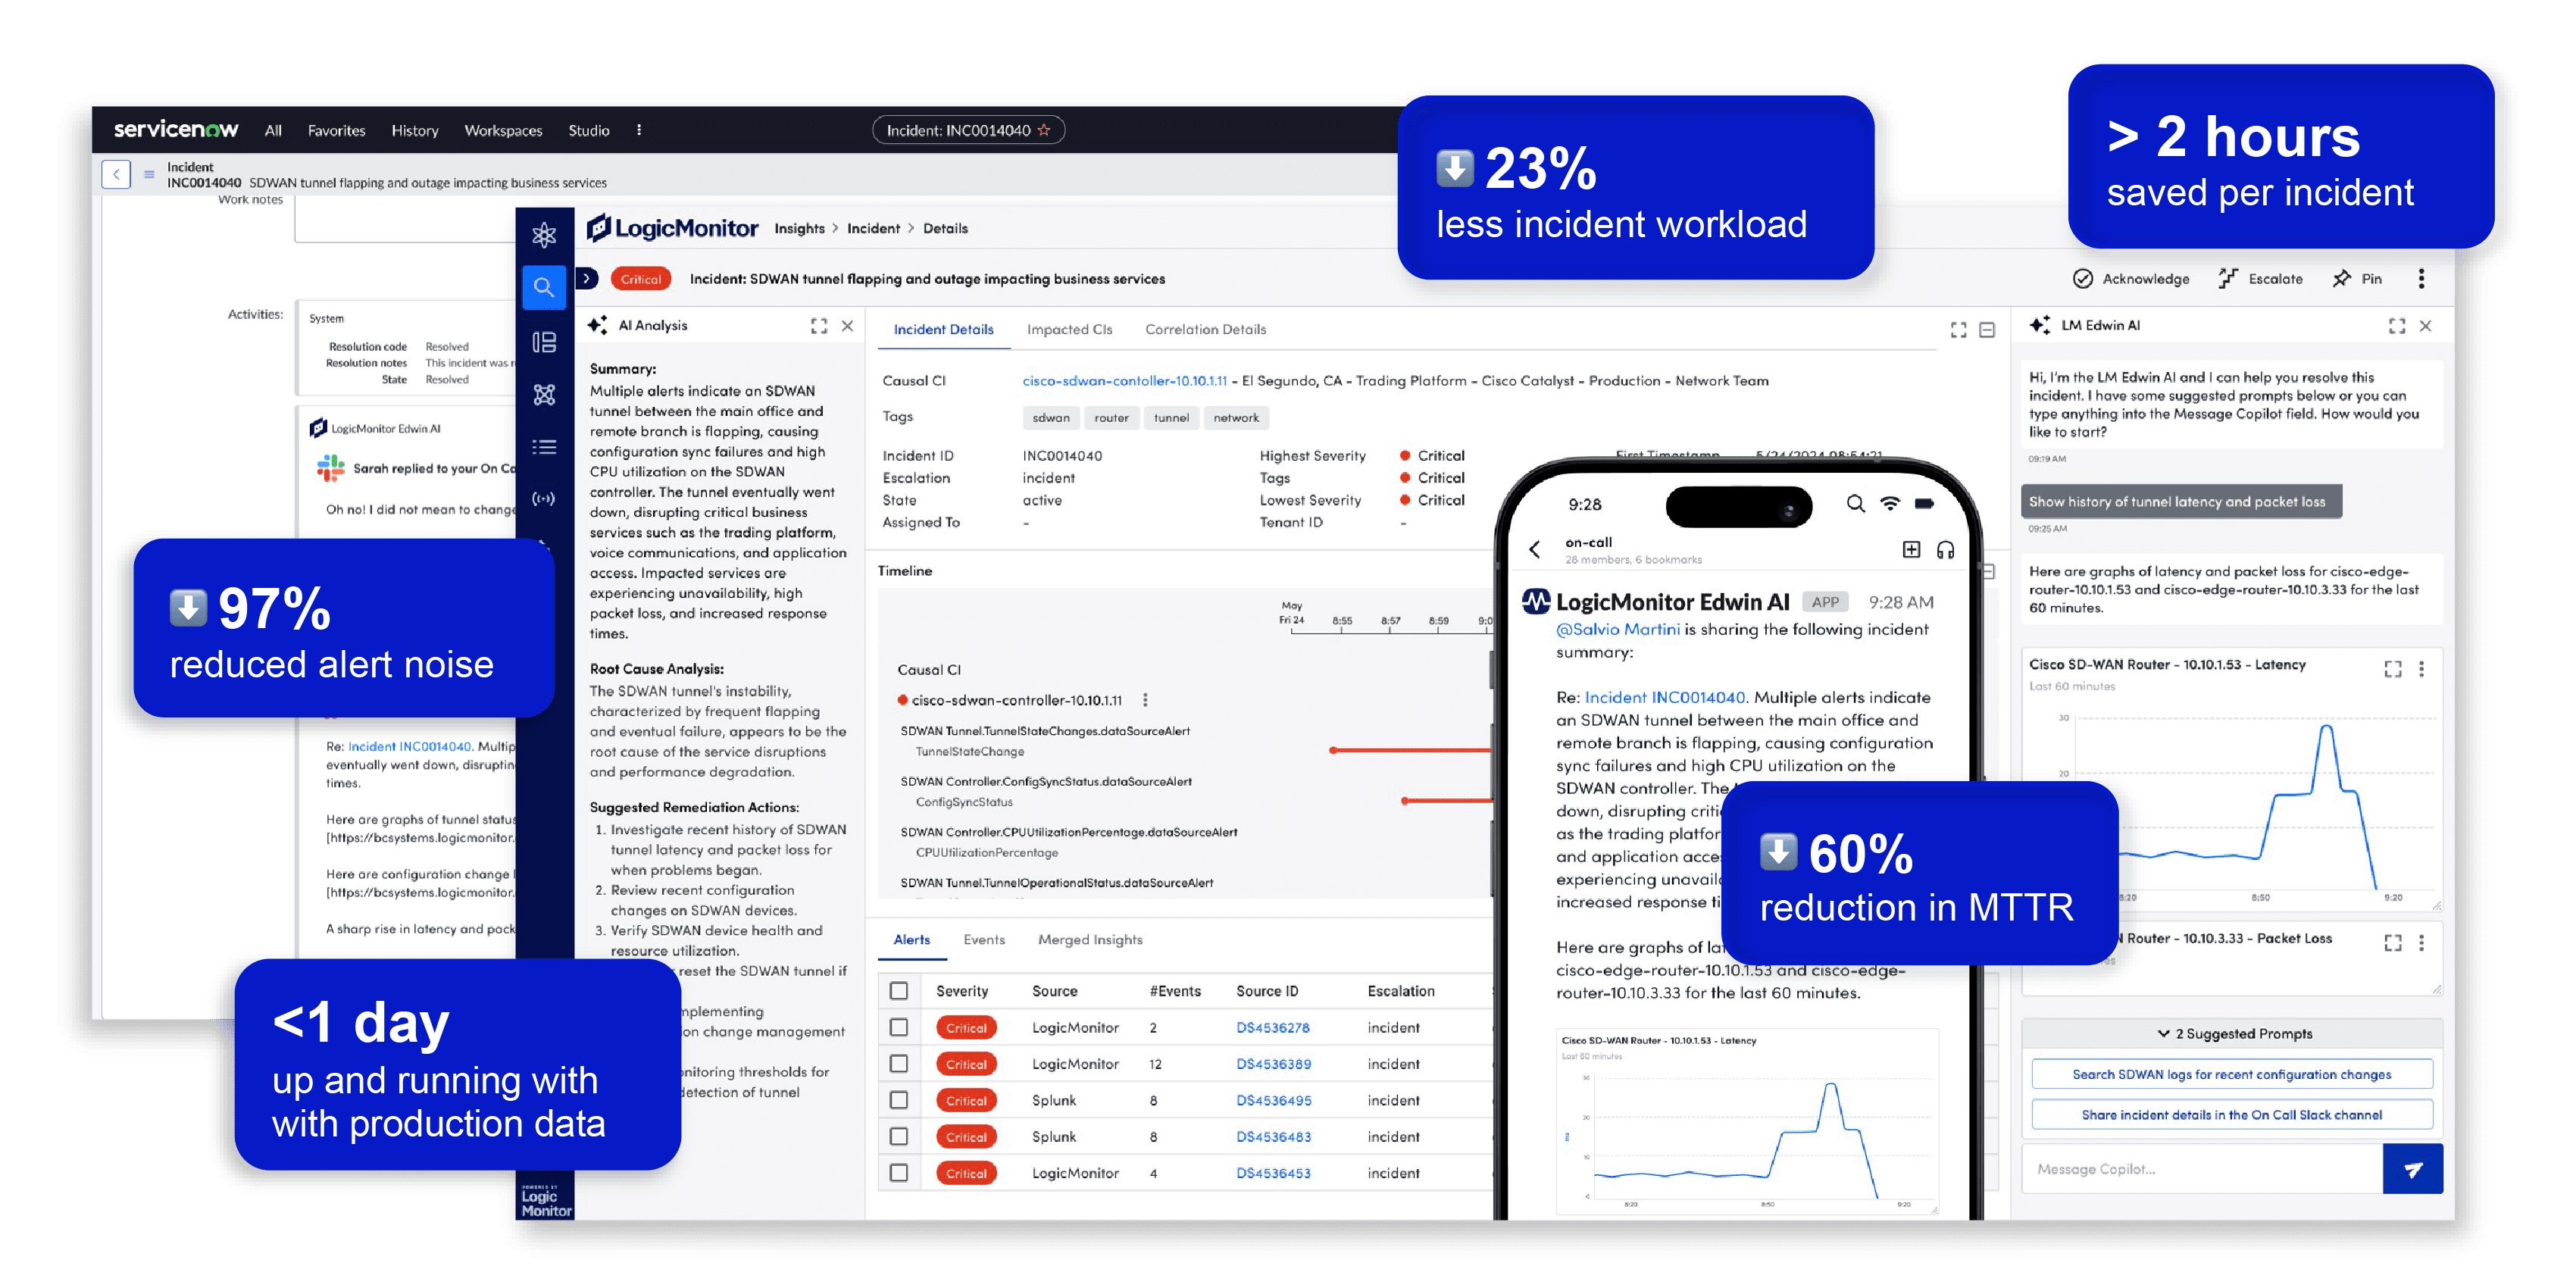
LogicMonitor customers who have switched from PRTG have reduced alert noise by up to 97%, improved MTTR and reduced tool sprawl
- Single pane of glass with full context
- AI-assisted incident resolution and prevention
- Actionable insights tied to business outcomes
- Enterprise scale platform
- Lightweight agentless collectors
- 3,000+ integrations out-of-the-box
Trusted by leading companies







Benefits of LogicMonitor vs. PRTG
| LogicMonitor | Paessler PRTG |
|---|---|
|
Highly scalable and enterprise ready with unlimited device capacity |
Limited scalability over 500 devices |
|
Lightweight, agentless collectors support HA |
Legacy remote probes do not support HA |
|
Proactive actionable insights for faster MTTR |
Reactive firefighting |
|
AI built into the platform |
No AI |
|
Up to 97% alert noise reduction and event correlation with Edwin AI |
Overwhelming alert noise and no AI-assisted alert correlation. |
|
Hybrid observability |
Monitoring only |
|
Auto-closing of alerts |
Manual closing of alerts |
|
Proactively prevent downtime with forecasting |
No forecasting |
|
No surprise pricing and licensing changes |
Surprise pricing and licensing changes |
|
Pre-built dashboards to streamline workflows |
No pre-built dashboards. “Maps” must be manually created via drag and drop. |
|
High security standards including SNMP v3 security model |
Less secure SNMP v1 or 2 preferred (protocols are insecure and transmit data in the clear). SNMP v3 is supported, but severely hampers performance and scalability. |
|
3,000+ integrations including AWS, Azure, GCP, ServiceNow ITSM and CMDB. |
250+ “technology partners.” Limited device support, ServiceNow ITSM only and very limited public cloud coverage. |
|
Robust container monitoring including k8s, docker and AWS ECS |
No Kubernetes (k8s) monitoring |
|
Automated, dynamic built-in Topology mapping, |
Manual, static Topology mapping, not a built-in feature. Requires a separate tool. |
|
Ability to ingest, associate and fully search syslogs |
Limited ability to ingest, associate and make searchable syslogs |
|
24/7 high quality customer support & professional services, including chat and phone based support, plus an active community of LogicMonitor customers. |
Extremely limited professional service offerings. No chat or phone based support. |
|
Modern SaaS architecture built for scale in the cloud |
Built on legacy code |
|
Full featured modern REST-ful API |
Incomplete API, limiting automation and enterprise-level integrations (No API key support, URI’s must contain a user name and password, can’t directly create objects, plus can’t set many configuration options) |
DISCLAIMER: Feature comparison is based on each vendor’s most recent version available as of March 2025. Information is based on data collected from public websites and forums, third party validated customer reviews, analyst papers, and product datasheets.
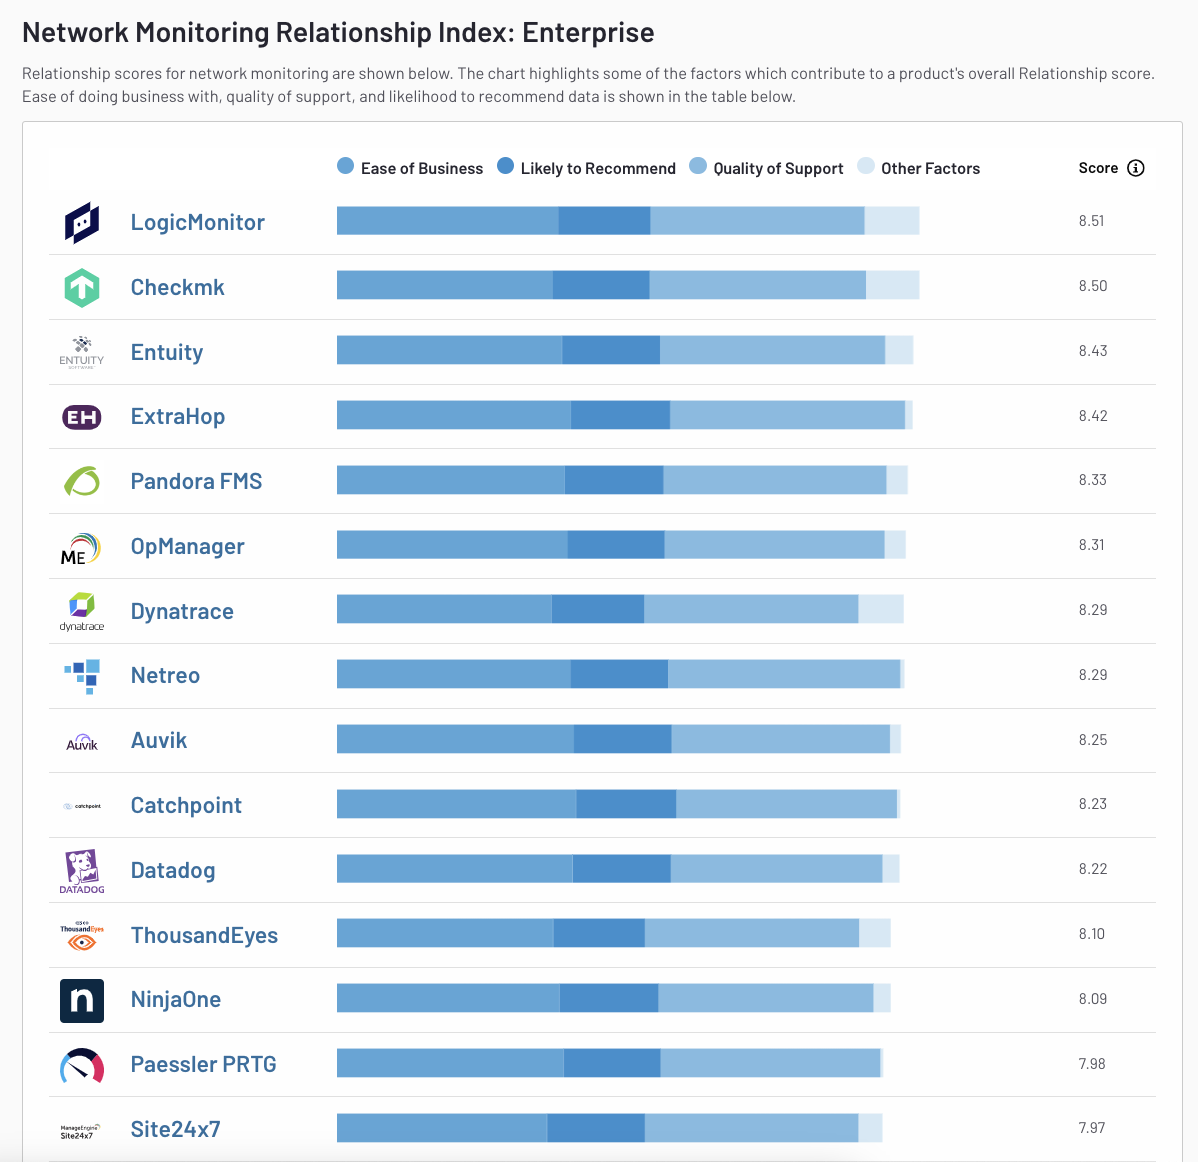
Our Trust Scores
Not just a platform. A true partner.


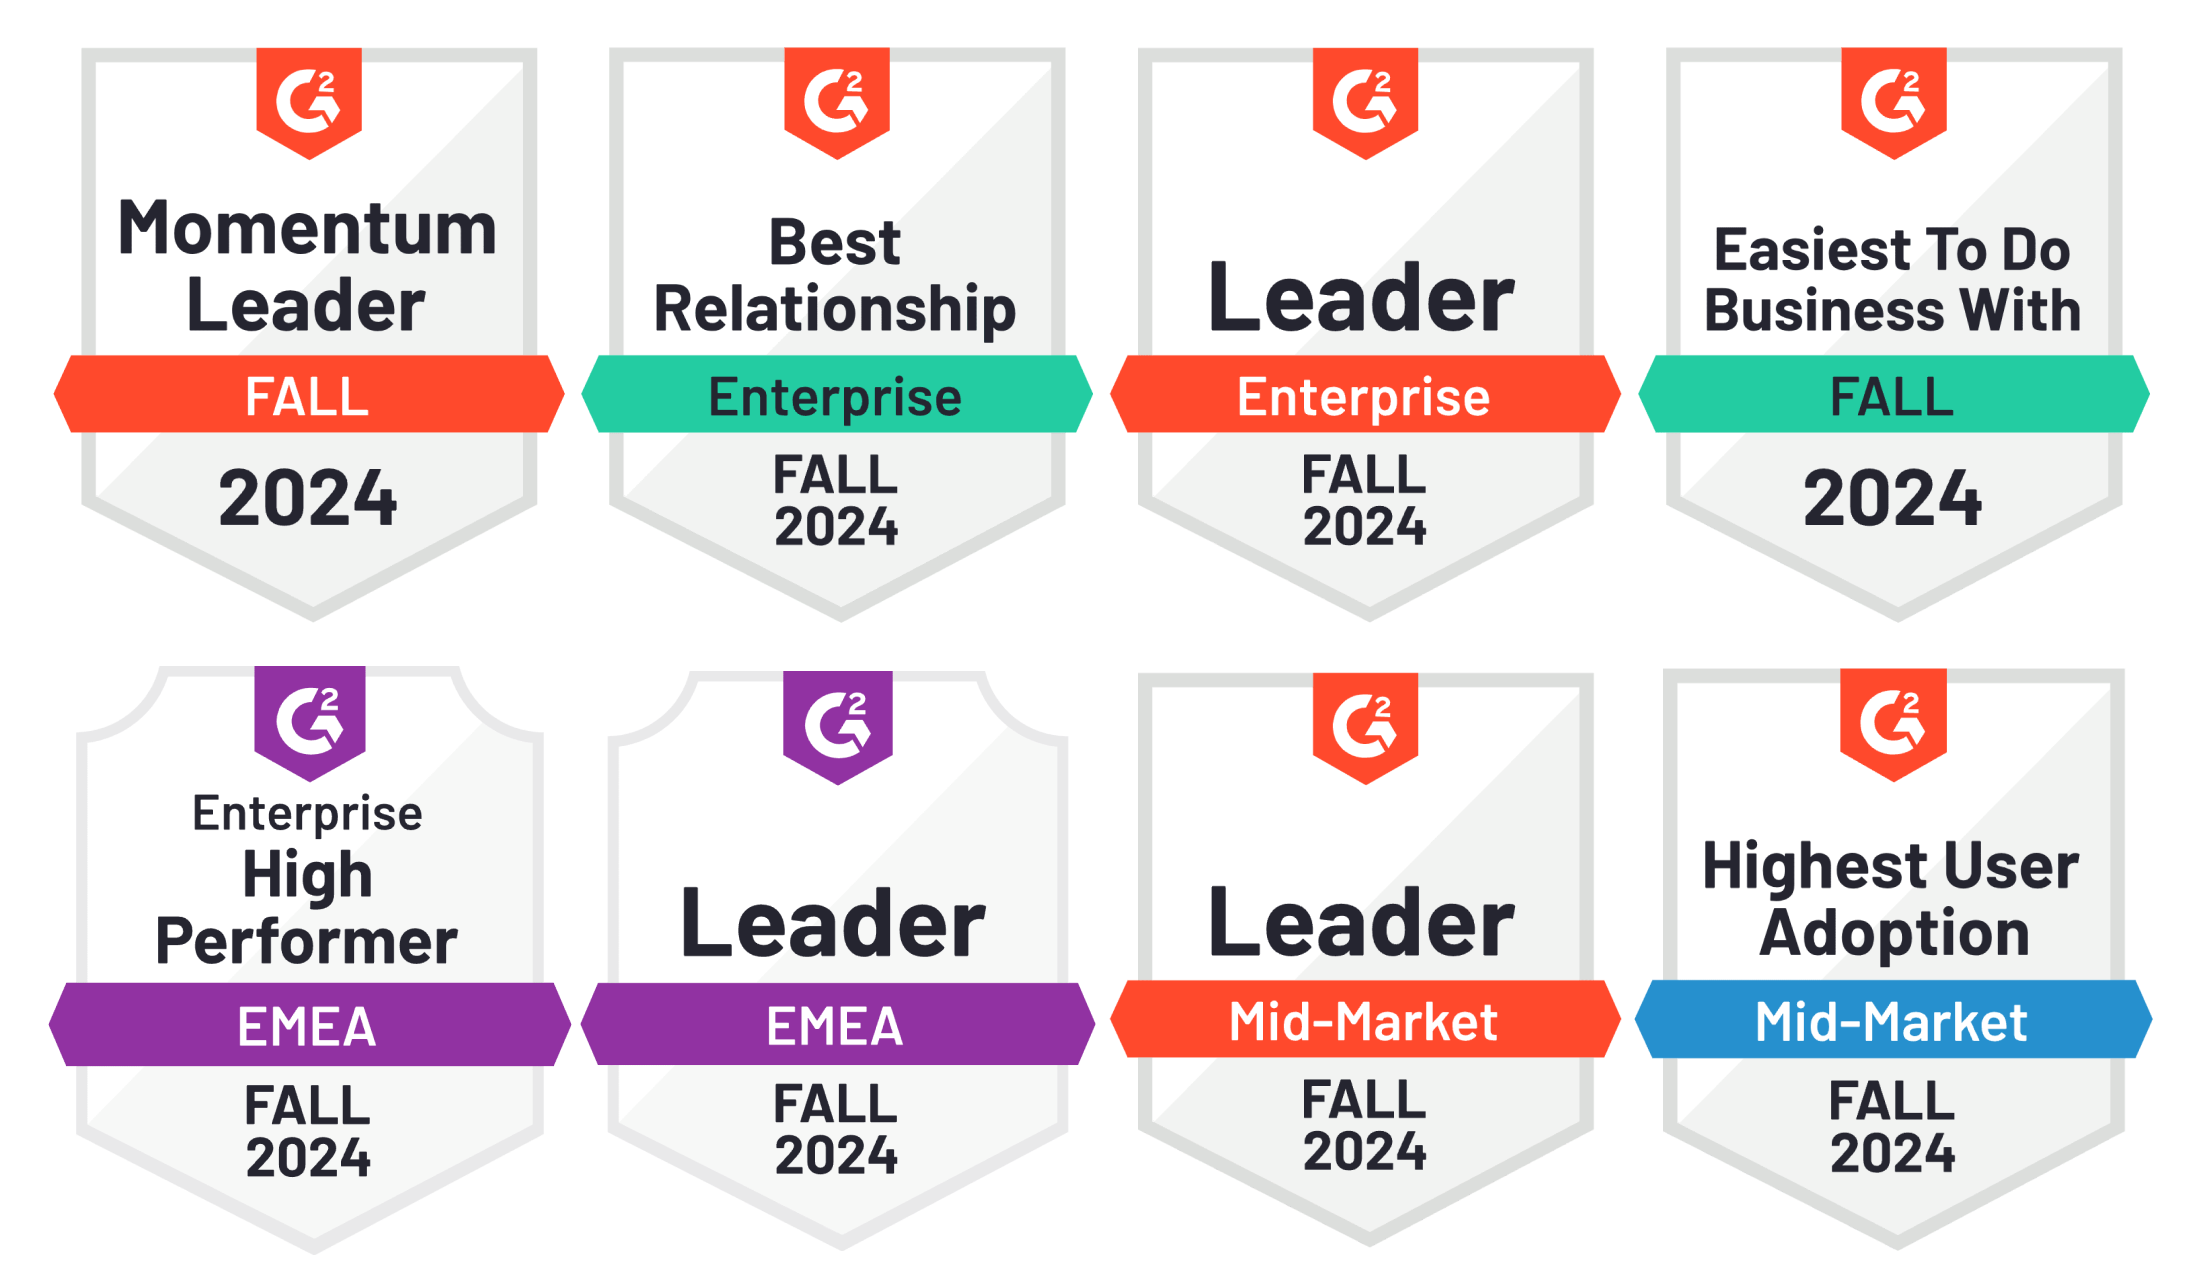
Rating from Gartner Peer Insights and Customer Satisfaction leader on G2
4.5/5
Rated “Excellent” and an “Editor’s Choice” by PCMag
Excellent
The highest NetPromoter score of any IT Infrastructure Management provider
Highest
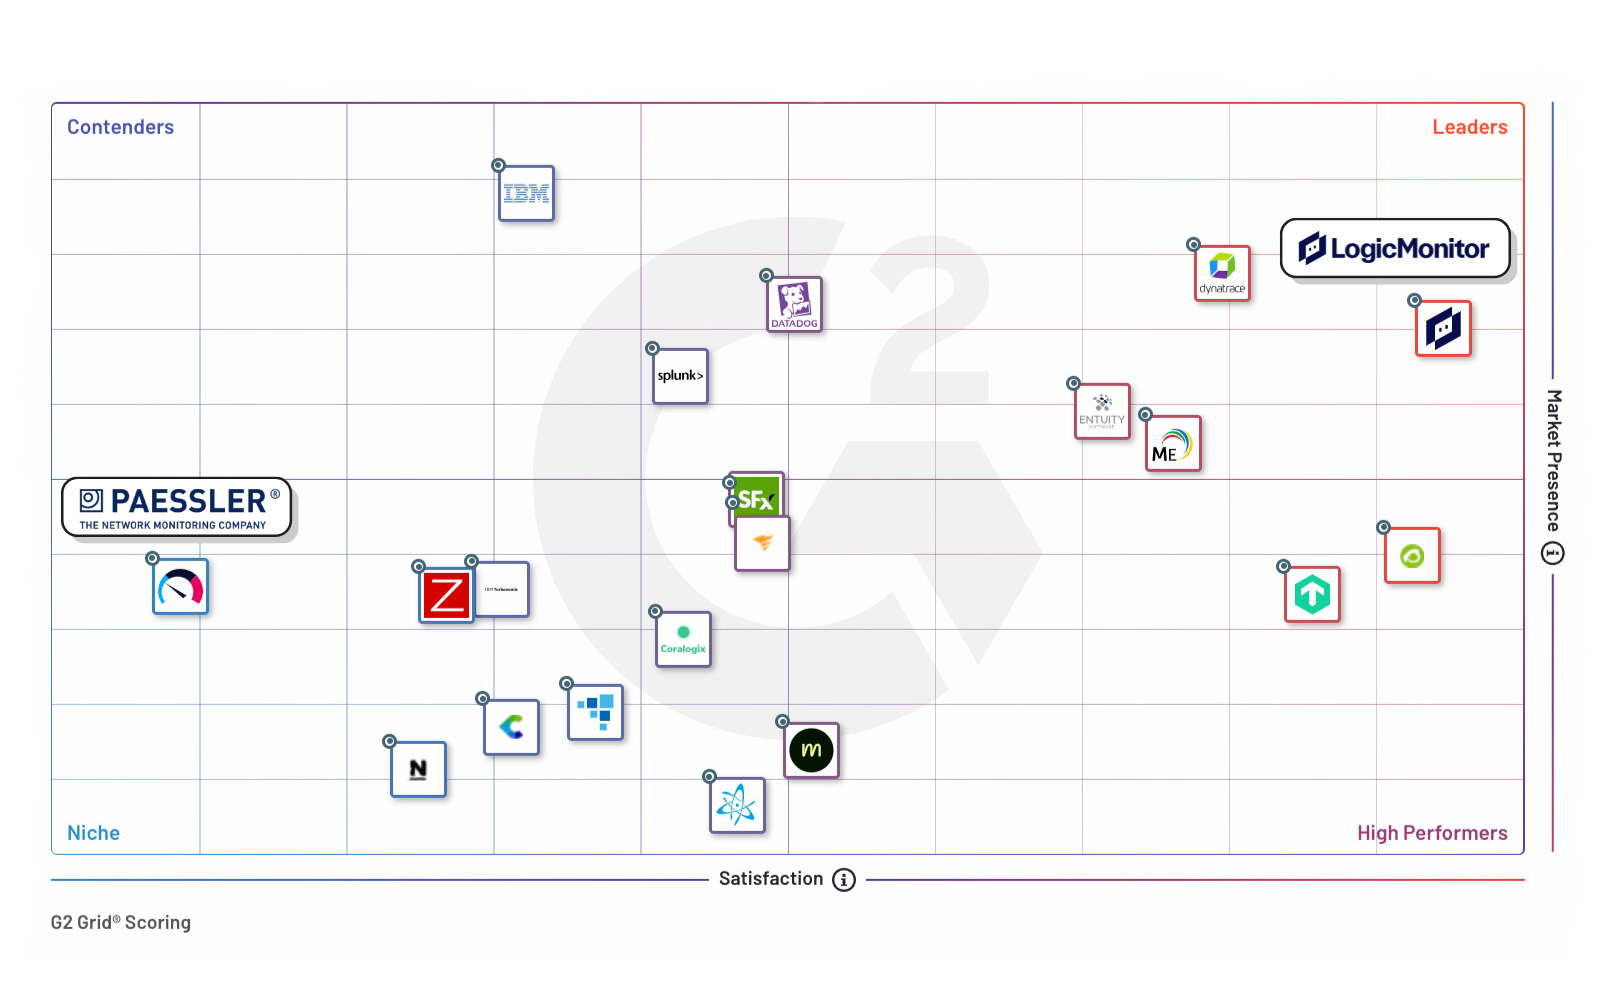
LogicMonitor vs. Other Competitors
Get Started
Contact us today to learn how LogicMonitor can help you shift your IT operations approach from reactive firefighting to proactive incident prevention.

