A Year in Review for LM Logs
A new year means a new set of goals. In 2022, we set some lofty goals to help our customers achieve clarity across their modern IT infrastructure. We set out to do this by improving our log collection and analysis within LM Envision, our hybrid observability platform, which was announced at LogicMonitor’s Elevate user conference this summer. At the conference, we gathered feedback to understand the various ways our customers access and review log data. The difference maker was in the ability to find the root cause faster and provide contextual analysis for front-line Ops teams. Our log analysis and searching options are now easier than ever to use, and customers have noticed the impact to their workflows and ability to innovate. Now it’s time to reflect on several product innovations and accomplishments within LM Logs and consider how we’ve helped our customers this year. We hope you’ll enjoy seeing some of the highlights from 2022.
Unified logs and metrics
Need to catch up on LM Envision’s unified logs and metrics workflow? LM Envision and LM Logs offer intelligent log analysis for all layers of the tech stack in hybrid and multi-cloud environments. LogicMonitor streamlines access to log data for Ops teams to provide contextual insights into the connection across IT devices and services, runs anomaly detection at time of ingestion to surface insights worth investigating, and reduces MTTR with rapid troubleshooting.
Key pillars of customer value
When we decide what to build, we make sure every product improvement hits one of three goals:
- Make it easier to use – consider what IT Ops teams can do with the knowledge instead of simply learning how to use the software
- Provide quick value – ingesting log data into LM Envision should show immediate benefits from contextual analysis and insights
- Integrate seamlessly into existing IT Operations workflows – log analysis should naturally flow into the next stage in LM Envision to take action, remediate a problem, or improve your proactive monitoring and alert conditions
Let’s explore the main ways that LM Logs improves IT Ops workflows.
Make it easier to use: usability improvements
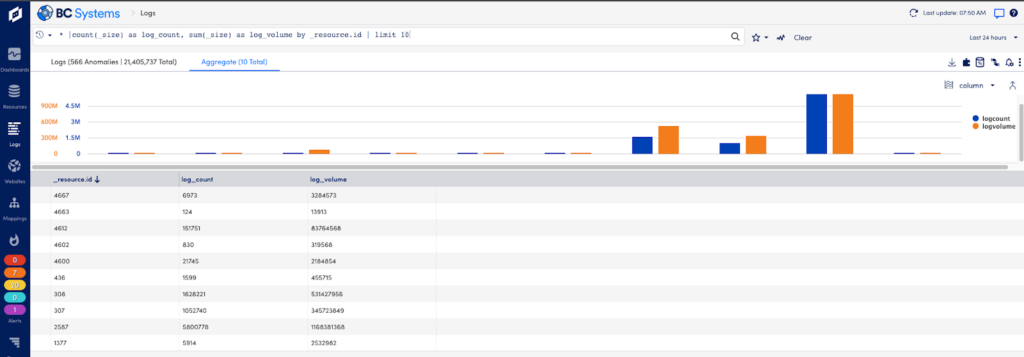
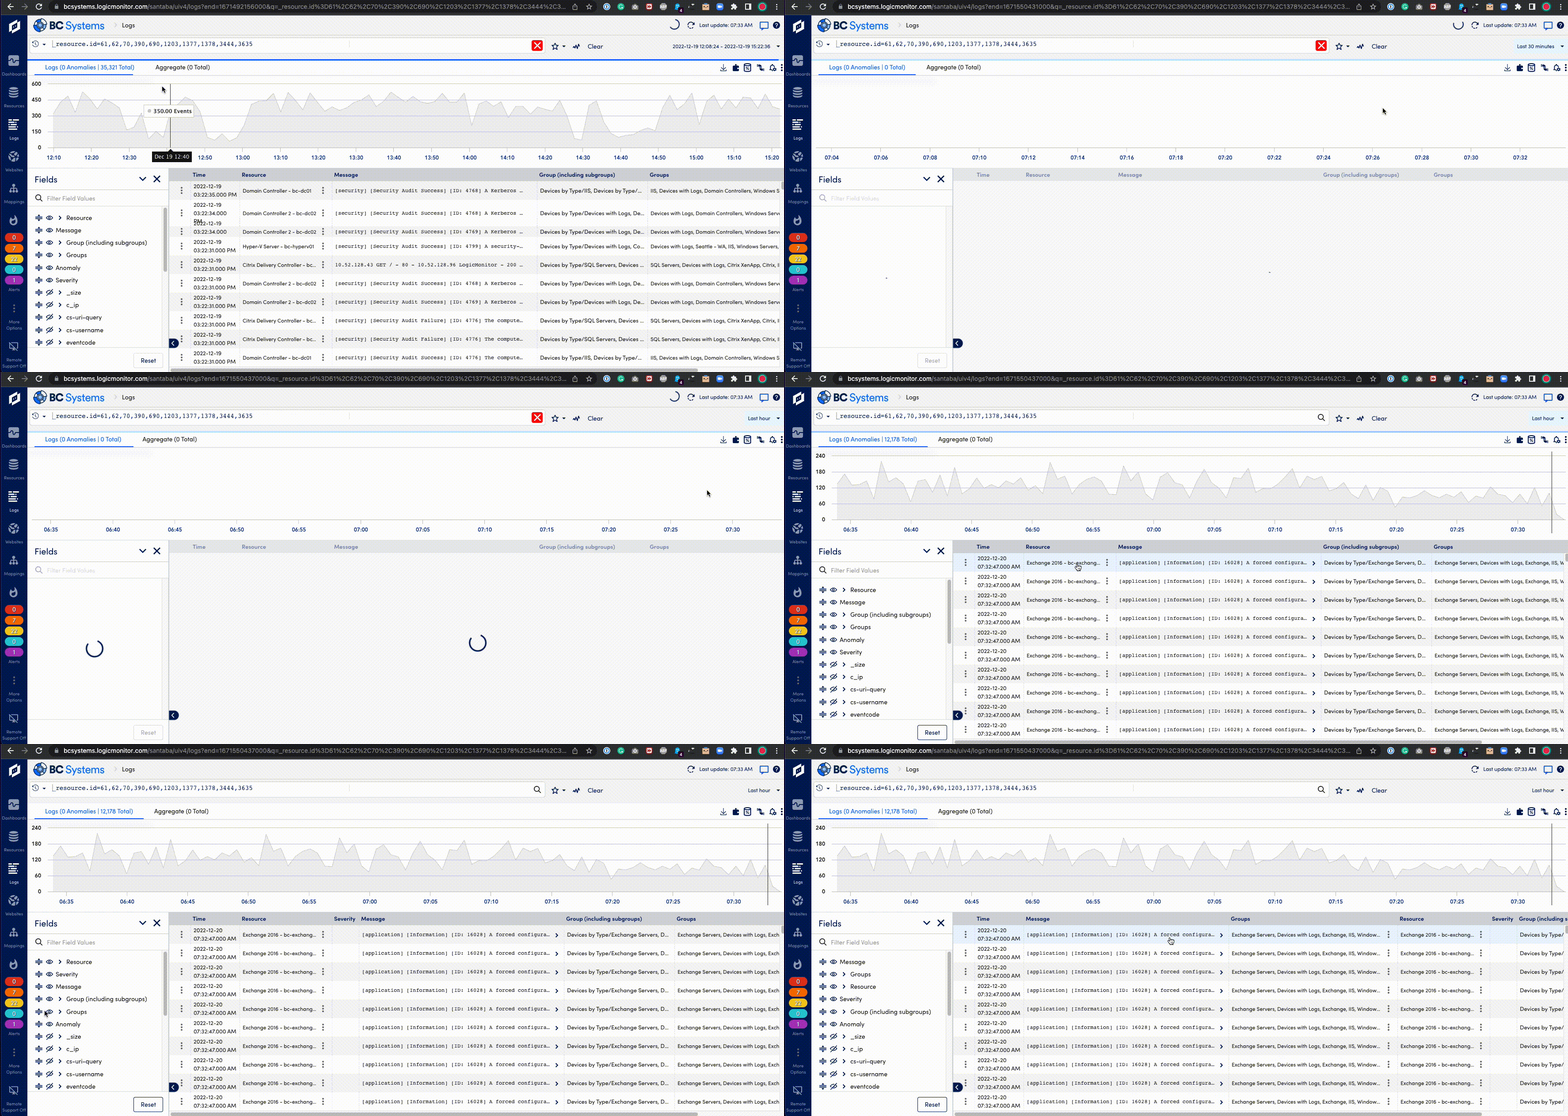
LM Logs now offers several feature enhancements to make log analysis easier for Ops teams. Logs tables and graphs load asynchronously for faster loading for devices that emit large amounts of logs. Additionally, selecting a time range for analysis runs log queries automatically. Log event columns in the aggregate results view can be sorted in ascending or descending order with a single click, eliminating the need to define sorting parameters in the query. These usability improvements add on to the existing query and searching capabilities that support Ops teams and help them focus on what matters.
Provide quick value: advanced search
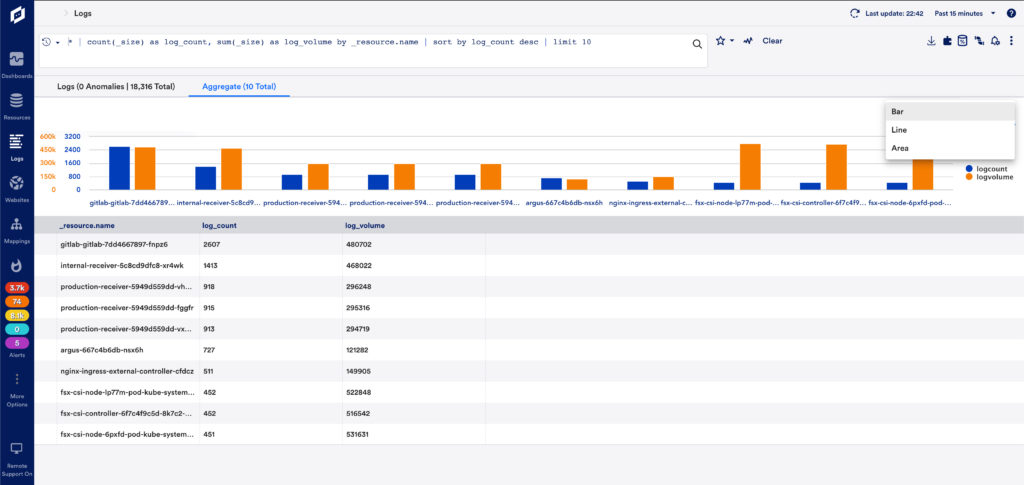
LM Logs provides a starting point for analysis with keyword and autocomplete search, and advanced searching includes new operators for aggregate results. Advanced searching now allows users to apply additional filtering by using aggregation functions such as average, minimum, maximum, and sum. This allows users to see a total count of search results in the aggregate tab, giving a comprehensive overview of their log data.
LM Logs also offers multiple visualization options such as bar, line, and area graphs to display aggregate results – with more options coming soon. Customers can now gain more insights when visualizing log data results to easily detect any potential issues and take appropriate action.
Finally, users can use the new timeslice aggregation function to group log query results by fixed time intervals (such as minutes and hours) to more accurately examine and analyze their log, allowing them to quickly identify and remediate any IT issues.
Integrate seamlessly into existing IT Operations workflows: alerting
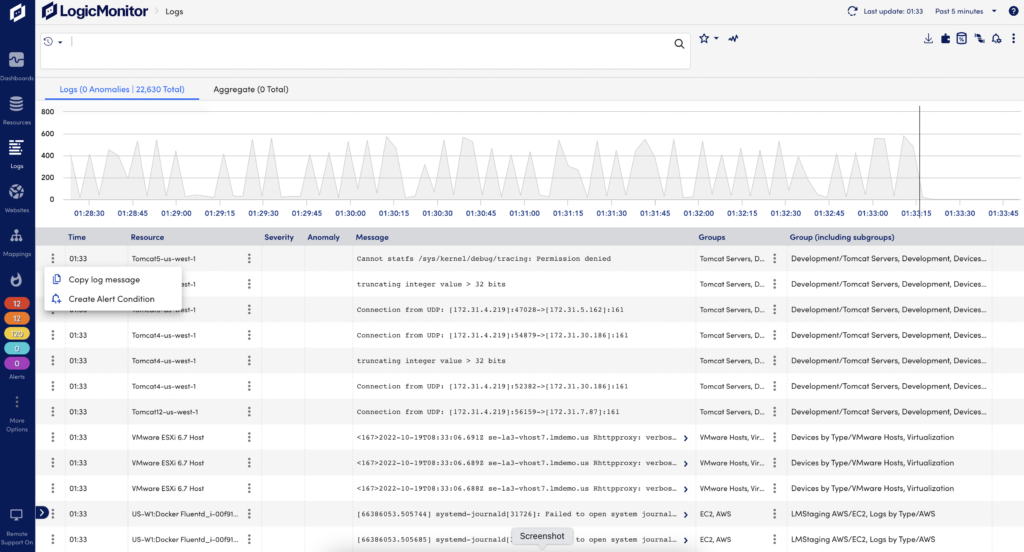
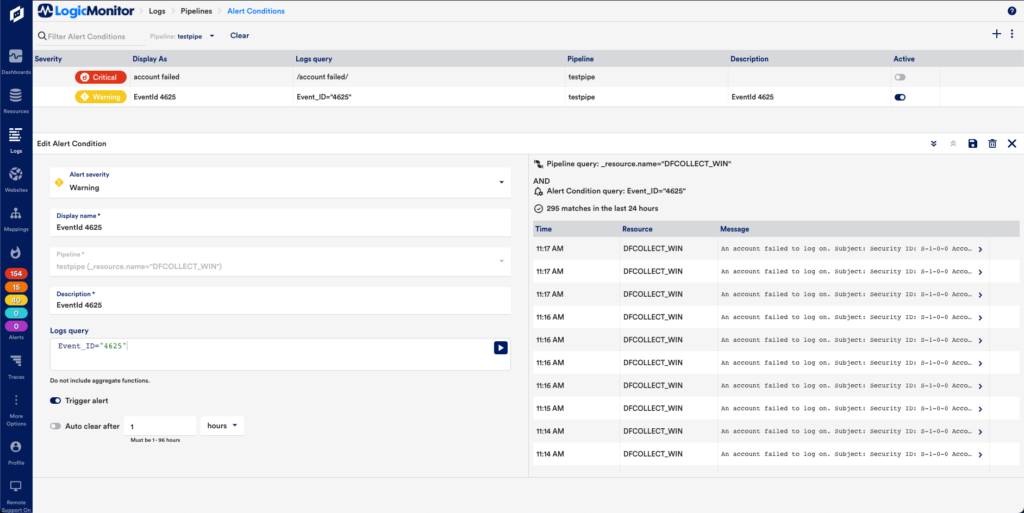
Another product innovation we’re focusing on is minimizing noisy IT alerts within LM Envision. Users can create log pipelines – directly within the LM Logs tab – to extract meaningful data from their log data sources and define and create alert conditions that notify when certain logs are received. This contextual workflow within LM Logs helps users quickly create, test, and refine log pipelines and immediately create specific conditions that trigger LM Envision alerts when certain events or anomalies occur within the log data. This control over alert conditions creates a more tightly integrated workflow within LogicMonitor’s platform between logs and metrics, allowing customers to take advantage of its powerful log analysis capabilities to make faster and better informed decisions.
Enhanced Log data retention
LM Logs has always enabled customers to access their historical data for fast analysis. To further support customer needs, LogicMonitor now offers multiple options for data retention to ensure customers have access to the data they need when they need it, without having to worry about limits. Seamlessly uniting on-demand historical log data with the rest of LM Envision’s metrics and logs adds clarity across IT.
This past year, we had the pleasure of seeing many of our customers get tremendous value out of LM Envision’s unified logs and metrics workflows. Here are just a few of the successes we witnessed throughout the year, thanks in part to the product enhancements for our logging capabilities.

Schneider Electric reduces MTTR and alerts by 40%
Schneider Electric, a multinational energy management organization, reduced their MTTR of IT incidents and reduced alerts by 40%, thanks to LM Envision’s unified logs and metrics workflow. Schneider Electric found value quickly after configuring setup for log analysis. Sankeet Lokhande, Senior Engineer at Schneider Electric, said that the out-of-the-box “anomaly detection has helped us get to the root cause quickly” and “dynamic thresholds and AI forecasting let us pinpoint the issue and troubleshoot. Otherwise we’d waste hours reviewing stuff manually.” LM Logs helped Schneider Electric ensure system uptime and reliability, as well as provide teams with timely, accurate data. Accessing log data within a dynamic observability platform is invaluable for a company as large as Schneider Electric, supporting 20,000+ network and cloud devices.
Read the full case study: https://www.logicmonitor.com/resource/schneider-electric-consolidates-monitoring-tools-by-83-with-logicmonitor
Loyola University of Maryland saves $3k per year in tool consolidation
Loyola University of Maryland, home to more than 5,000 students, is now saving almost $3,000 per year after consolidating tools with LM Envision. Loyola University gained immediate visibility into their campus network performance across their hybrid IT environment with LM Logs. Loyola University also consolidated their hardware switches after LM Logs provided a centralized repository for their aggregated log data for easy analysis. According to Mike Dieter, Senior Systems Engineer, LM Logs helped ensure system reliability and “free up time to spend on things that add value back into our operations, instead of trying to figure out why this isn’t working.” Mike also saved precious time with LM Envision’s integrated workflow to save searches, create log pipelines, and refine log alert conditions.
Read the full case study: https://www.logicmonitor.com/resource/loyola-university-maryland-connected-campus
RaySearch Labs of America reduces MTTR by 60%
RaySearch Labs of America is advancing cancer treatment through their innovative research software. John Burriss, Senior IT Solutions Engineer, found their previous log analysis solution inefficient and time-consuming for troubleshooting, but with LM Logs, MTTR time was reduced by 50-60% with faster root cause analysis. “50 to 60% of my time was spent looking through logs to find the issue,” said Burriss. “I didn’t have time to work on system upgrades or make sure users were having a good experience.” During the LogicMonitor trial, LM Envision’s log-based anomaly solution detected application configuration issues. RaySearch Labs continues to drive innovation by expanding visibility into potential issues in their cancer research applications with LM Logs.
Read the full case study: https://www.logicmonitor.com/resource/unified-observability-helps-raysearch-advance-pioneering-cancer-treatment-software
Preparing for 2023
As we look ahead to 2023, LogicMonitor will continue to invest in LM Envision’s unified logs and metrics workflows to strengthen ease of use, time to value, and integrated Ops workflows. Areas of focus in the new year include:
- Streamlined log data ingestion into LM Envision for various log data sources
- Improved dashboarding to visualize log data directly alongside IT metrics
- Smarter platform intelligence to surface log data in context throughout other workflows
- Creating log anomaly profiles for new insights into opportunity for analysis
- Improved reporting with actionable insights into log data usage and trends
If you’re still unsure how ingesting and analyzing logs in LM Envision helps your teams reduce MTTR, LogicMonitor makes it easy to trial and view this contextual data for your existing IT devices.
We are excited to deliver more product enhancements in LM Logs to further improve the overall Ops workflows within LM Envision. Check back soon for announcements from LogicMonitor as each new product capability is released.

Subscribe to our blog
Get articles like this delivered straight to your inbox


