LogAnalysis
Last updated - 01 June, 2026
Log Analysis is a LM Logs feature that automatically analyzes log data and presents insights visually. This helps you to investigate problematic logs without writing manual queries.
Log Analysis uses ML and AI techniques to analyze and categorize large volumes of logs, identify patterns, and assign sentiment scores to log messages. Higher sentiment scores help surface the most potentially impactful or problematic logs for faster review and troubleshooting.
Log Analysis is designed to accelerate troubleshooting workflows and make log analysis more accessible, especially in situations where basic filtering or Log Patterns do not sufficiently narrow the issue scope.
You can use Log Analysis after completing the following troubleshooting activities:
- Reviewing the alert Overview and Graphs tabs.
- Checking correlated logs and anomalies.
- Using Log Patterns to reduce unnecessary log noise.
- Launching Log Analysis for deeper automated insight into problematic log behavior.
When you start a Log Analysis session, all log messages are ingested and analyzed within the session. The Log Analysis page organizes log data into widgets, filters, graphs, pie charts, and a logs table to help you interpret trends, identify patterns, and troubleshoot issues more efficiently.
Log Analysis Visual Components
Log Analysis provides visual and interactive components that help you organize, filter, and analyze log data.
The following components are available in Log Analysis:
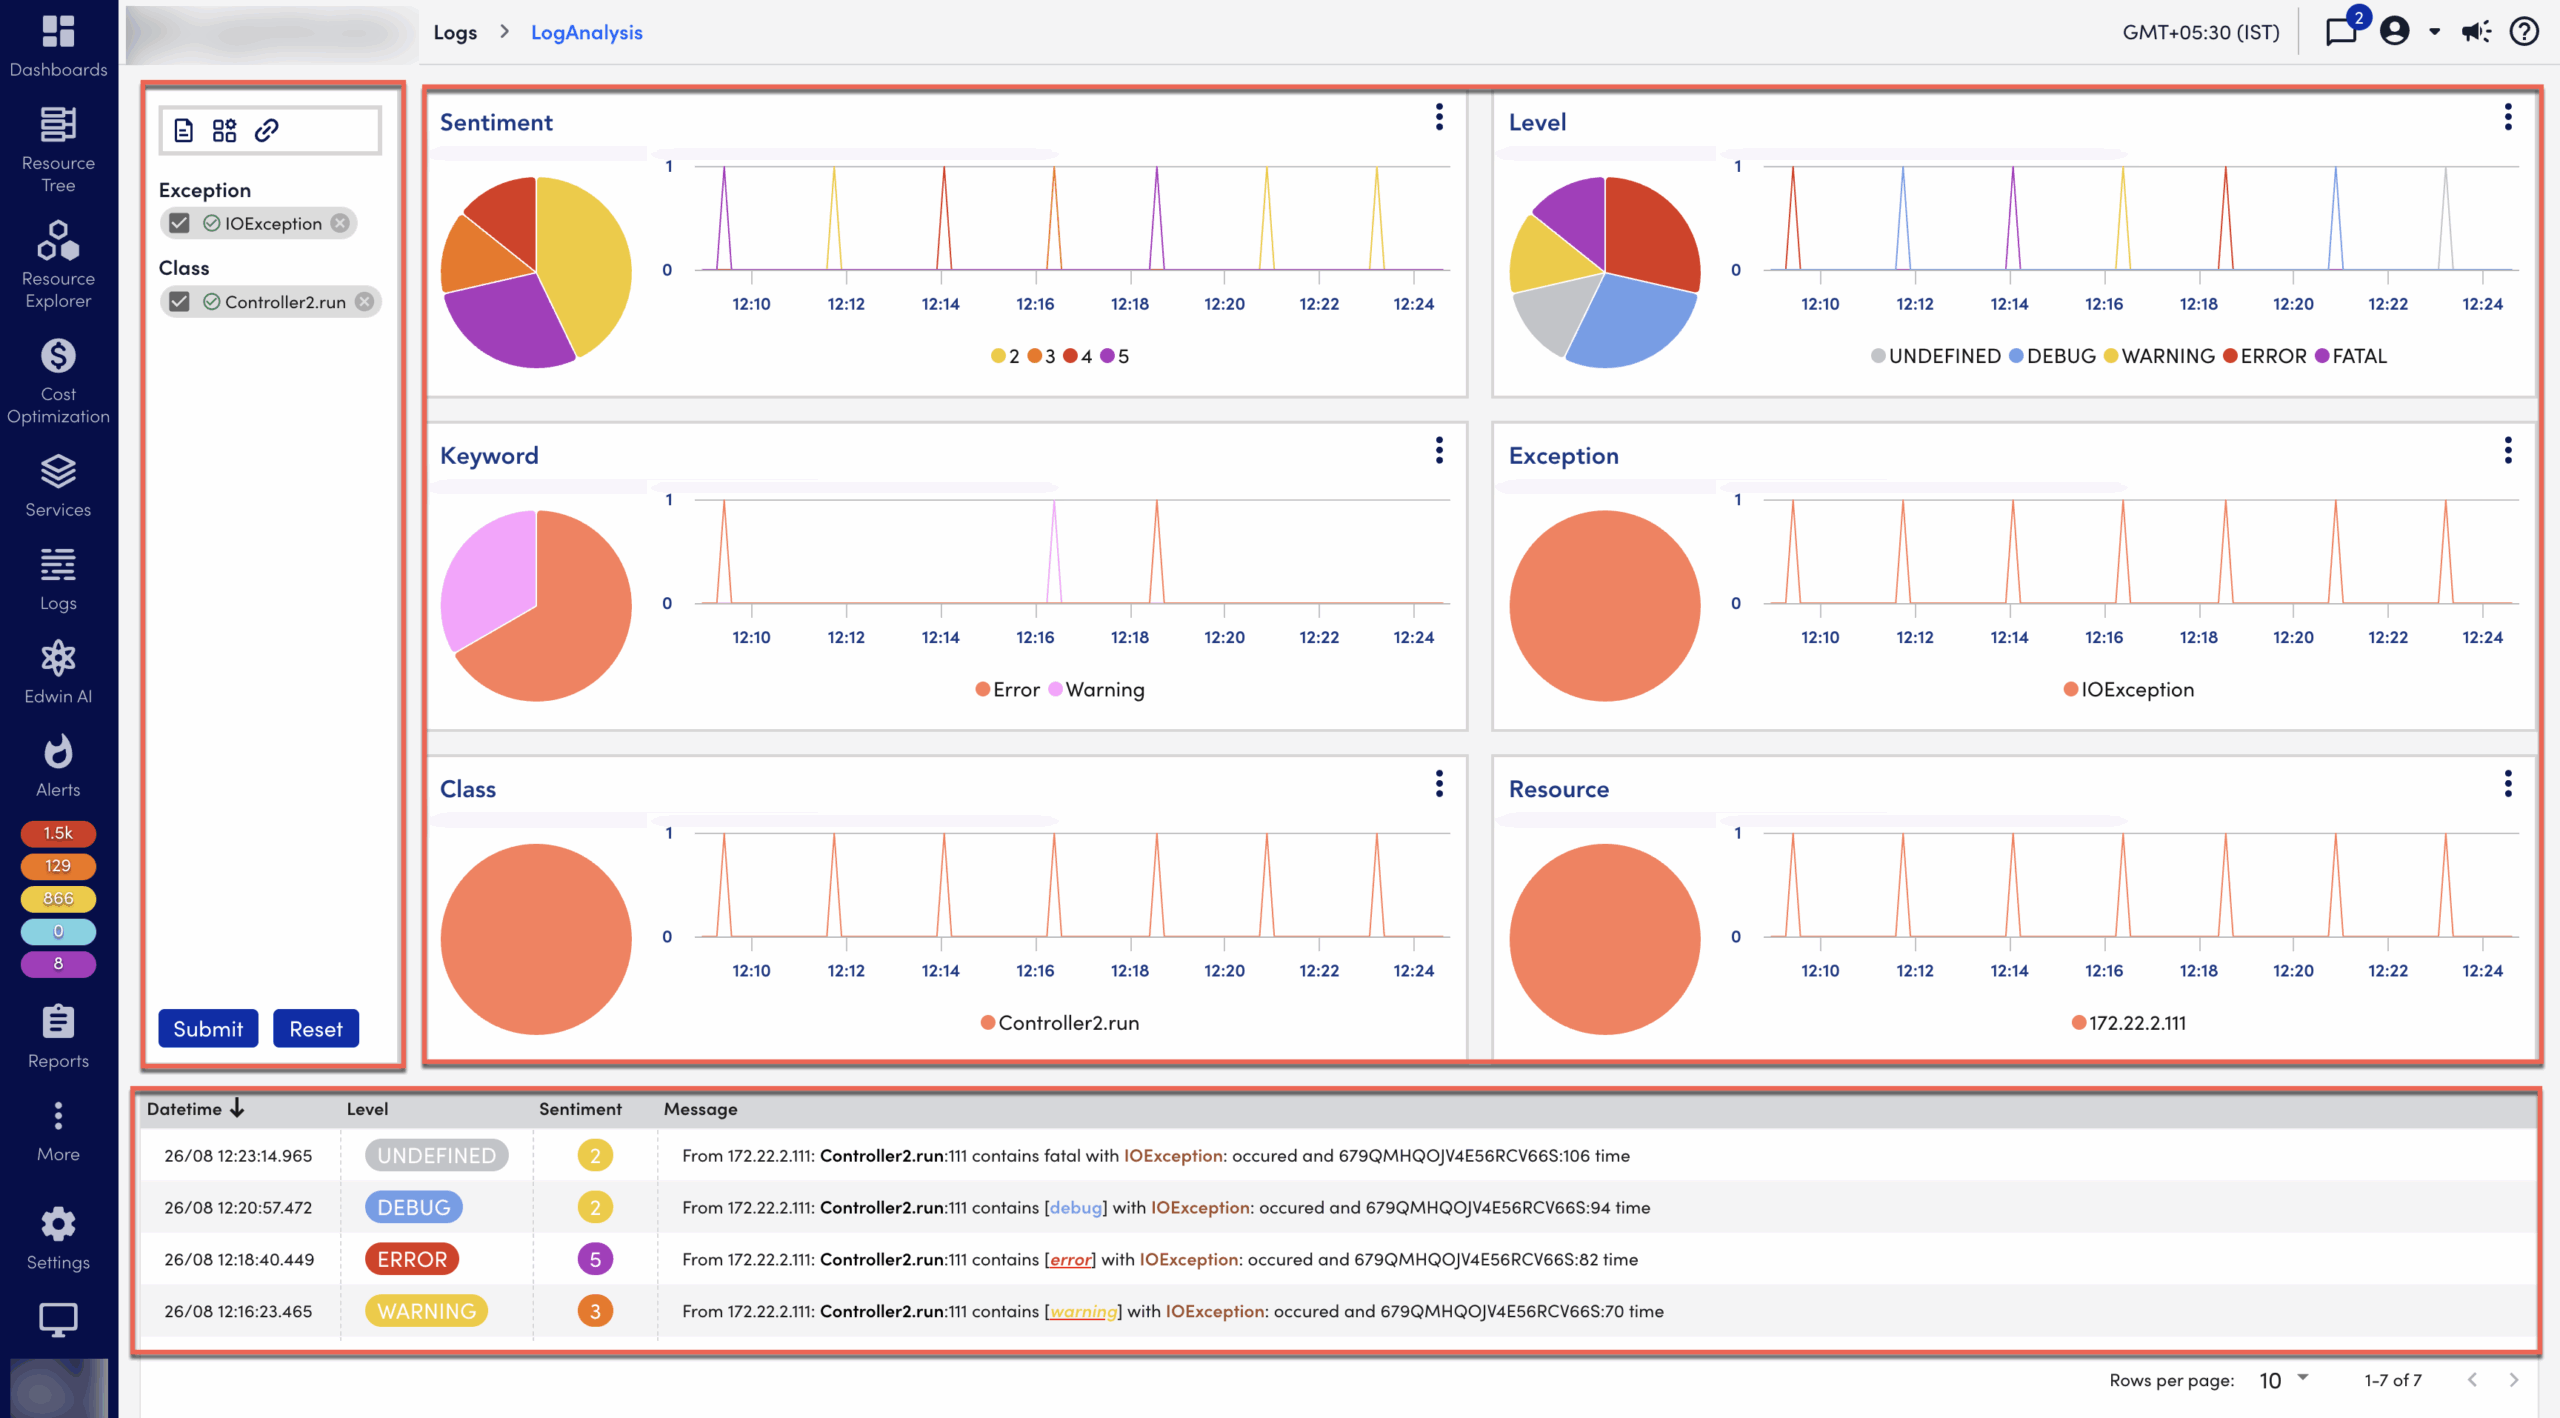
- Widgets—Visual graphs that organize logs into dimensions. A dimension is a category used to group and analyze related log data. Widgets display log counts in pie charts and show log activity over time using time series charts.The default dimensions include the following:
- Keywords—Groups logs based on commonly detected terms or phrases.For example, “timeout” or “authentication failed”.
- Class—Groups logs by source class or service type.For example, application services or infrastructure components.
- Exceptions—Groups logs by detected exceptions or error types.For example,
NullPointerExceptionor connection timeout errors. - Sentiment—Categorizes logs based on positive, neutral, or negative sentiment.
- Level—Groups logs by severity level.For example,
INFO,WARN,ERROR, orCRITICAL.
- Filters—Display the filters applied to a widget. You can submit, modify, or reset filters to refine the displayed log data.
- Logs Table—Displays filtered logs based on chronology, severity level, sentiment, and highlighted keywords. This organization helps you identify patterns, prioritize critical issues, interpret log behavior, and make faster troubleshooting decisions.