
Netflow Widget
Last updated - 10 February, 2023
You can filter data using several criteria, and the individual data visualizations that are displayed on the Traffic tab can be added as widgets to your dashboards.
The built-in Netflow widget offers the same filters as the Traffic tab. For more information, see Traffic Tab.

Configuring a Netflow Widget
- Create a Netflow widget. For more information, see Widget Creation.
- Configure Basic Information fields. For more information, see Configuring Standard Widget Settings.
- (Optional) In the Default Time Range field, select a time range for the widget (default set to Last 24 hours).
- In the Netflow Options settings, complete the following fields:
- In the Resource Display Name field, enter a resource name and select it from the results list.
- (Optional) In the Netflow Type dropdown, select the required Netflow type from the dropdown list (default set to Top Talkers).
- (Optional) In the Filters settings, select the required filters for filtering data. For more information, see Viewing, Filtering, and Reporting on Netflow Data.
A table is displayed based on the filter criteria.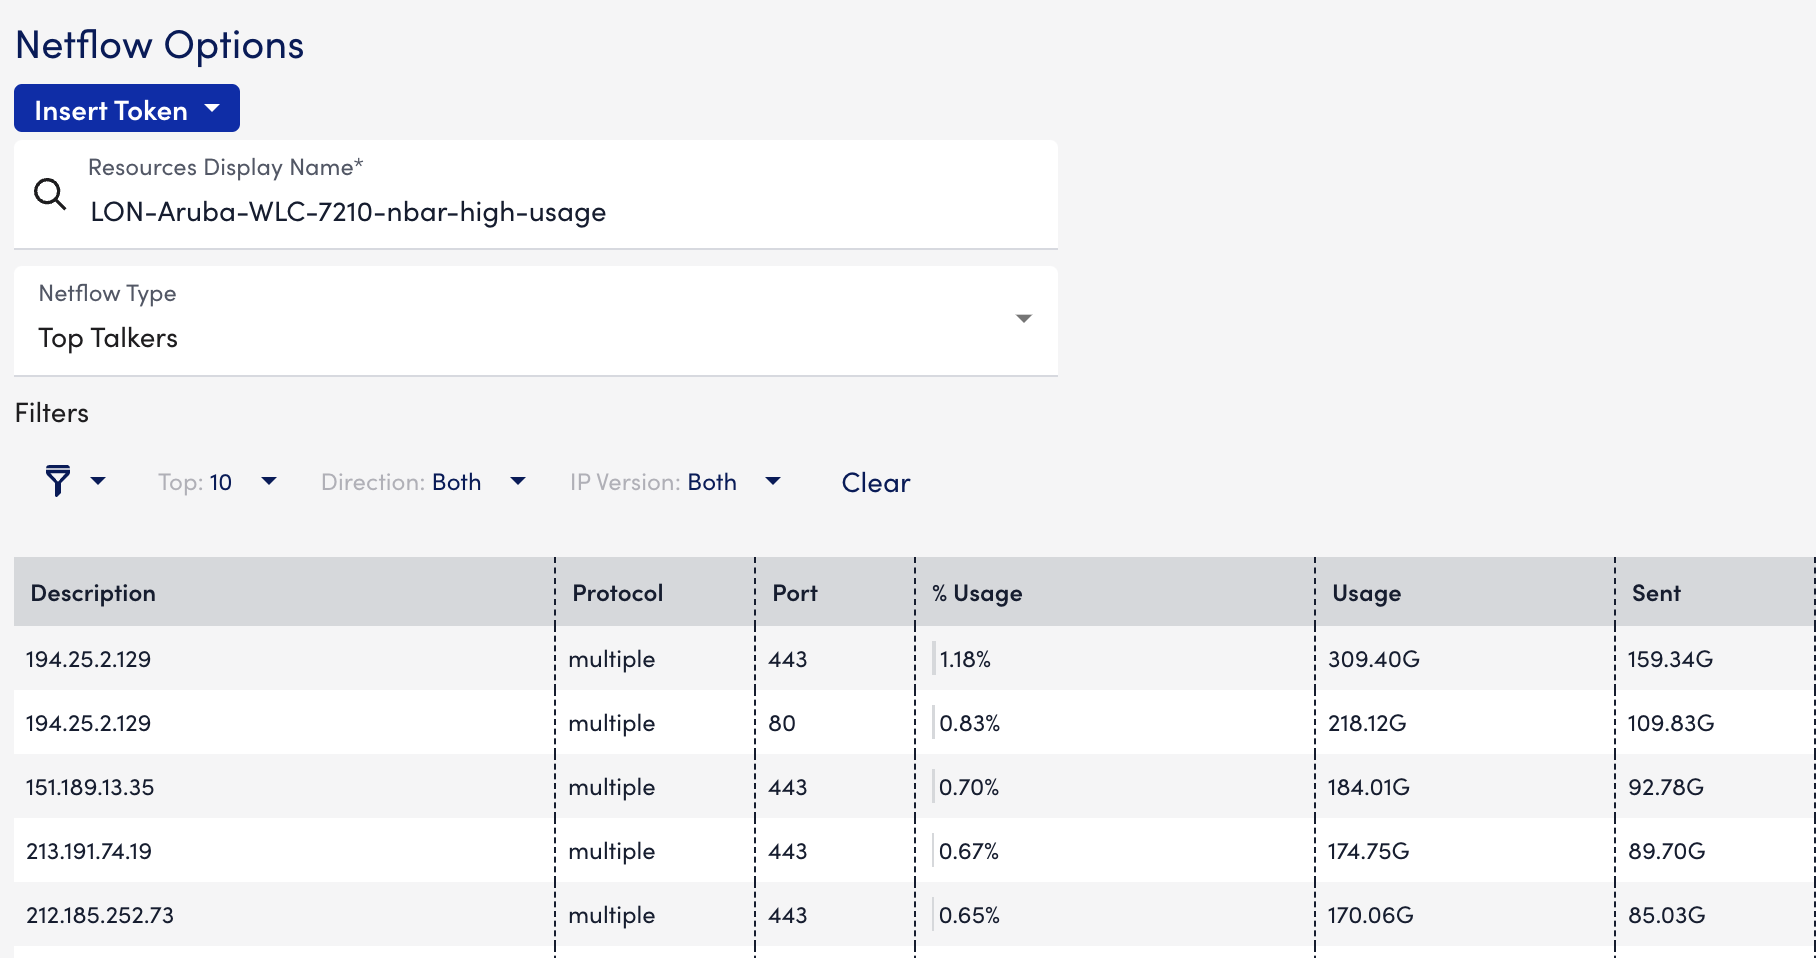
- Complete the standard widget configurations, and then Save the widget. For more information, see Configuring Standard Widget Settings.
