Navigating Edwin AI
Last updated - 04 September, 2025

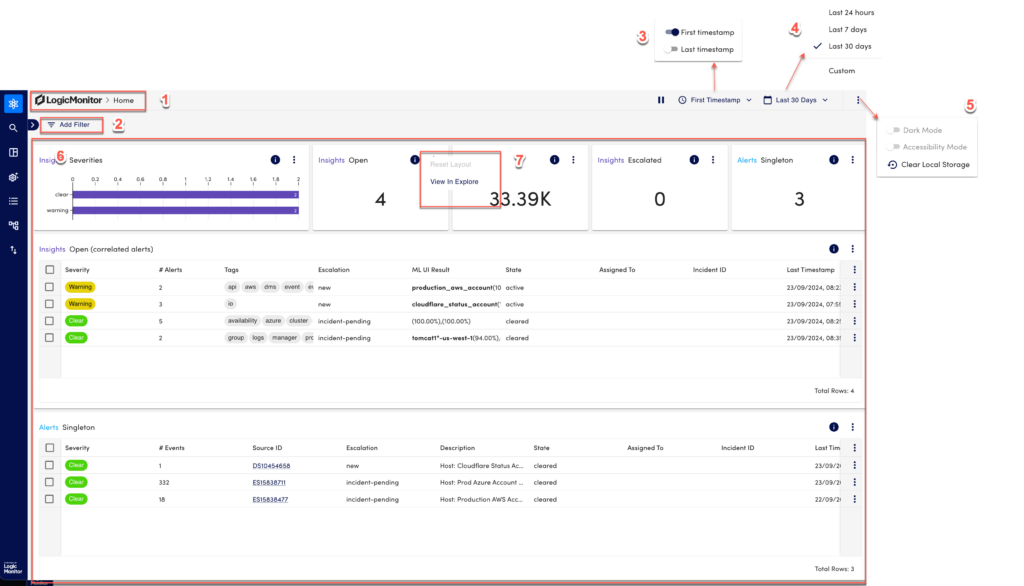
| Section | Description | Related Links |
|---|---|---|
| 1 – Breadcrumbs | You can follow or track back using the breadcrumbs | – |
| 2 – Add Filter | You can filter the chart data such as CI, Tenant, GenAI Title, GenAI Summary, GenAI Root cause, Severity, Assigned to, Event, Alert, or Insights. | About Filters |
| 3 – Timestamp | You can filter either the First timestamp (new insight), the Last timestamp (updated insight), or both. | – |
| 4 – Date Range | You can select a date range for the data you want to view. | – |
| 5 – More options | You can use the dark mode or accessibility mode. Clear local storage will clear current session actions or pinned records on the left-hand panel. | – |
| 6 – Charts View | You can view the data in various chart views. | Dashboard Chart |
| 7 – Reset / View in Explore | You can reset any changes to the layout of the charts. Using View in Explore, you can view the filter used to generate a particular chart in the explore view. | Explore Page |


