
Big Number Widget
Last updated - 23 April, 2026
You can use the Big Number widget to measure success based on the current value of a single metric, the aggregate value of metrics across resource, or a value from your database. The Big Number widget allows you to represent this data in an at-a-glance view on your dashboard.
To configure a Big Number widget, you select datapoints. These can be values of a datapoint on a single instance or values of a datapoint across instances. You can choose to create a virtual datapoint to change the units of measure, combine values, or perform a function on a value prior to display. You can also add two values together to create a single value (using the same value unit is recommended).
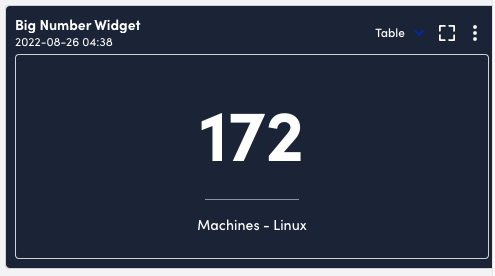
After configuring the datapoints, you configure how you want the data to display in the widget by defining labels. For example, you can enter a label of “Resources – Windows” to convey that the number displayed is the number of Windows resources returned for the datapoints you configured. In addition, you can add a hyperlink to enable access to pages in your portal(such as the Alerts page) or other destination as needed.
The Big Number widget also enables you to set widget-level filtering that operates independently of any Dashboard filters that may be applied. With the addition of resource and instance filtering support at the widget level, along with property-based filter support at the dashboard level, you can tailor each Big Number widget to a precise subset of infrastructure—such as a specific region, environment, or service—without impacting the rest of the dashboard. This gives you greater flexibility to build role-based or executive dashboards where each metric reflects targeted criteria, while still allowing broader dashboard filters or drill-down actions when needed.
Configuring a Big Number Widget
- In LogicMonitor, navigate to Dashboards, select a current Dashboard or create new, and then add a Big Number widget.
For more information, see Dashboard Creation.
For more information, see Widget Creation. - Configure the Basic Information settings.
For more information, see Configuring Standard Widget Settings.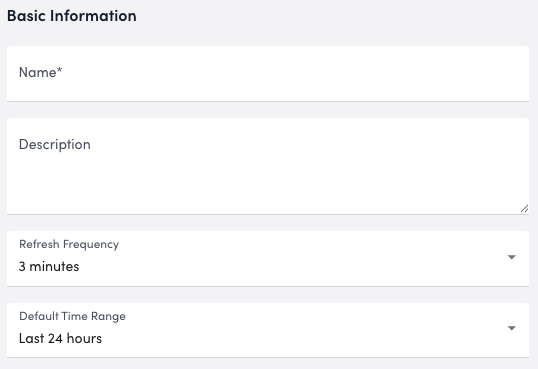
- To add a widget-level filter, select
from the Filter by field in the Big Number Options section, and do the following:
- Type a property in the Search records field, or select a property from the list of properties displayed.
LogicMonitor displays applicable properties as you type.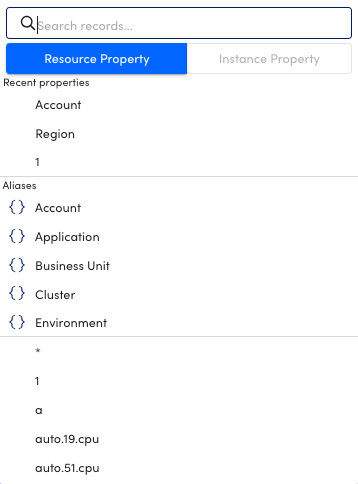 Note: At least one resource property must be added before you can add an instance property.
 - Type a value for the property in the Search records field, or select a value for the property from the list of values displayed for the property.
LogicMonitor displays applicable values as you type. - Select whether to include or exclude the value in the filter.
You can select anywhere outside of the filter configuration settings to view the dashboard with the configured filter. - Toggle Allow the Widget level filters to override the dashboard filters switch.
Toggling this switch enables individual widgets to display data independently of the dashboard’s global filter settings.
You can repeat this process to add a widget-level filter for as many resource or instance properties as needed.
- Type a property in the Search records field, or select a property from the list of properties displayed.
- In the Datapoints settings, select Add Record to add datapoints, virtual datapoints, or a resource count to the widget.
For more information, see Widget Datapoint Configurations. - In the Numbers settings, select Add Record and do the following:
- In Unit Label, enter text to clarify the unit of measure for the number displayed.
- In Bottom Label, enter the text to display as the bottom label for the value.
- In Label Hyperlink, enter a hyperlink for the destination you want to provide.
Note: You cannot enter a hyperlink without entering a unit or bottom label.
- From Record Name, select the record name for the datapoint you want to display on each number section.
- From Rounding, select one of the following:
- To round to a whole number, select “No decimal (rounded to whole number)”.
- To round to the decimal tenth, select “1 decimal place (tenths)”.
- To round to the hundredth decimal place, select “2 decimal places (hundredths)”.
- To enable separators in numbers with four or more digits, toggle on Use Comma Separators.
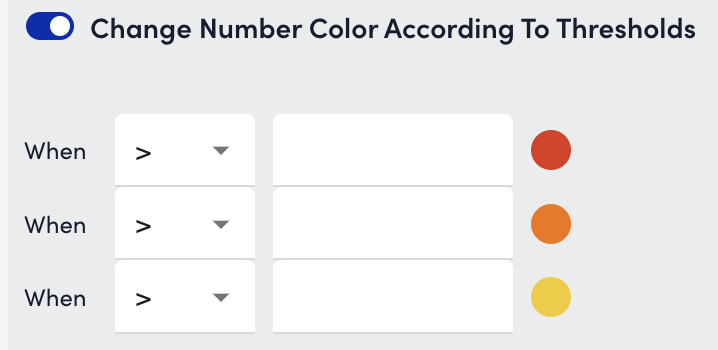
For example, you can display 12345678 as 12,345,678. - To change the color of a datapoint’s quadrant to yellow, orange, or red as soon as it meets the criteria of a specified alert threshold, toggle on Change number color according to thresholds and set alert thresholds.
- Select Apply.
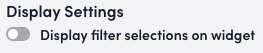
- To indicate that a widget-level filter is applied to the widget, toggle Display filter selections on widget in the Display Settings section.
When the widget is added to the Dashboard, a banner is displayed on the widget with the filter configuration enabling you to see which filters are applied to the widget. - Configure the Widget Color Schema settings.
For more information, see Configuring Standard Widget Settings. - Select Save.
