
Log Query Widget
Last updated – 17 June, 2024
The Log Query widget provides log details that help you identify issues, errors, or anomalies within your IT infrastructure.
Configuring a Log Query Widget
- Create a Log Query widget. For more information, see Widget Creation.
- In the Name field, enter a name to display at the top of the widget.Note: If the widget name exceeds more than 64 characters, ellipses display. Widget names also cannot include the operators and comparison functions available in LogicMonitor’s datapoint expression syntax and names cannot contain commas (,), semicolons (;), or asterisks (*). For more information, see Complex Datapoints. Use tokens as widget names to make cloning dashboards and updating widget information for the cloned dashboards easier. For more information, see Dashboard Tokens and Tokens in Widgets.
- (Optional) In the Description field, enter a description for the widget to reference later in the Edit Widget form.
- (Optional) From the Refresh Frequency dropdown menu, select an interval for the widget data to update on (defaulted to 15 minutes).
- (Optional) From the Default Time dropdown menu, select a time range for the widget data to provide data.
Note: The maximum time range is set to 24 hours. - In the Widget Options, select one of the following options from the Logs data type section:
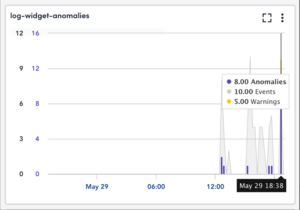
- Basic: Displays data in histogram graph
- Aggregate: Displays data in aggregate graph and table formats
Note: Raw data will not be displayed.
- In the Log Query field, enter the log query details. For more information, see Log Queries.Note: You can make a maximum of 15 calls per hour to fetch logs for a company.
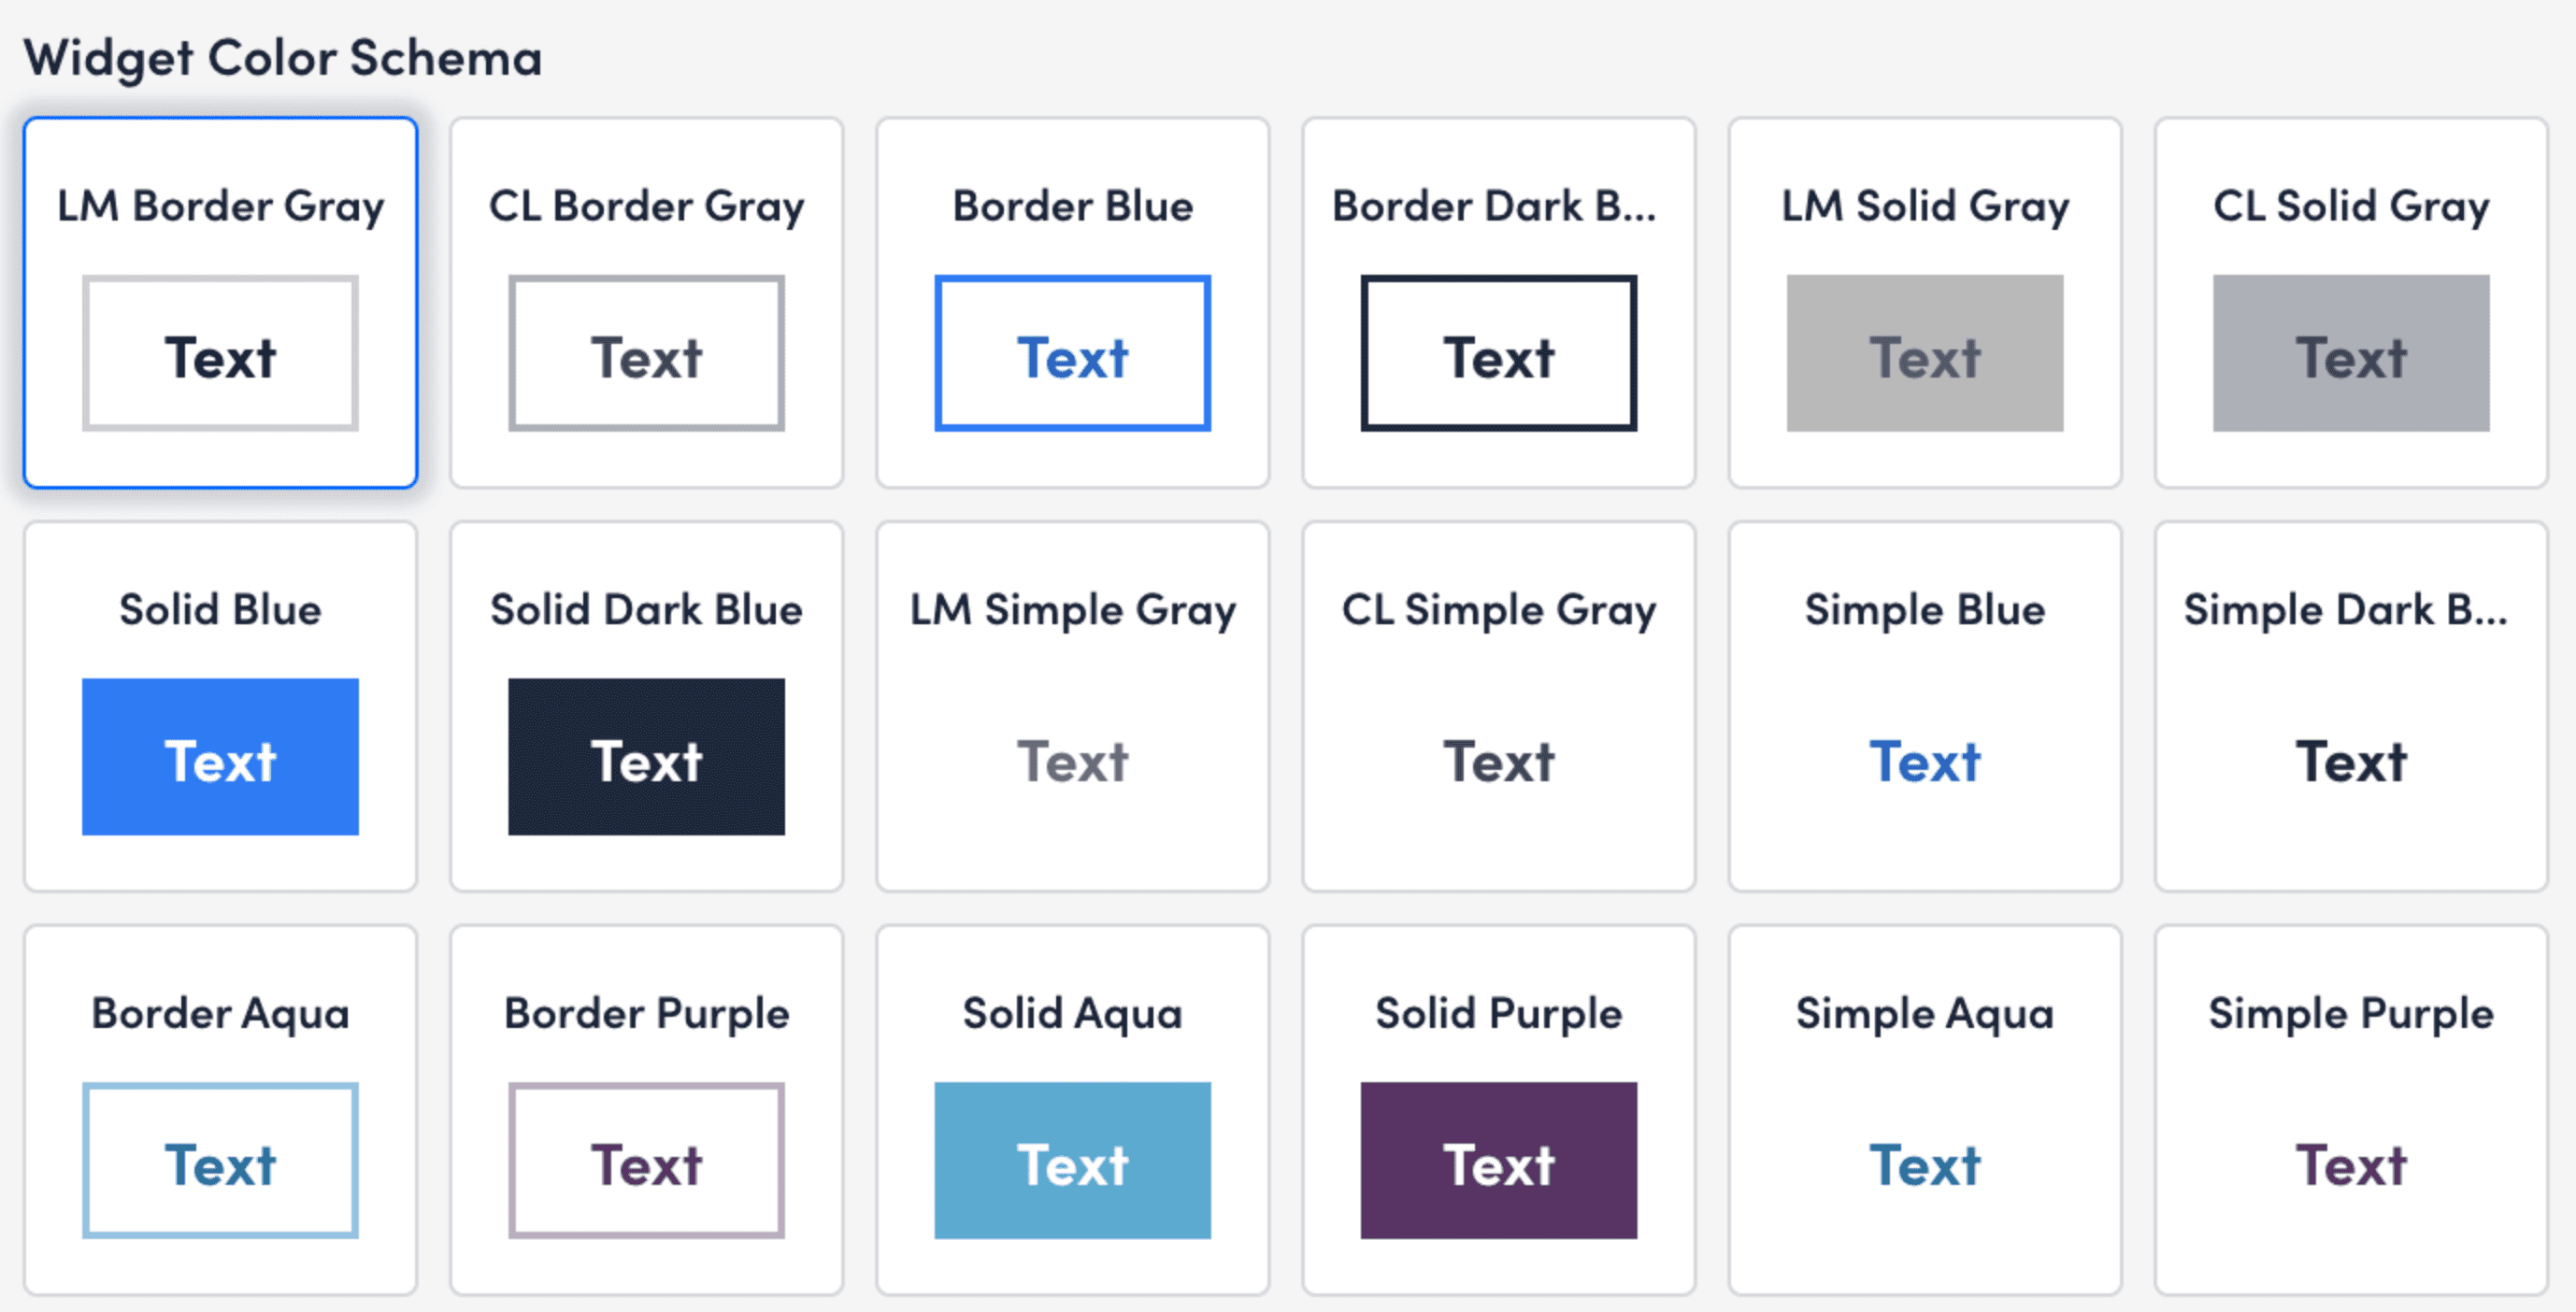
- (Optional) In the Widget Color Schema settings, select a color scheme for the widget to display on your dashboard (defaulted to LM Border Gray).
- Select Save.
The widget is saved to your dashboard.
Log Query Widget Dashboard Display
After you configure a Log Query widget, it displays on the dashboard along with the legends. Legends are displayed in the following ways:
- When you hover over a pie slice
- At the bottom of the widget under the pie
- As a label on the Log Query widget
