NetApp API Data Collection
Last updated - 24 July, 2025
Overview
LogicMonitor allows NetApp data collection via three methods:
- Performance Data
- Request XML
- API Call
Note: NetApp storage arrays will also respond to SNMP, and some datasources employ SNMP to collect NetApp data. This article talks only about using the NetApp API to collect data.
Performance Data
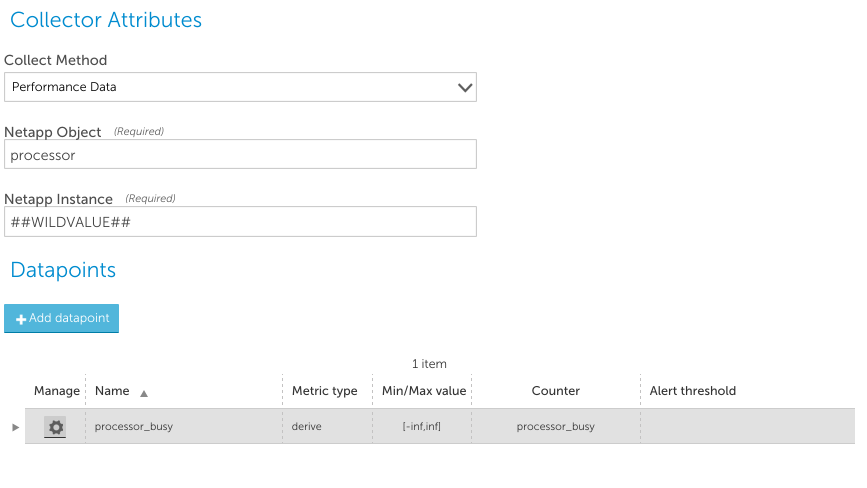
Performance Data Collection makes a perf-object-get-instances request for the specified object type (processor in the image below), and uses the supplied instance identifier (##WILDVALUE## in the image below – which would be replaced at runtime with an instance found in Active Discovery) to obtain a result set of all the performance counters for that object.
Note that it only can identify instances by the instance field – not the UUID – so this data collection method is only suitable where a unique instance name is available.
For example, the data collection configured in the following image below would work correctly on 7-mode NetApps, as each instance of the processor class (processor1, processor2, etc) will be unique per device. On cluster mode, however, there may be multiple “processor1” objects, on different nodes in the cluster, that are differentiated by UUID. The Performance Data collection method would not be capable of distinguishing between them, as it can only request objects by instance name – not UUID.
The datapoint Counter field should be the name of a counter returned by the NetApp API for the kind of object requested. The Performance collection method automatically uses aggregation – it designates one instance to be the master, which makes a single call to collect data about all instances. Individual instance collection for other instances will query the aggregation cache.
API Call
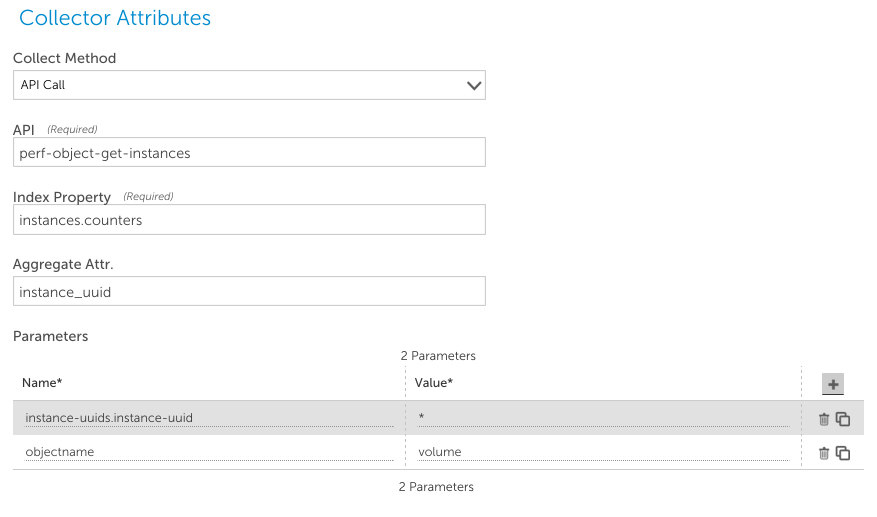
This method allows you to specify any NetApp API call, and will interpret returned the data either as nameand value attributes, or as elements with a value, which are the data points that can be collected. For example, to collect volume performance information on a NetApp cluster, you could use this configuration:
- API: the name of the API to use. Perf-object-get-instances in this case, cluster mode API call to retrieve performance information
- Index Property: this identifies where in the returned XML the actual results are. In the above example, the returned XML will have an instances element. The collector will walk this objects sub-elements, and look for a counters subelement. This is where the collector will retrieve information from (either if name and value elements are within that level, or counter elements)
- Aggregate Attr: this identifies how to locate a specific instance within a returned XML result. Specifies the name/value pair that will identify the instance – and thus all name/value pairs in the same context relate to the same instance. Because data for the above response includes the below: instance_uuid 7c2ff26c-bd32-4993-bcff-581727bbd522 internal_msgs 459431 specifying instance_uuid enables the collector to know that the value for that element will contain the instance wild value, as discovered by Active Discovery. This field is necessary when using collection aggregation – when the collector collects all instances of a class at once, caches them locally, and then individual collection queries the cache.
- Parameters: these are the parameters required by the specified API call. For instance, the performance API call requires an objectname parameter, to identify the kind of object that performance information is being requested about. It also requires an identifier of which instance or instances to query with the call. This is a nested object for this call: 7c2ff26c-bd32-4993-bcff-581727bbd522. To add this as a parameter, separate the levels with a period, as above. Note that to use aggregating collection, you can use “*”, which the collector will replace with all existing instance IDs.
Request XML
The Request XML collection method allows you to send any NetApp API call, and interpret the results. It supports the aggregation of data collection (querying for multiple objects at once), as well as non-aggregated collection (issuing an API call for each object individually). The simplest case is to use non-aggregated collection, where each collection task collects the data for a single instance. This requires the use of the ##WILDVALUE## token to specify which object to collect, in the XML body. e.g. when the instances of a datasource are the volume UUIDs, you could collect the data about those volumes with the following datasource:
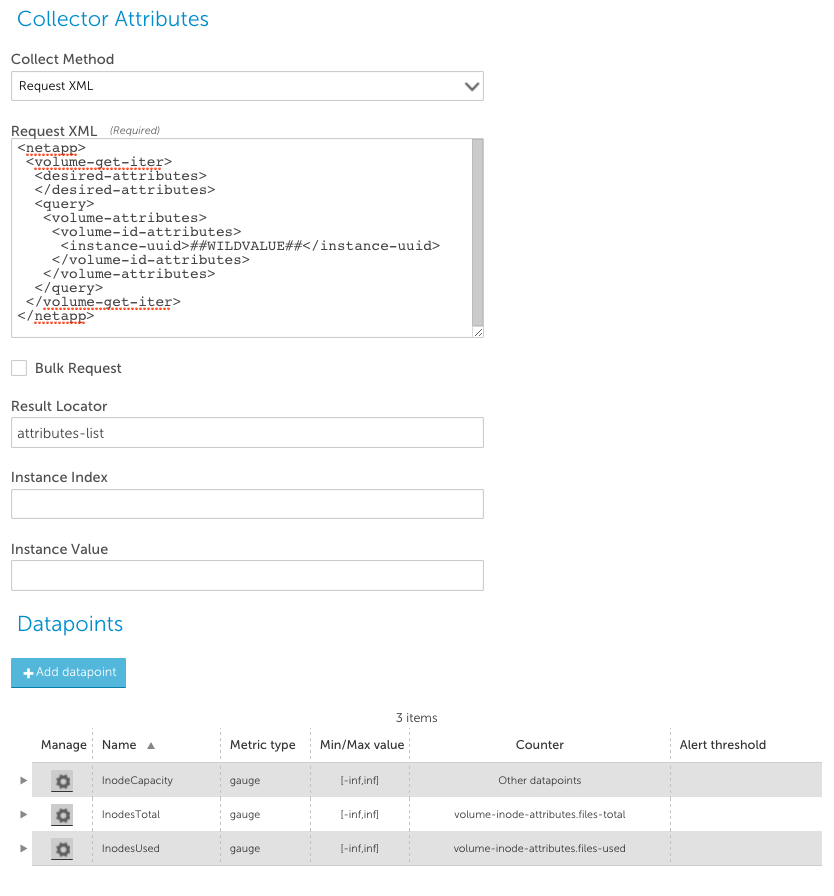
The Result Locator is used to locate the results object in the NetApp XML response. The format is “resultLocator[::attributeLocator]”. The resultLocator field usually points to an array of sub objects, and the counter values for the datapoints are then relative to this array. In non-aggregated collection, the first object in this array is assumed to contain the data. For example, the query from the above datasource may return results like the following:
<attributes-list>
             <volume-attributes>
                         <volume-id-attributes>
                                     <instance-uuid>53b10a8d-255c-4be9-9078-78b5d9d98e68</instance-uuid>
                                     <name>server2_root</name>
                                     <uuid>ccb2d972-7d75-11e3-91bb-123478563412</uuid>
                         </volume-id-attributes>
                         <volume-inode-attributes>
                                     <files-private-used>502</files-private-used>
                                     <files-total>566</files-total>
                                     <files-used>96</files-used>
                         </volume-inode-attributes>
                         <...snip.....>
             </volume-attributes>
</attributes-list>
By setting the Result Locator to “attributes-list”, this is stating that the list element contained therein (volume-attributes) contains the data that is being collected. As we are not doing aggregated collection, it is assumed that the first element of this location (the “volume-attributes” container) contains the relevant data. Thus the path to the actual data to be extracted (e.g. “volume-inode-attributes.files-total”) is relative to that object. To do aggregated data collection, it is necessary to understand how to request data about multiple objects in the XML query. There are two general classes of API calls used with the XML collection method – those that use a query attribute to select the objects to return, and those that explicitly enumerate the objects to return.
Aggregated Collection Using Query Parameters to Identify Instances
To use an API call that uses query parameters to retrieve all objects, it is generally easy to construct the API call to return a set of objects (See the NetApp SDK for details regarding the specific call). For example, to get a result set for all volumes, you can simply specify a query with no selectors:
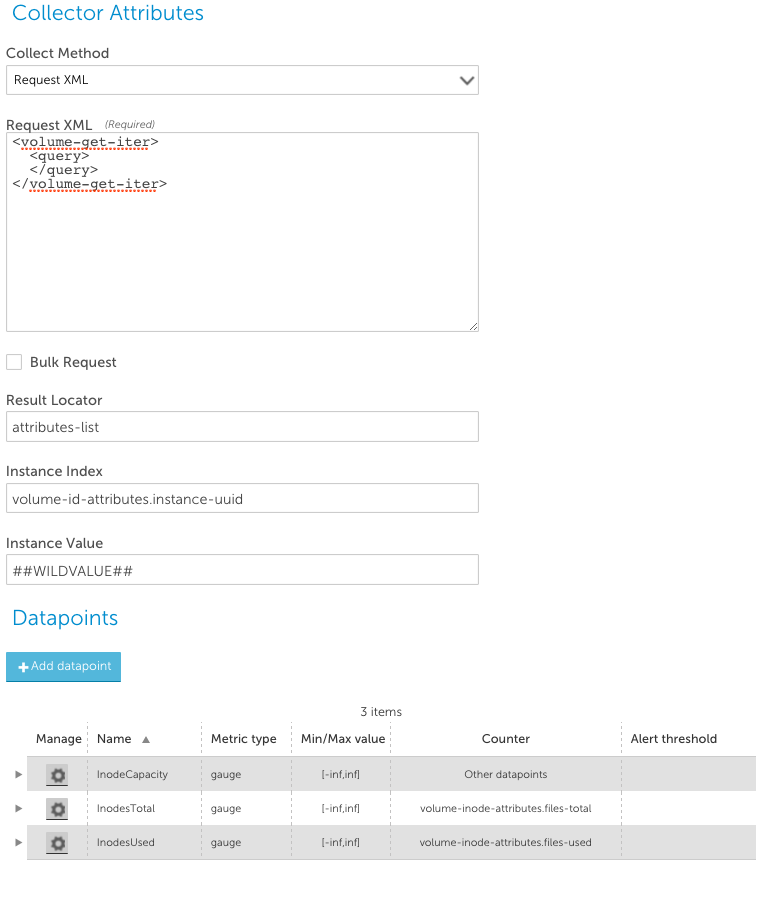
The aggregate results from the above Request XML may be like the below:
<attributes-list>
    <volume-attributes>
        <volume-id-attributes>
            <instance-uuid>53b10a8d-255c-4be9-9078-78b5d9d98e68</instance-uuid>
            <name>server2_root</name>
            <uuid>ccb2d972-7d75-11e3-91bb-123478563412</uuid>
        </volume-id-attributes>
        <volume-inode-attributes>
            <files-private-used>502</files-private-used>
            <files-total>566</files-total>
            <files-used>96</files-used>
        </volume-inode-attributes>
        <...snip.....>
    </volume-attributes>
    <volume-attributes>
        <volume-id-attributes>
            <instance-uuid>53b10a8d-255c-4be9-9078-1239876123311</instance-uuid>
            <name>server2_data</name>
            <uuid>ccb2d972-7d75-11e3-91bb-a5b7c9911111</uuid>
        </volume-id-attributes>
        <volume-inode-attributes>
            <files-private-used>502</files-private-used>
            <files-total>566</files-total>
            <files-used>96</files-used>
        </volume-inode-attributes>
        <...snip.....>
    </volume-attributes>
</attributes-list>
As noted above, the Result Locator is used to locate the results object in the NetApp XML response. The format is “resultLocator[::attributeLocator]”. The resultLocator field usually points to an array of sub objects, and the counter values for the datapoints are then relative to this array. In the above datasource, the Result Locator is attributes-list, so the subsequent references and queries are relative to that. The Instance Index is used to isolate instances from the aggregated query. This needs to point to a field that will uniquely identify the instance – volume-id-attributes.instance-uuid, in the above datasource. All data queried for this instance will be collected from the object containing the matching instance index. (i.e. the volume-attributes object that contains the volume-id-attributes.instance-uuid that matches the WILDVALUE. Instance Value is the field used to match the Instance Index – this should always be ##WILDVALUE##.
Note that the Bulk Request checkbox does not need to be set to enable Aggregated data collection if the API call supports retrieving multiple objects without enumerating all the object identifiers.
Aggregated Collection Using Enumerated Instances to Collect Data
If the API call requires the instances for which data is to be collected to be identified in the request, then in order to do aggregated collection, the LogicMonitor collector must create a query enumerating all the instances – and it must know how to construct the XML request for the specific API call. For example, to collect volume performance in an aggregated mode, you must list all the volume instance-uuids that you wish to collect data for. The following datasource accomplishes this:
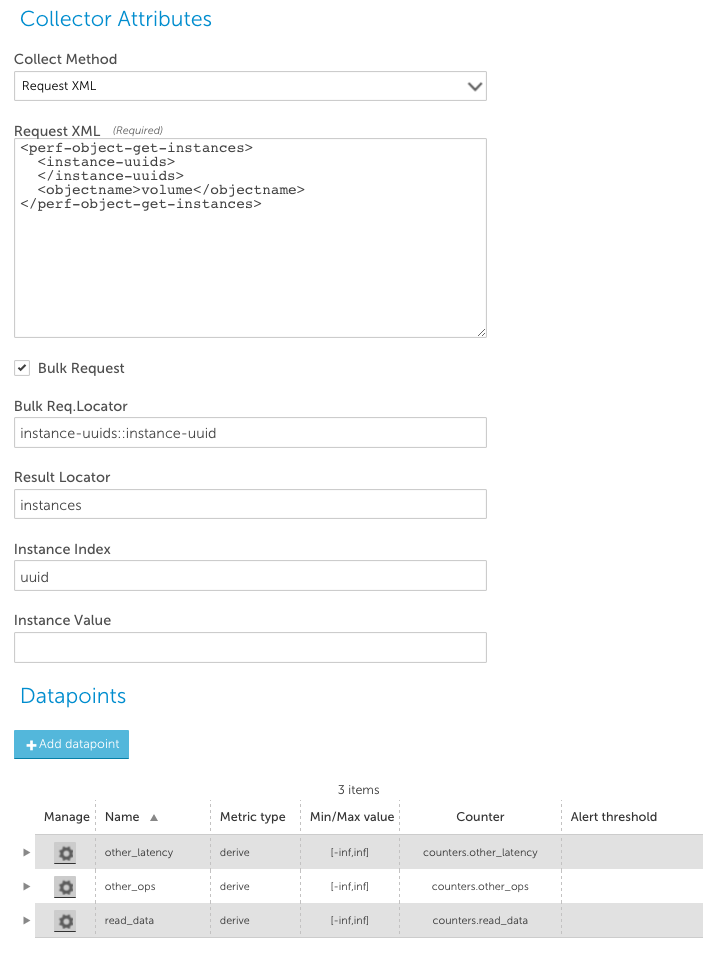
- Bulk Request checkbox: This tells the LogicMonitor collector that it should construct a list of all the possible instance values, to enable aggregated collection.
- Bulk Request Locator: This details where in the request XML to insert the list of instances. In the above example, this is set to instance-uuids::instance-uuid. This means: “Insert the instances in a instance-uuid field, within the instance-uuids object.” This will result in a request like the following:
<perf-object-get-instances>
  <instance-uuids>
    <instance-uuid>WILDVALUE OF INSTANCE 1</instance-uuid>
    <instance-uuid>WILDVALUE OF INSTANCE 2</instance-uuid>
    <instance-uuid>WILDVALUE OF INSTANCE 3</instance-uuid>
<snip..>
    <instance-uuid>WILDVALUE OF INSTANCE N</instance-uuid>
  </instance-uuids>
  <objectname>volume</objectname>
</perf-object-get-instances>
- Instance Index is used to isolate instances from the aggregated query. This needs to point to a field that will uniquely identify the instance – volume-id-attributes.instance-uuid, in the above datasource. All data queried for this instance will be collected from the object containing the matching instance index. (i.e. the volume-attributes object that contains the volume-id-attributes.instance-uuid that matches the WILDVALUE. Note that the Bulk Request Locator supports multiple level objects, and can construct the whole XML query, by using a double colon (“::”) to specify elements that should be surrounding the instances, and those used to construct the instances. e.g. you could set the request XML to:
level1.level2::sub-level1.sub-level2
The collector will then look for XML elements level2, within a level1 element. For each instance, it will insert XML fields of sub-level2 within sublevel1, located within the level2 element. E.g.
<level1>
   <level2>
      <sub-level1>
         <sub-level2>WILDVALUE of Instance1</sub-level2>
      </sub-level1>
<sub-level1>
<sub-level2>WILDVALUE of Instance2</sub-level2>
</sub-level1>
</level2>
</level1>
Adding Datapoints for NetApp Data Collection
In most cases, data points are defined simply by specifying the object by name containing the value to be collected, which will be collected within the context of the result locator using the instance index. e.g. to collect the files-private used value of 502 from the following result:
<volume-inode-attributes>
    <files-private-used>502</files-private-used>
you would simply create a normal datapoint with the counter volume-inode-attributes.files-private-used. However, if the XML result returns objects where the numeric data you wish to collect is not in a field that is distinctly named, but rather separate name/value pairs, this method cannot work. For example, the result to this query:
<netapp xmlns="https://www.netapp.com/filer/admin" version="1.20">
 <perf-object-get-instances>
 <instance-uuids>
 <instance-uuid>##WILDVALUE##</instance-uuid>
 </instance-uuids>
 <objectname>system</objectname>
 </perf-object-get-instances>
</netapp>
may look like:
<instances>
            <instance-data>
                <counters>
                    <counter-data>
                        <name>avg_processor_busy</name>
                        <value>24045244730</value>
                    </counter-data>
                    <counter-data>
                        <name>cifs_ops</name>
                        <value>0</value>
                    </counter-data>
                </counters>
            </instance-data>
</instances>
Where the results are Name and Value counters as siblings to each other, it is not possible to directly specify the path to the value in the NetApp Counter field. (LogicMonitor does not have access to a direct XML response – else XPath constructs could be used to get this data.) To get around this, there is special processing that will treat any sub XML element containing both “name” & “value” sub-elements to create attributes in the result object map. Thus the above output would in fact be processed to look like:
<instances>
            <instance-data>
                <counters>
                    <avg_processor_busy>24045244730</avg_processor_busy>
                    <cifs_ops>0>/cifs_ops>
                </counters>
            </instance-data>
</instances>
allowing collection as usual.


