LM OTel Collector Logging
Last updated - 03 October, 2025
Viewing Logs
Execute the following commands to view logs for each platform:
- Linux
journalctl -u lmotelThe systemd logs are stored in files /run/log/journal/machine-id/ or /var/log/journal/machine-id/ with the “.journal” suffix. /run is used when /var/log/journal is not available, or when Storage=volatile is set in the journald.conf configuration file.
- Docker
docker logs <container_id/name>- Kubernetes
kubectl logs -f $(kubectl get pods --namespace=<namespace> -l app=lmotel -o name) -c lmotel -n <namespace>Changing the Log-Level
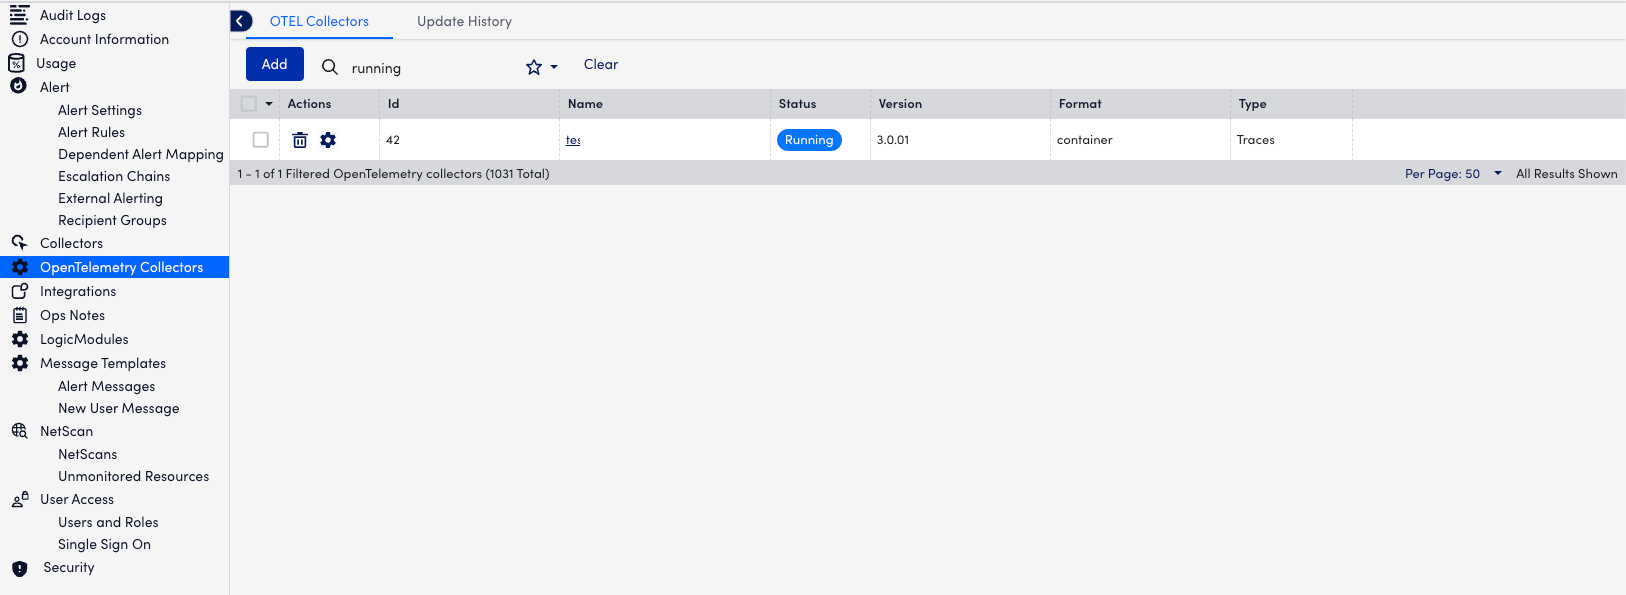
- In LogicMonitor, navigate to Settings> OpenTelemetry Collectors.
- In the OTEL Collectors page, select the required running OpenTelemetry Collector and then select
 Manage.
Note: The collector has to be in Running status to access the manage option.
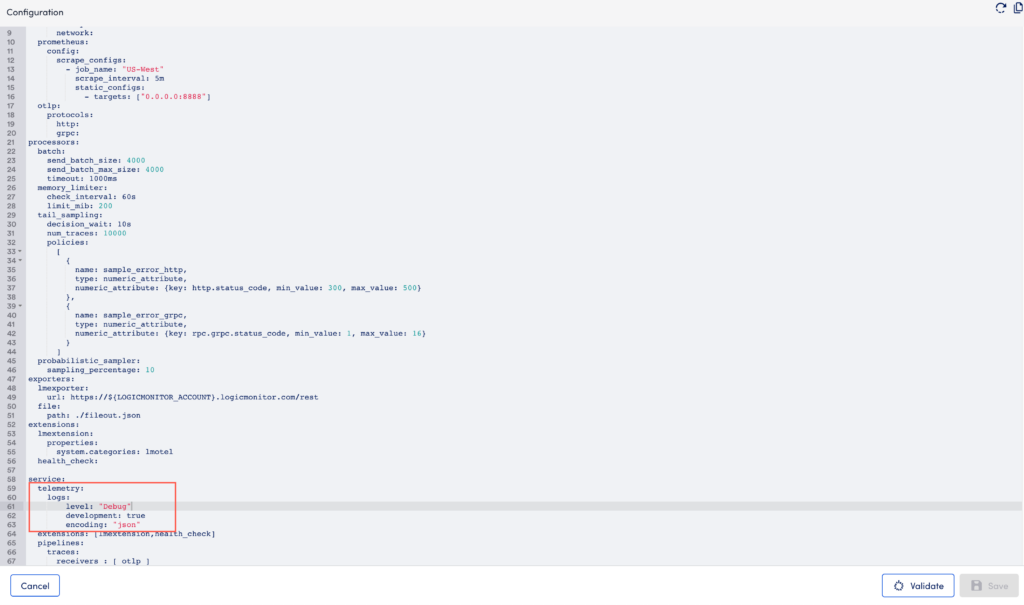
- In the Configuration file, under the service section, add the following:
service:
  telemetry:
    logs:
        level: "Debug"
        development: true
encoding: "json"Note:
- The default log level is INFO and this can be modified using a telemetry tag. The supported log-levels include DEBUG, INFO, WARN, ERROR, DPANIC, PANIC, FATAL.
- The encoding field is optional.

- Select Validate and then Save.
Logging Exporter
Logging exporter is used to dump telemetry data to the console via zap.Logger. It exports traces/metrics/logs depending on the pipeline.
Supported pipeline types include traces, metrics, and logs and can be used for the following:
- To verify whether traces (or any other telemetry data) has reached the OTel Collector
- To check the updated data after processing
For example, if span-processor is configured in the pipeline to modify the span name, you can look at the logged traces in the console to check the updated value of span name. - Other general debugging purposes
The following optional flags can be configured:
- loglevel (default = info): the log level of the logging export (debug|info|warn|error)
When set to debug, pipeline data is verbosely logged. - sampling_initial (default = 2): number of messages initially logged each second
- sampling_thereafter (default = 500): sampling rate after the initial messages are logged (every Mth message is logged)
See the following documentation from Zapcore for information on how sampling parameters impact the number of messages:
https://pkg.go.dev/go.uber.org/zap/zapcore#NewSampler
exporters:
  logging:
    loglevel: debug
pipelines:
 traces:
   receivers: [nop]
   processors: [nop]
exporters: [logging]Console Log Information
You can check the following information in the console logs:
- To check whether LM OTel Collector is registered successfully with which Collector ID, search for the following in the logs:
“Collector registered successfully!!”
The Collector ID is at the end and looks similar to the following:
2021-10-01T09:52:07.015Z info lmextension/lmextension.go:176 Collector registered successfully!! {"kind": "extension", "name": "lmextension", "id": "23754"}- To check whether lmotel is running, look for something similar to the following:
2021-10-01T09:52:07.022Z info service/collector.go:134 Everything is ready. Begin running and processing data.- To check whether config file is updated successfully, search for the following:
Config file changed. Reloading lmotel...- To check if credentials were rotated successfully, search for the following:
Credentials updated successfully!!

