Saved Maps
Last updated – 03 February, 2026
On the Saved Maps page, you can view the hierarchy of the map groups and maps created underneath. In addition, you can explore, create, delete, and save the maps.
For more information, see Mapping Page (New UI).
Viewing Saved Maps
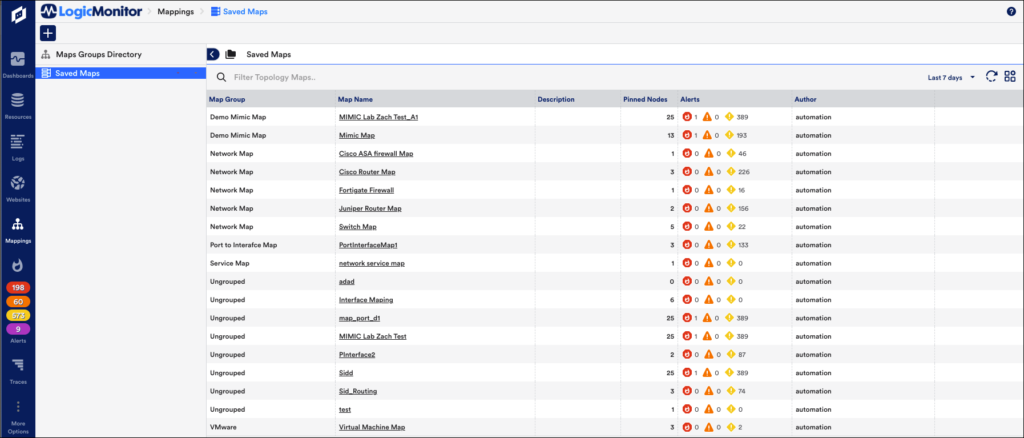
- In LogicMonitor, navigate to Mappings > Saved Maps. You can view the following details in the Saved Maps section:
- Map Group – Displays the name of the map group.
- Map Name – Displays the name of the map.
- Description – Provides information about the map.
- Pinned Nodes – Displays the number of pinned nodes on the map.
- Alerts – Displays the type and count of the alerts.
- Author – Displays the name of the user who created the map.
- Filter Topology Maps – Enables you to filter the maps.
- Time Range – Time Range indicates the duration of time for which alerts will be pulled for display.
- Refresh – Refreshes the view
- Show Table Settings – Reorder columns, you can grab the icon to the far left of a column name, and drag and drop the column into its new position. Select the Watch icon to exclude the columns from the report.
- Select Saved Maps hierarchy.
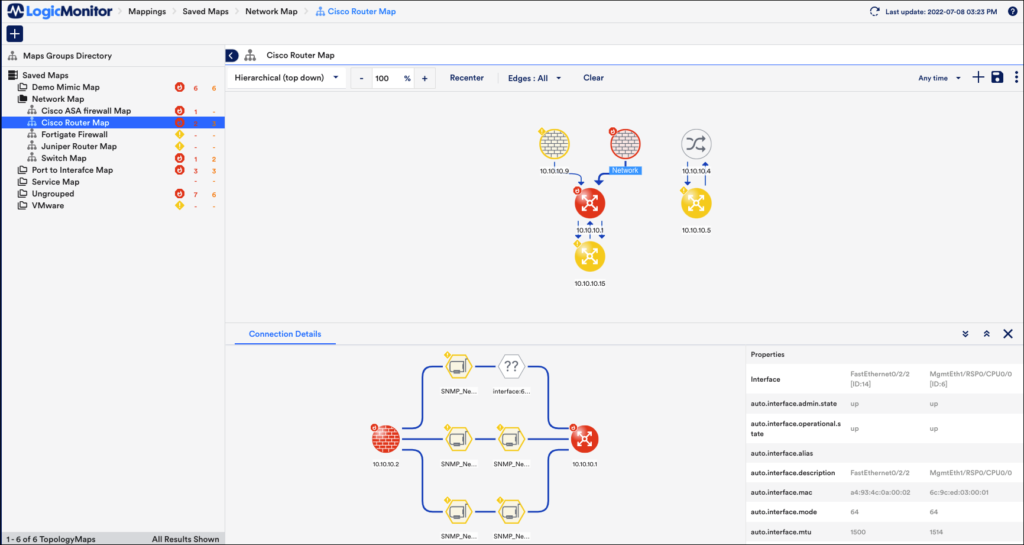
The Map Groups Directory displays in the left panel. You can view saved map group and the maps assigned under the resource groups. In addition, you can also view if there are any alerts for the maps.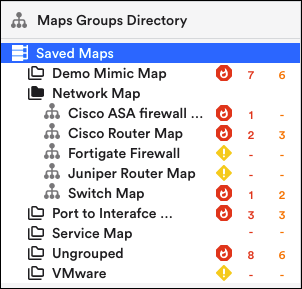
- Select the required saved map group to view the details, see the Saved Maps section in the right panel.
- From the Map Groups Directory panel, select the required Map Name to view the map in detail in the Saved Maps section.
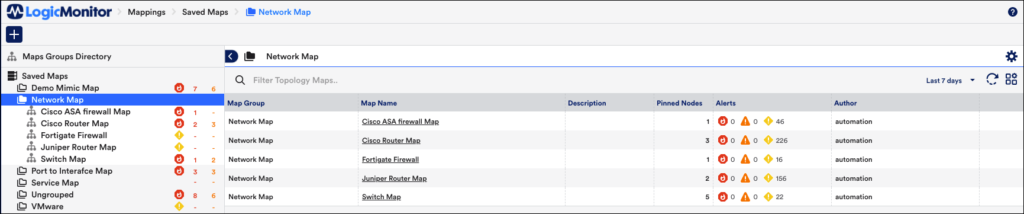
- Select on the required Map Name to explore, edit, or delete the map.
- Select
 to add maps.
For more information, see the Mapping page (New UI).
Saving Connections Filter in Maps
You can set a filter for connections and save the view for later in the saved maps.
- In LogicMonitor, navigate to Mapping > Saved Maps.
- On the Mapping page, select Connections.
- Select the required connections.
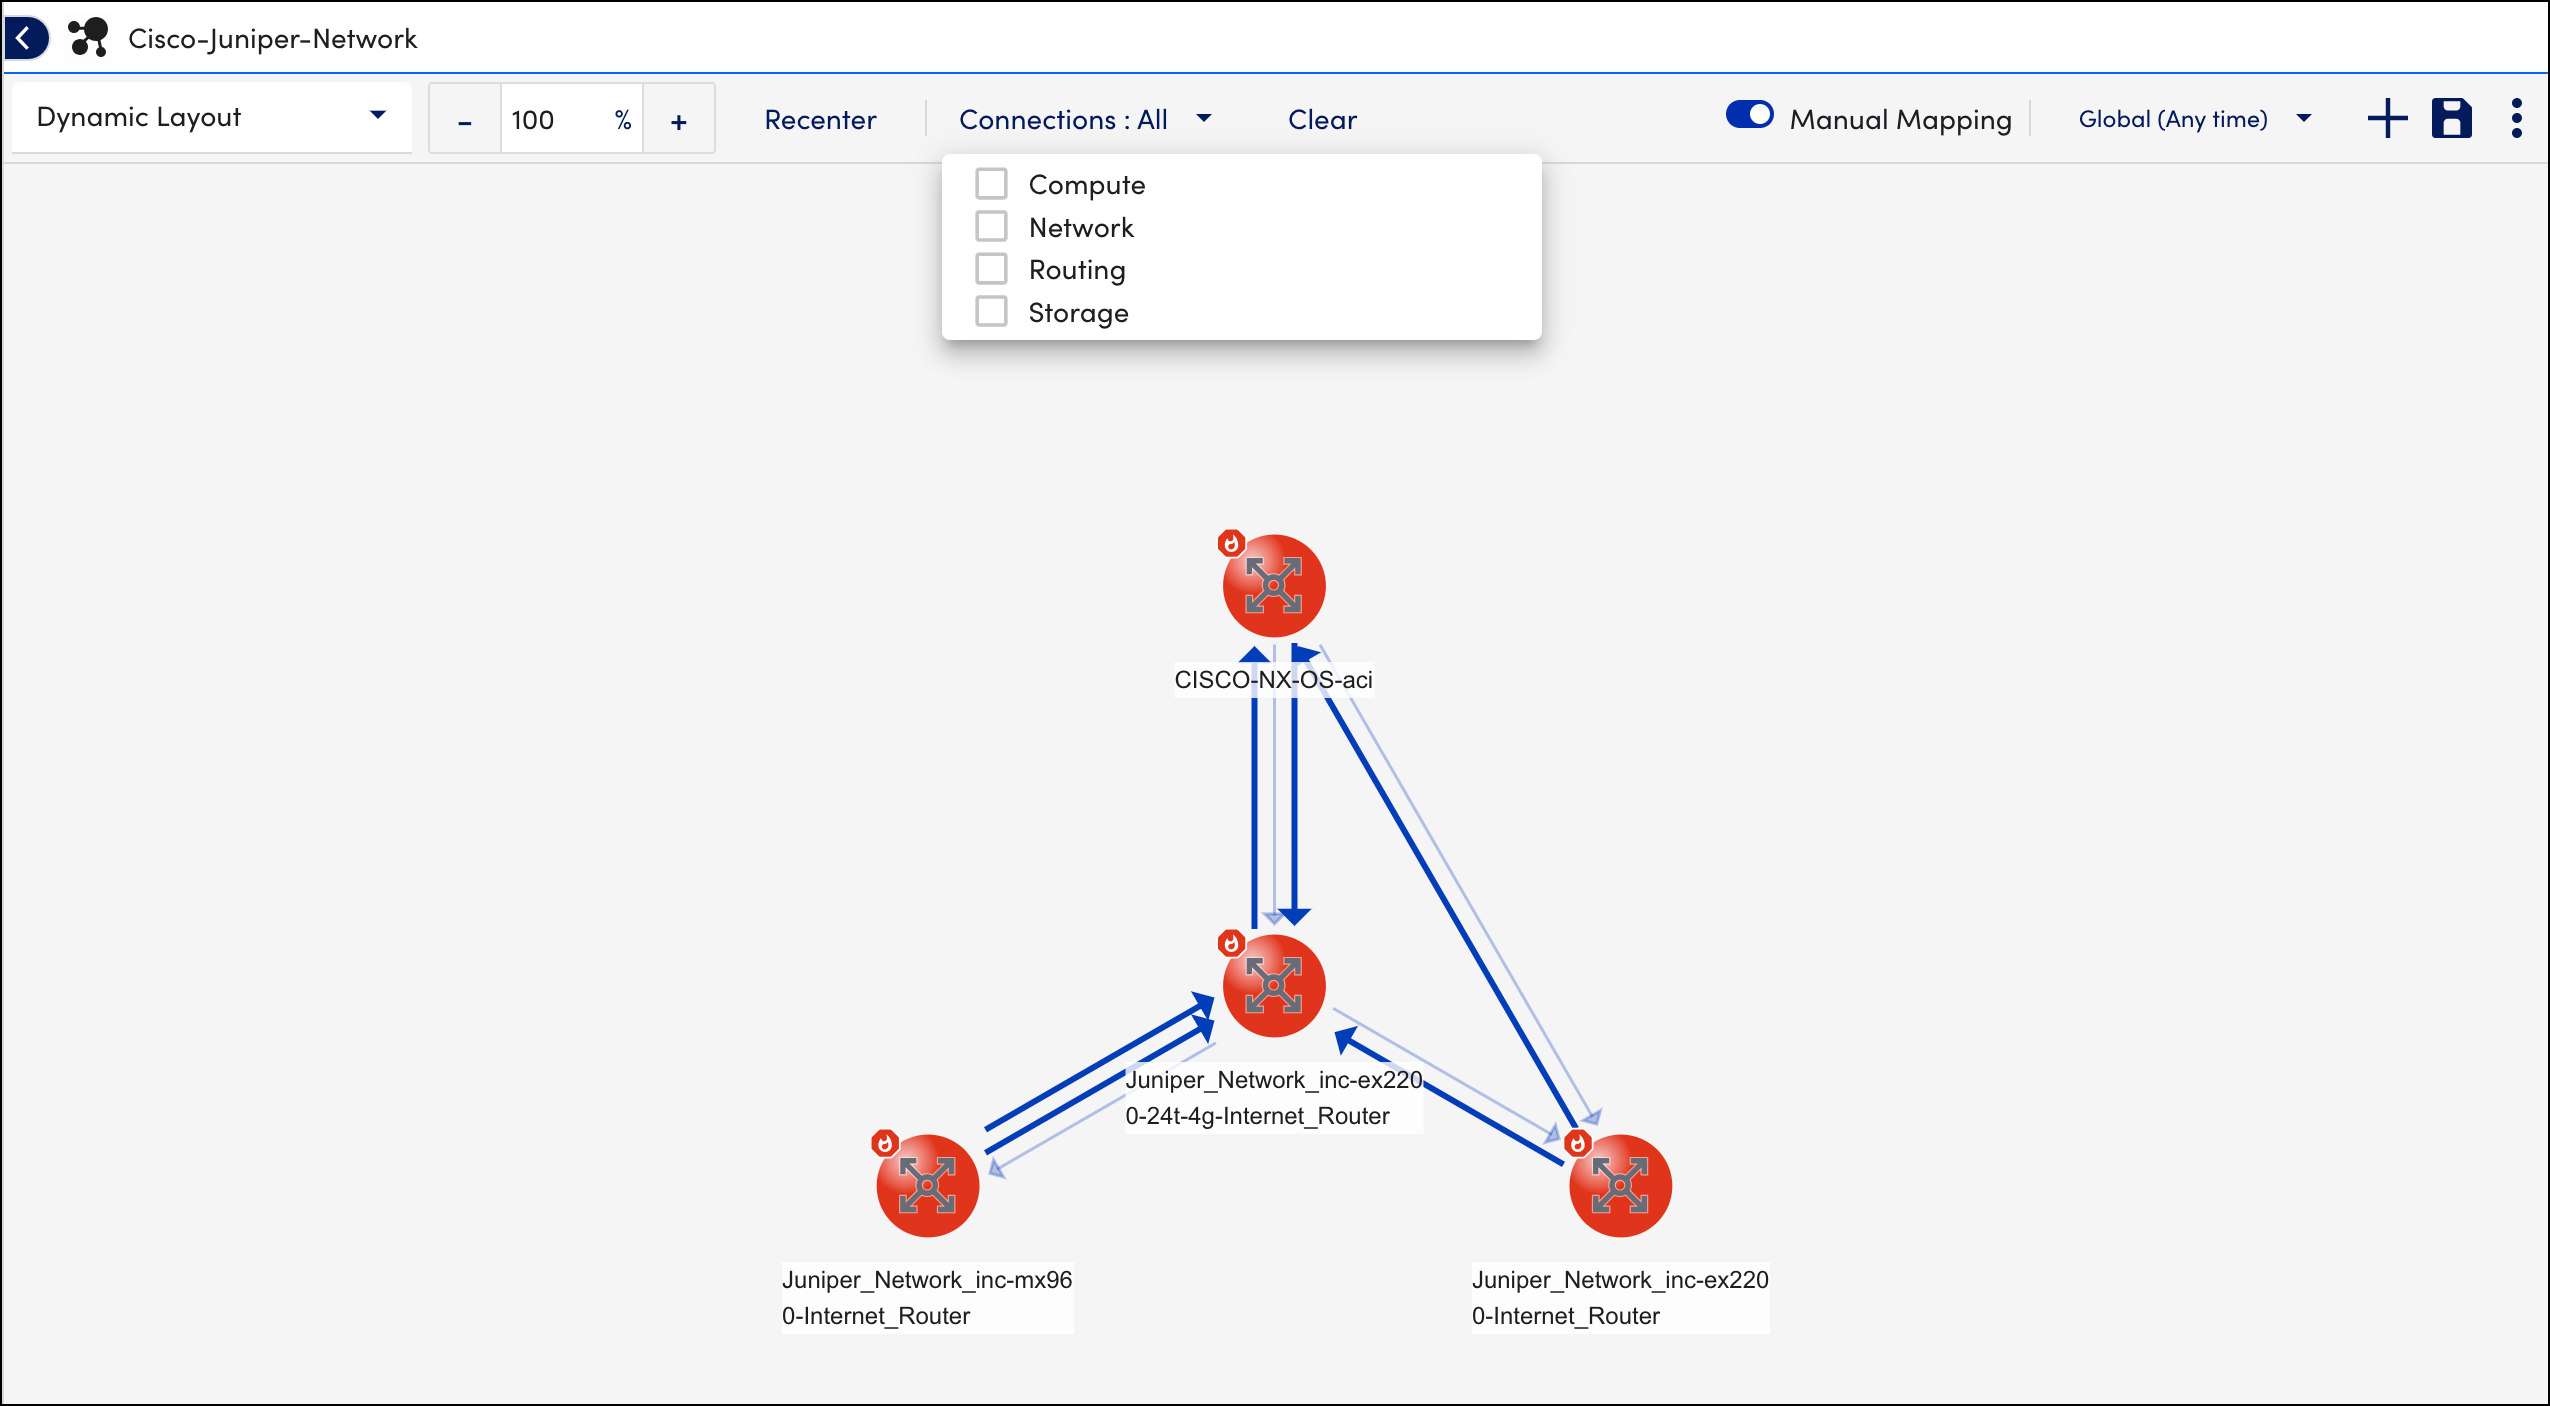
- On the upper right corner, select Save.
The following saved view will be displayed the next time you view the map.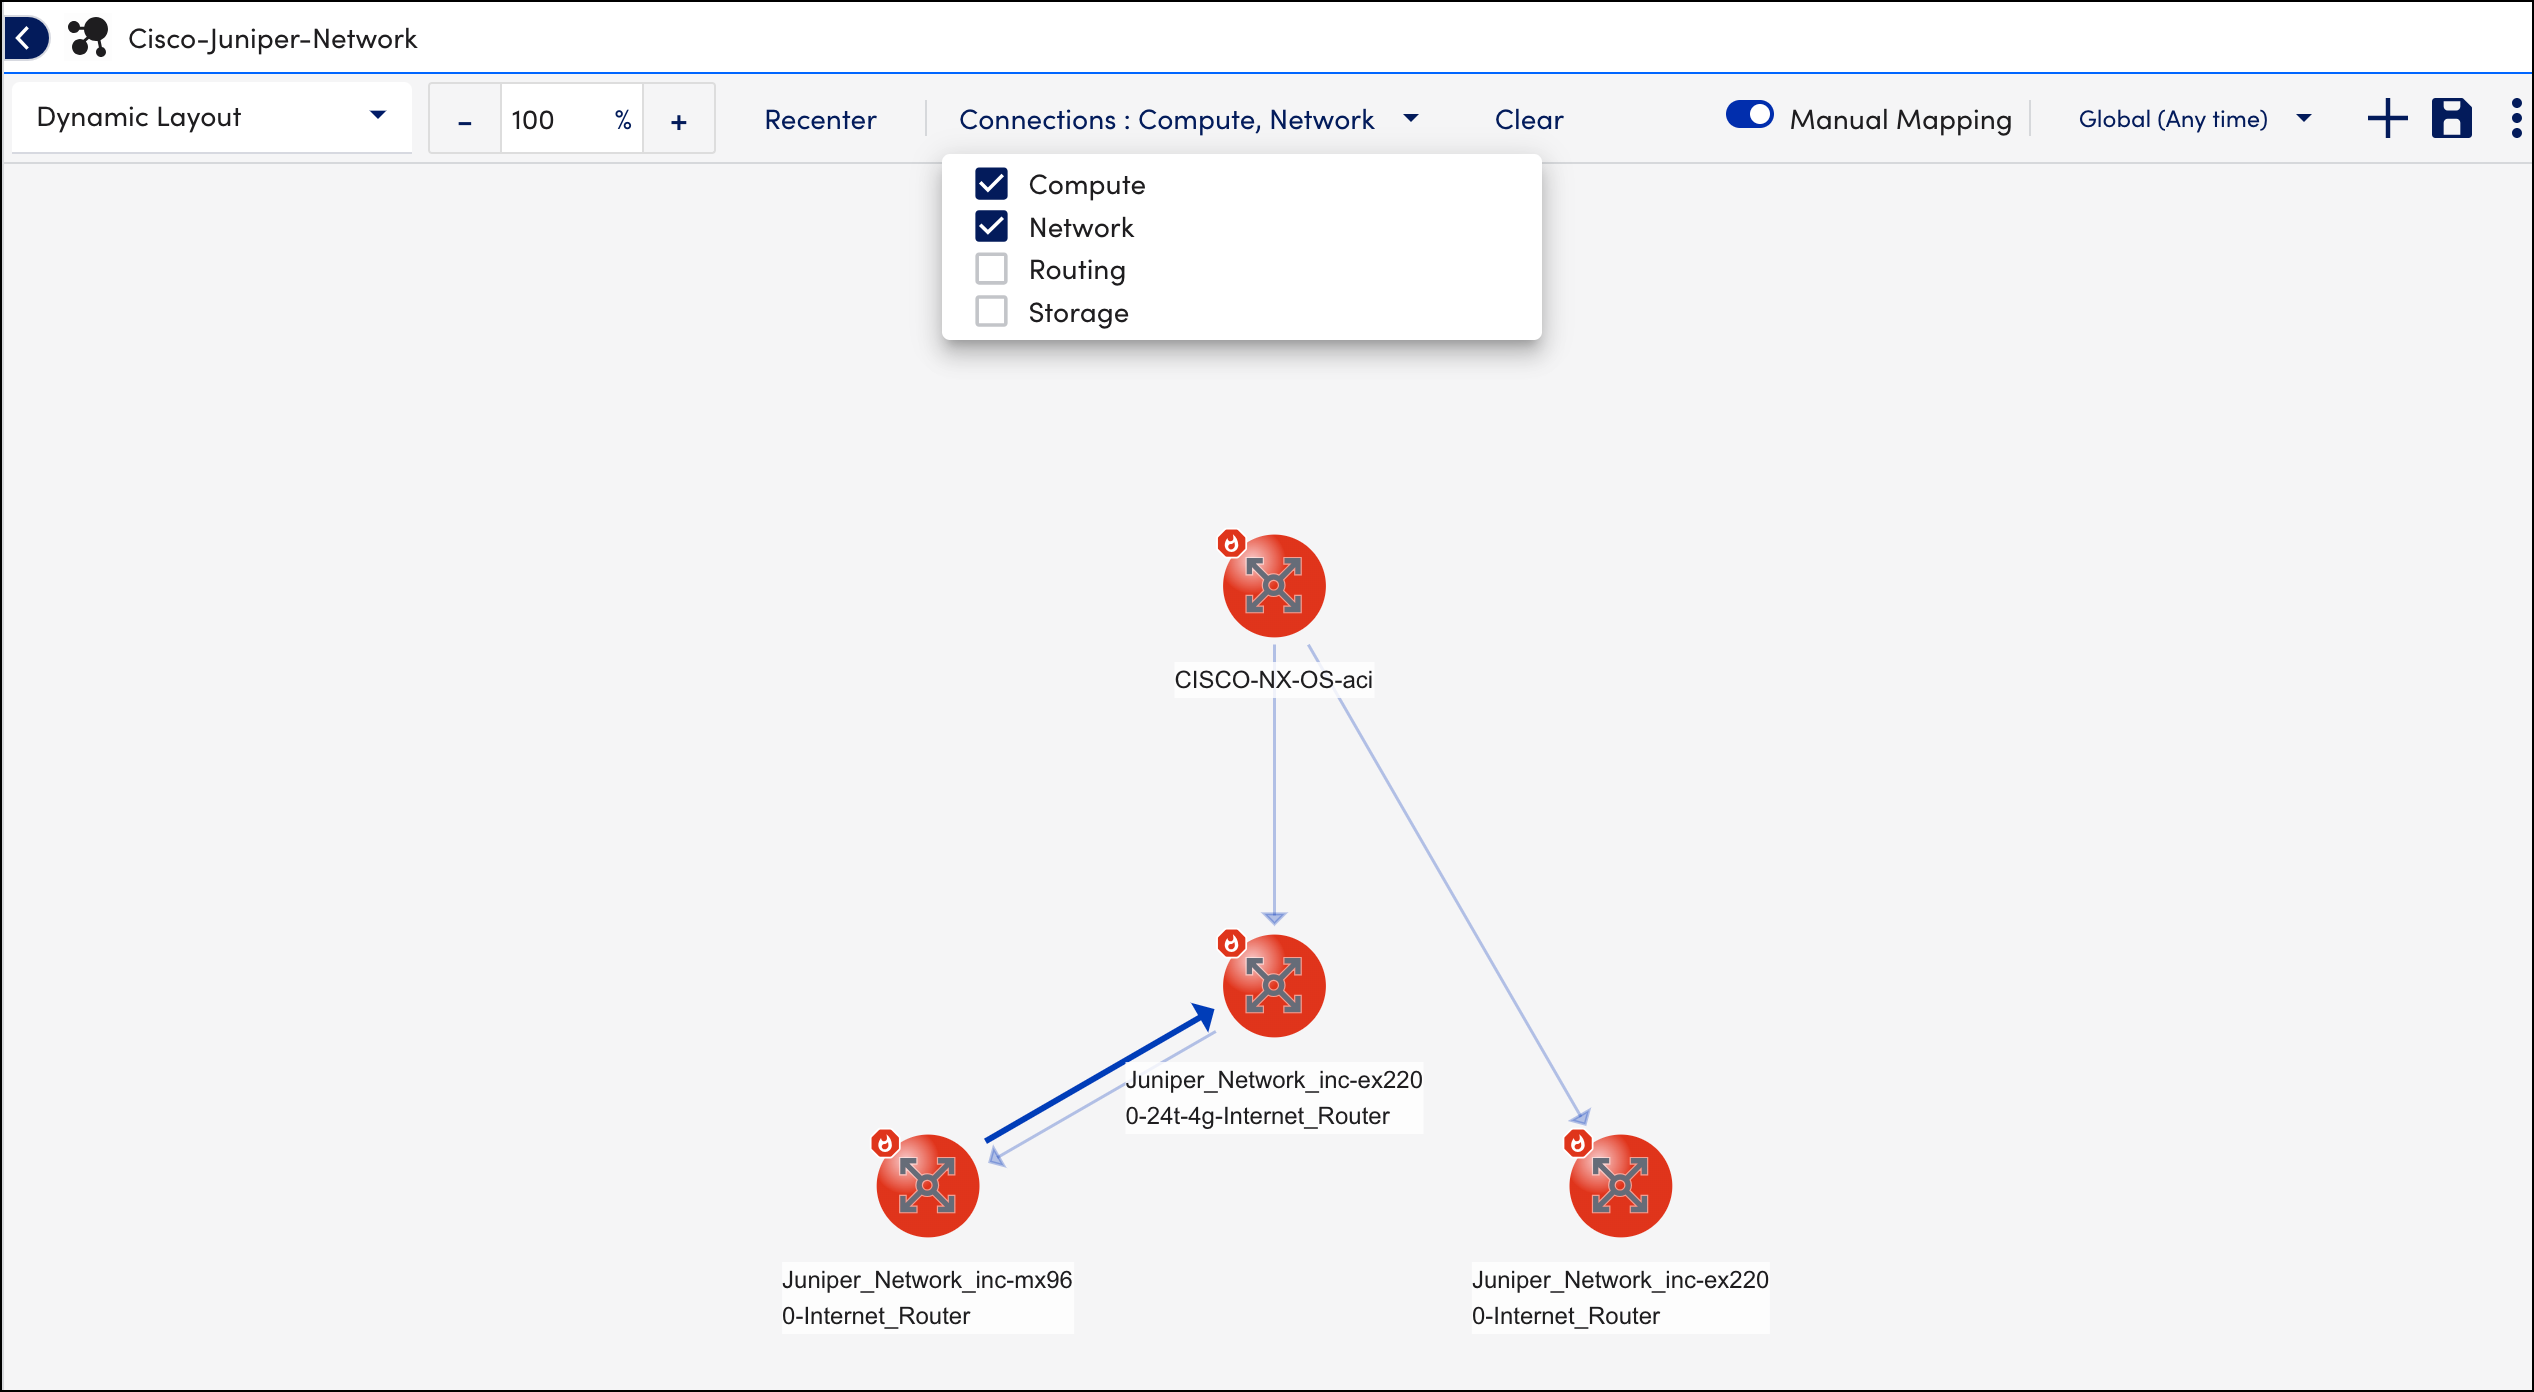
Exporting Map
- In LogicMonitor, navigate to Mappings > Saved Maps > select the required map.
- Select More options and select Export Map.
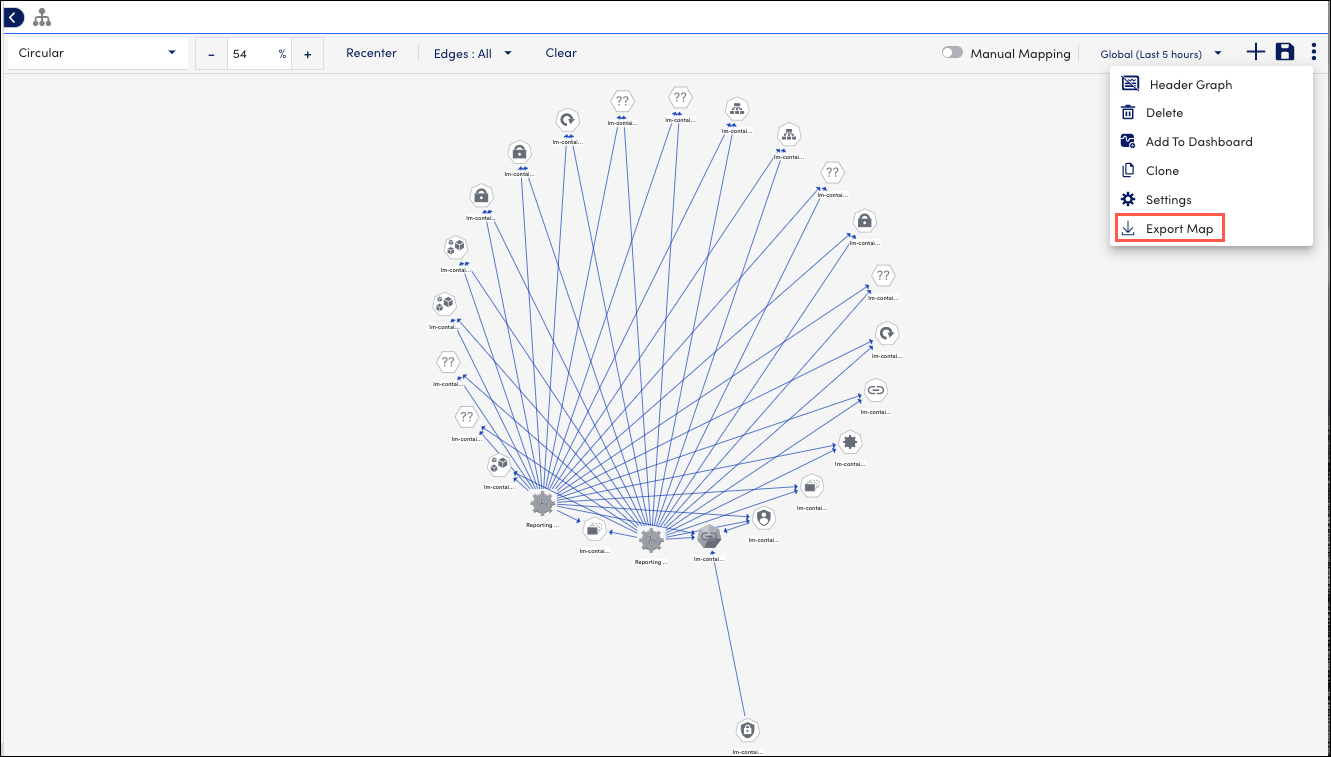
- Select the required export layout.
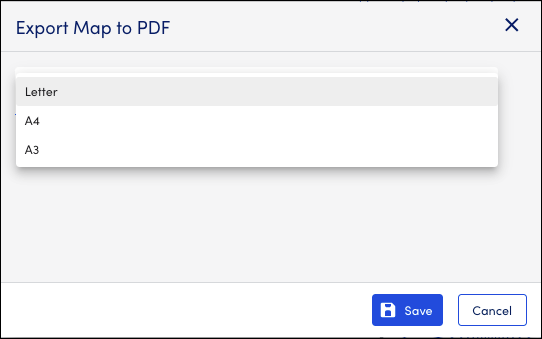
- Select Save.
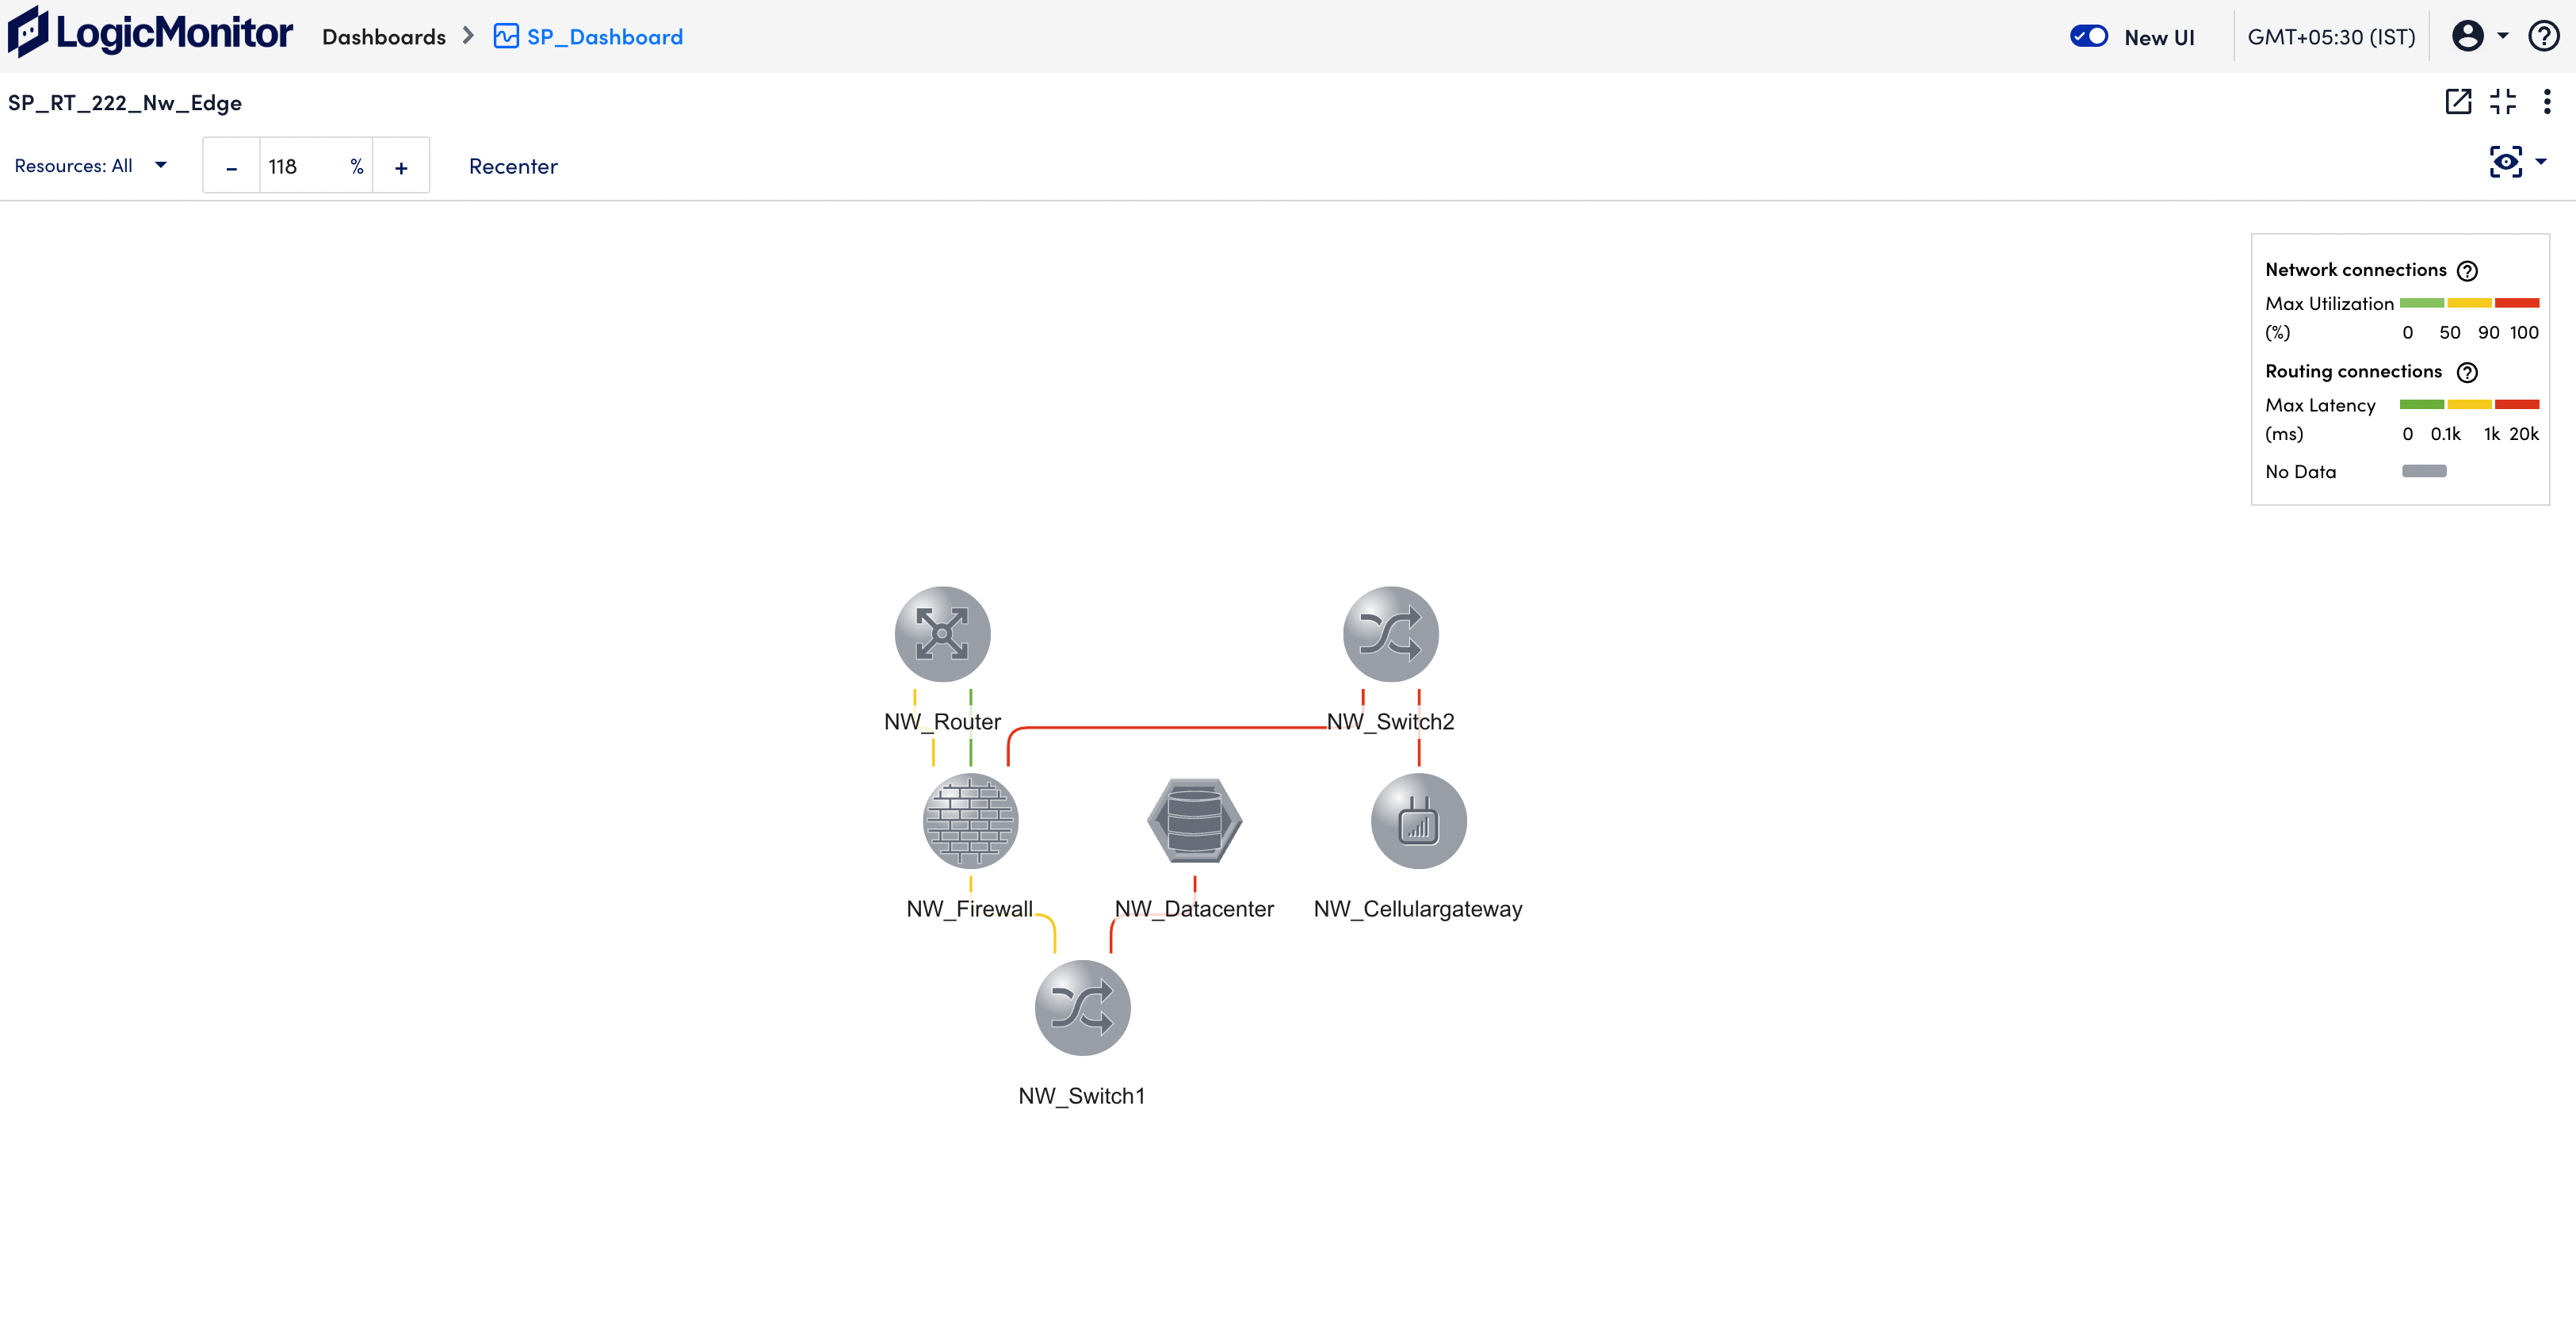
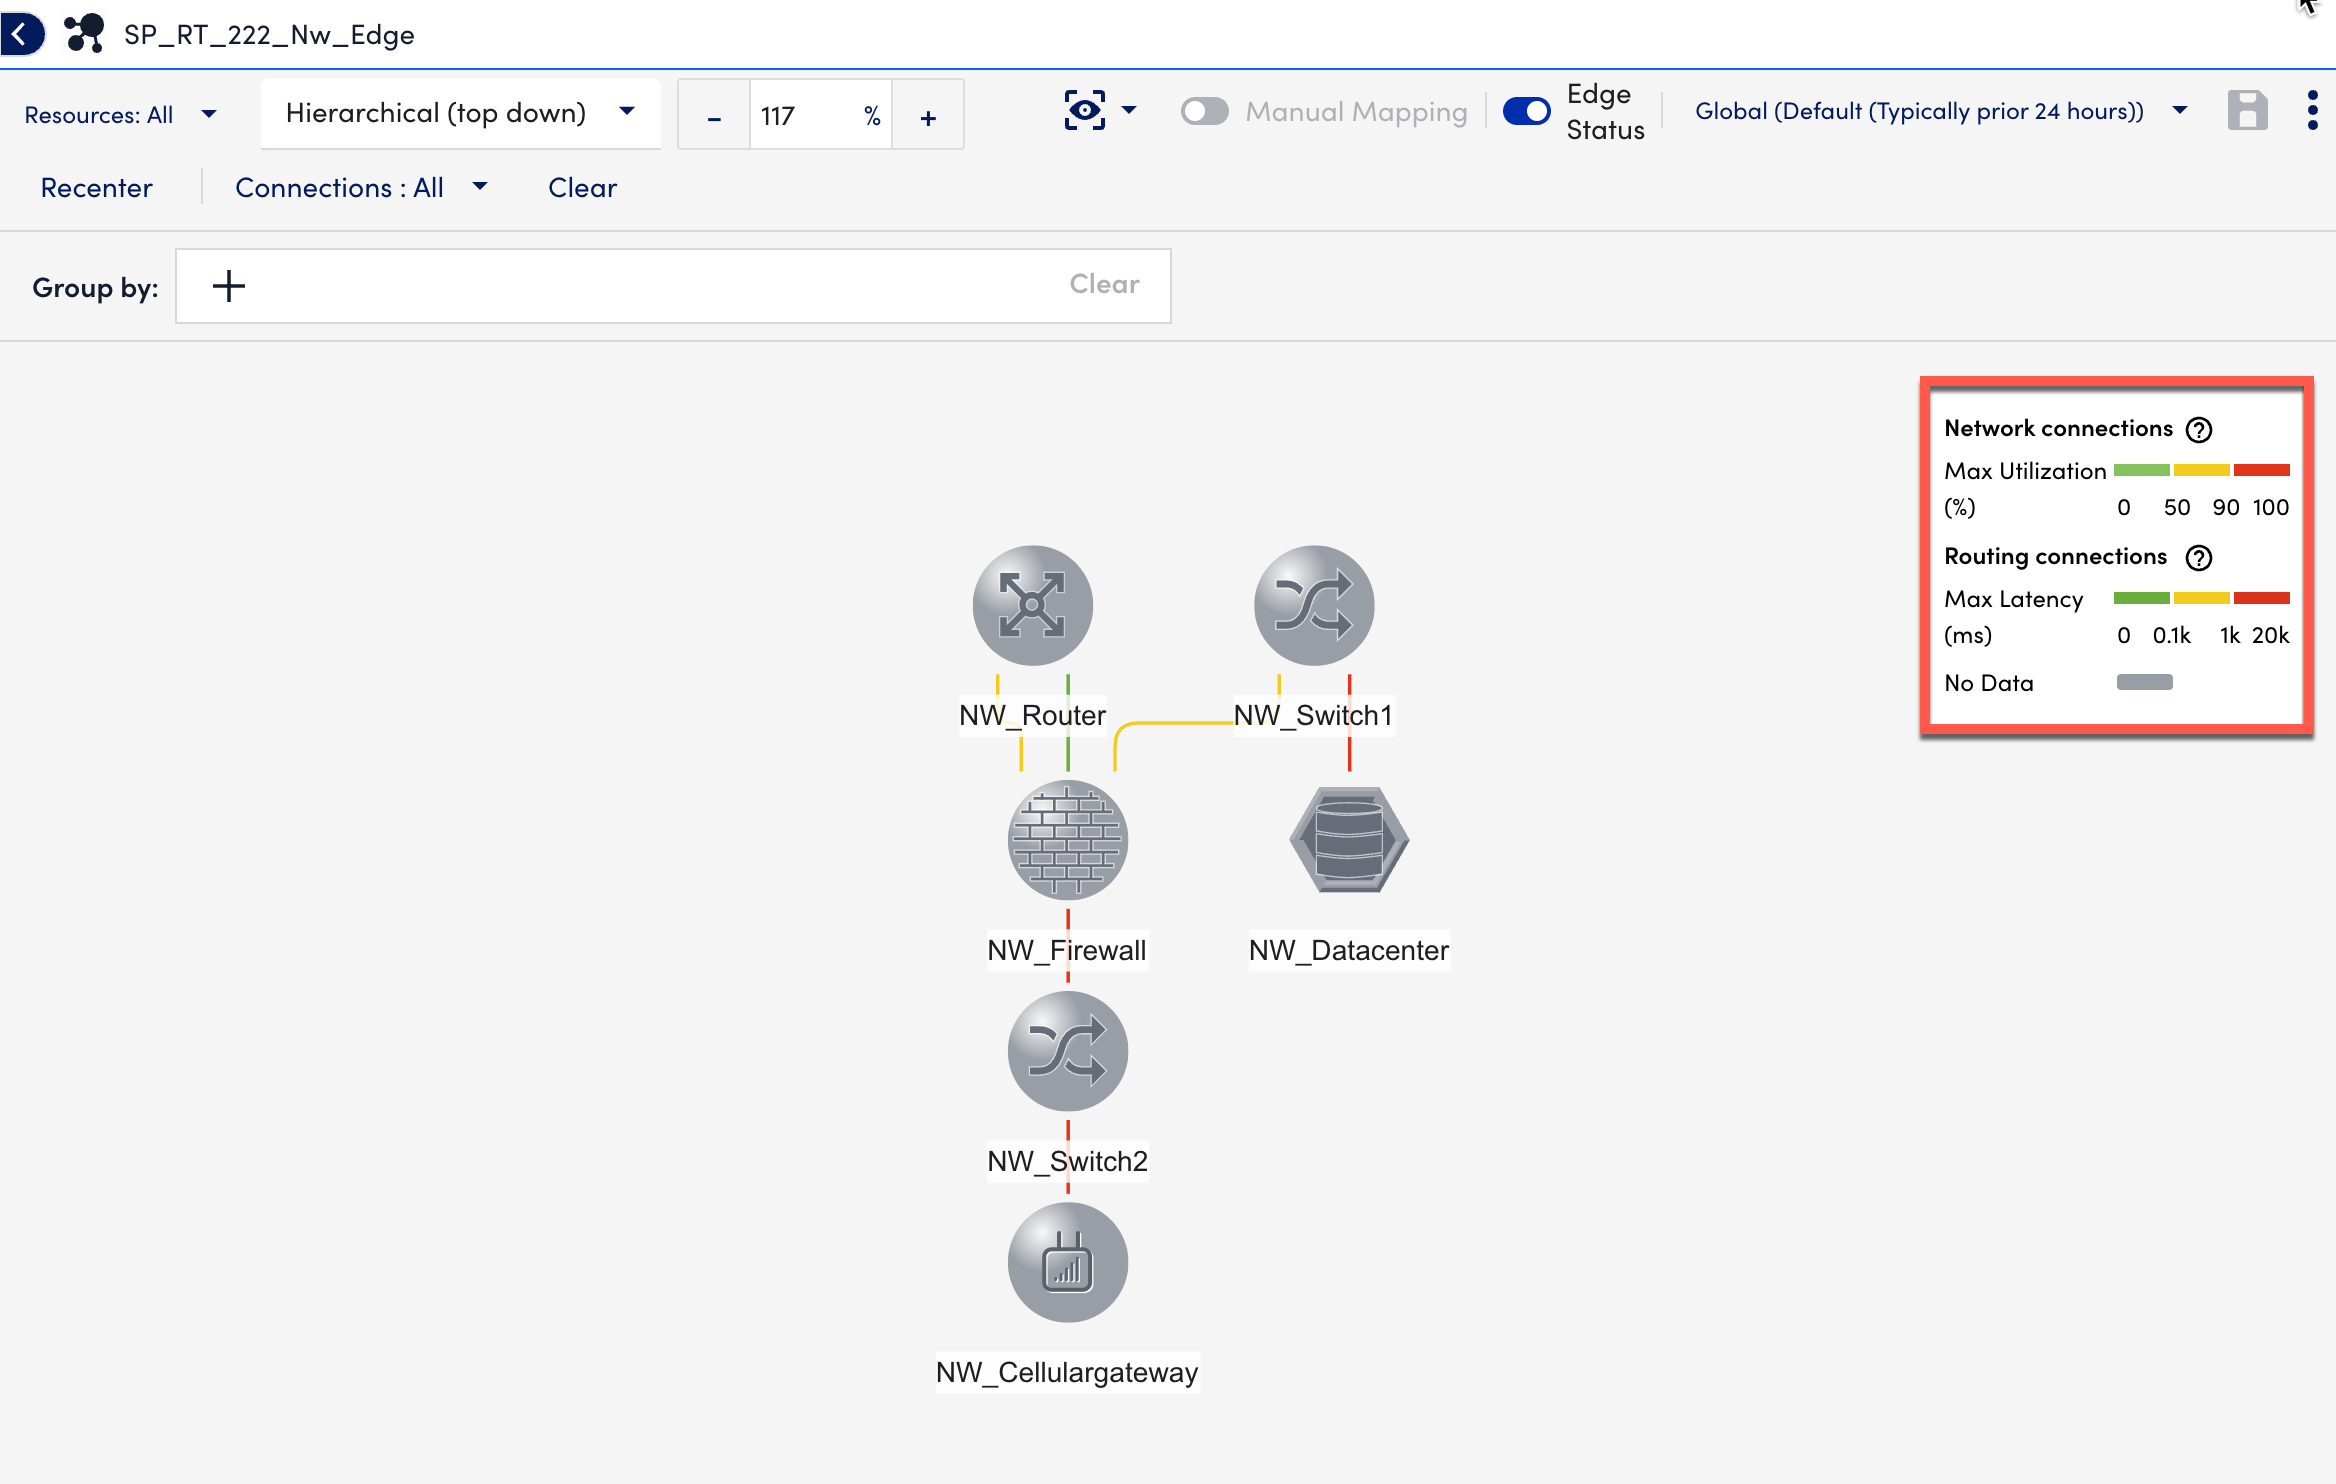
Edge Status
Important: The Edge Status feature is available only for Routing and Network connection types.
Edge Status provides real-time network health insights on the topology map. It displays current latency and utilization metrics on hover and dynamically colors edges based on the performance.
Requirements for Using Edge Status
To use the Edge Status feature, you need the following:
TopoSources
- Cisco_Meraki_Topology
- Aruba_EdgeConnect_SDWAN_Topology
- PaloAlto_PrismaSDWAN_Topology
- Fortinet_FortiGate_SDWAN
- VMware_SDWAN_Topology
- Cisco_Catalyst_SDWAN_Topology
- Networking_L2_snmpSwitch
DataSource
- Cisco_Meraki_SecurityApplianceTunnels
Using Edge Status
1. In LogicMonitor, navigate to Mappings > Saved Maps.
2. Select any saved maps for which you want to see the maps.
You can also create a map manually.
3. Toggle the Edge Status switch to enable the edge status filtering.
4. Upon hovering over a connection on the map, a detailed information box is displayed.
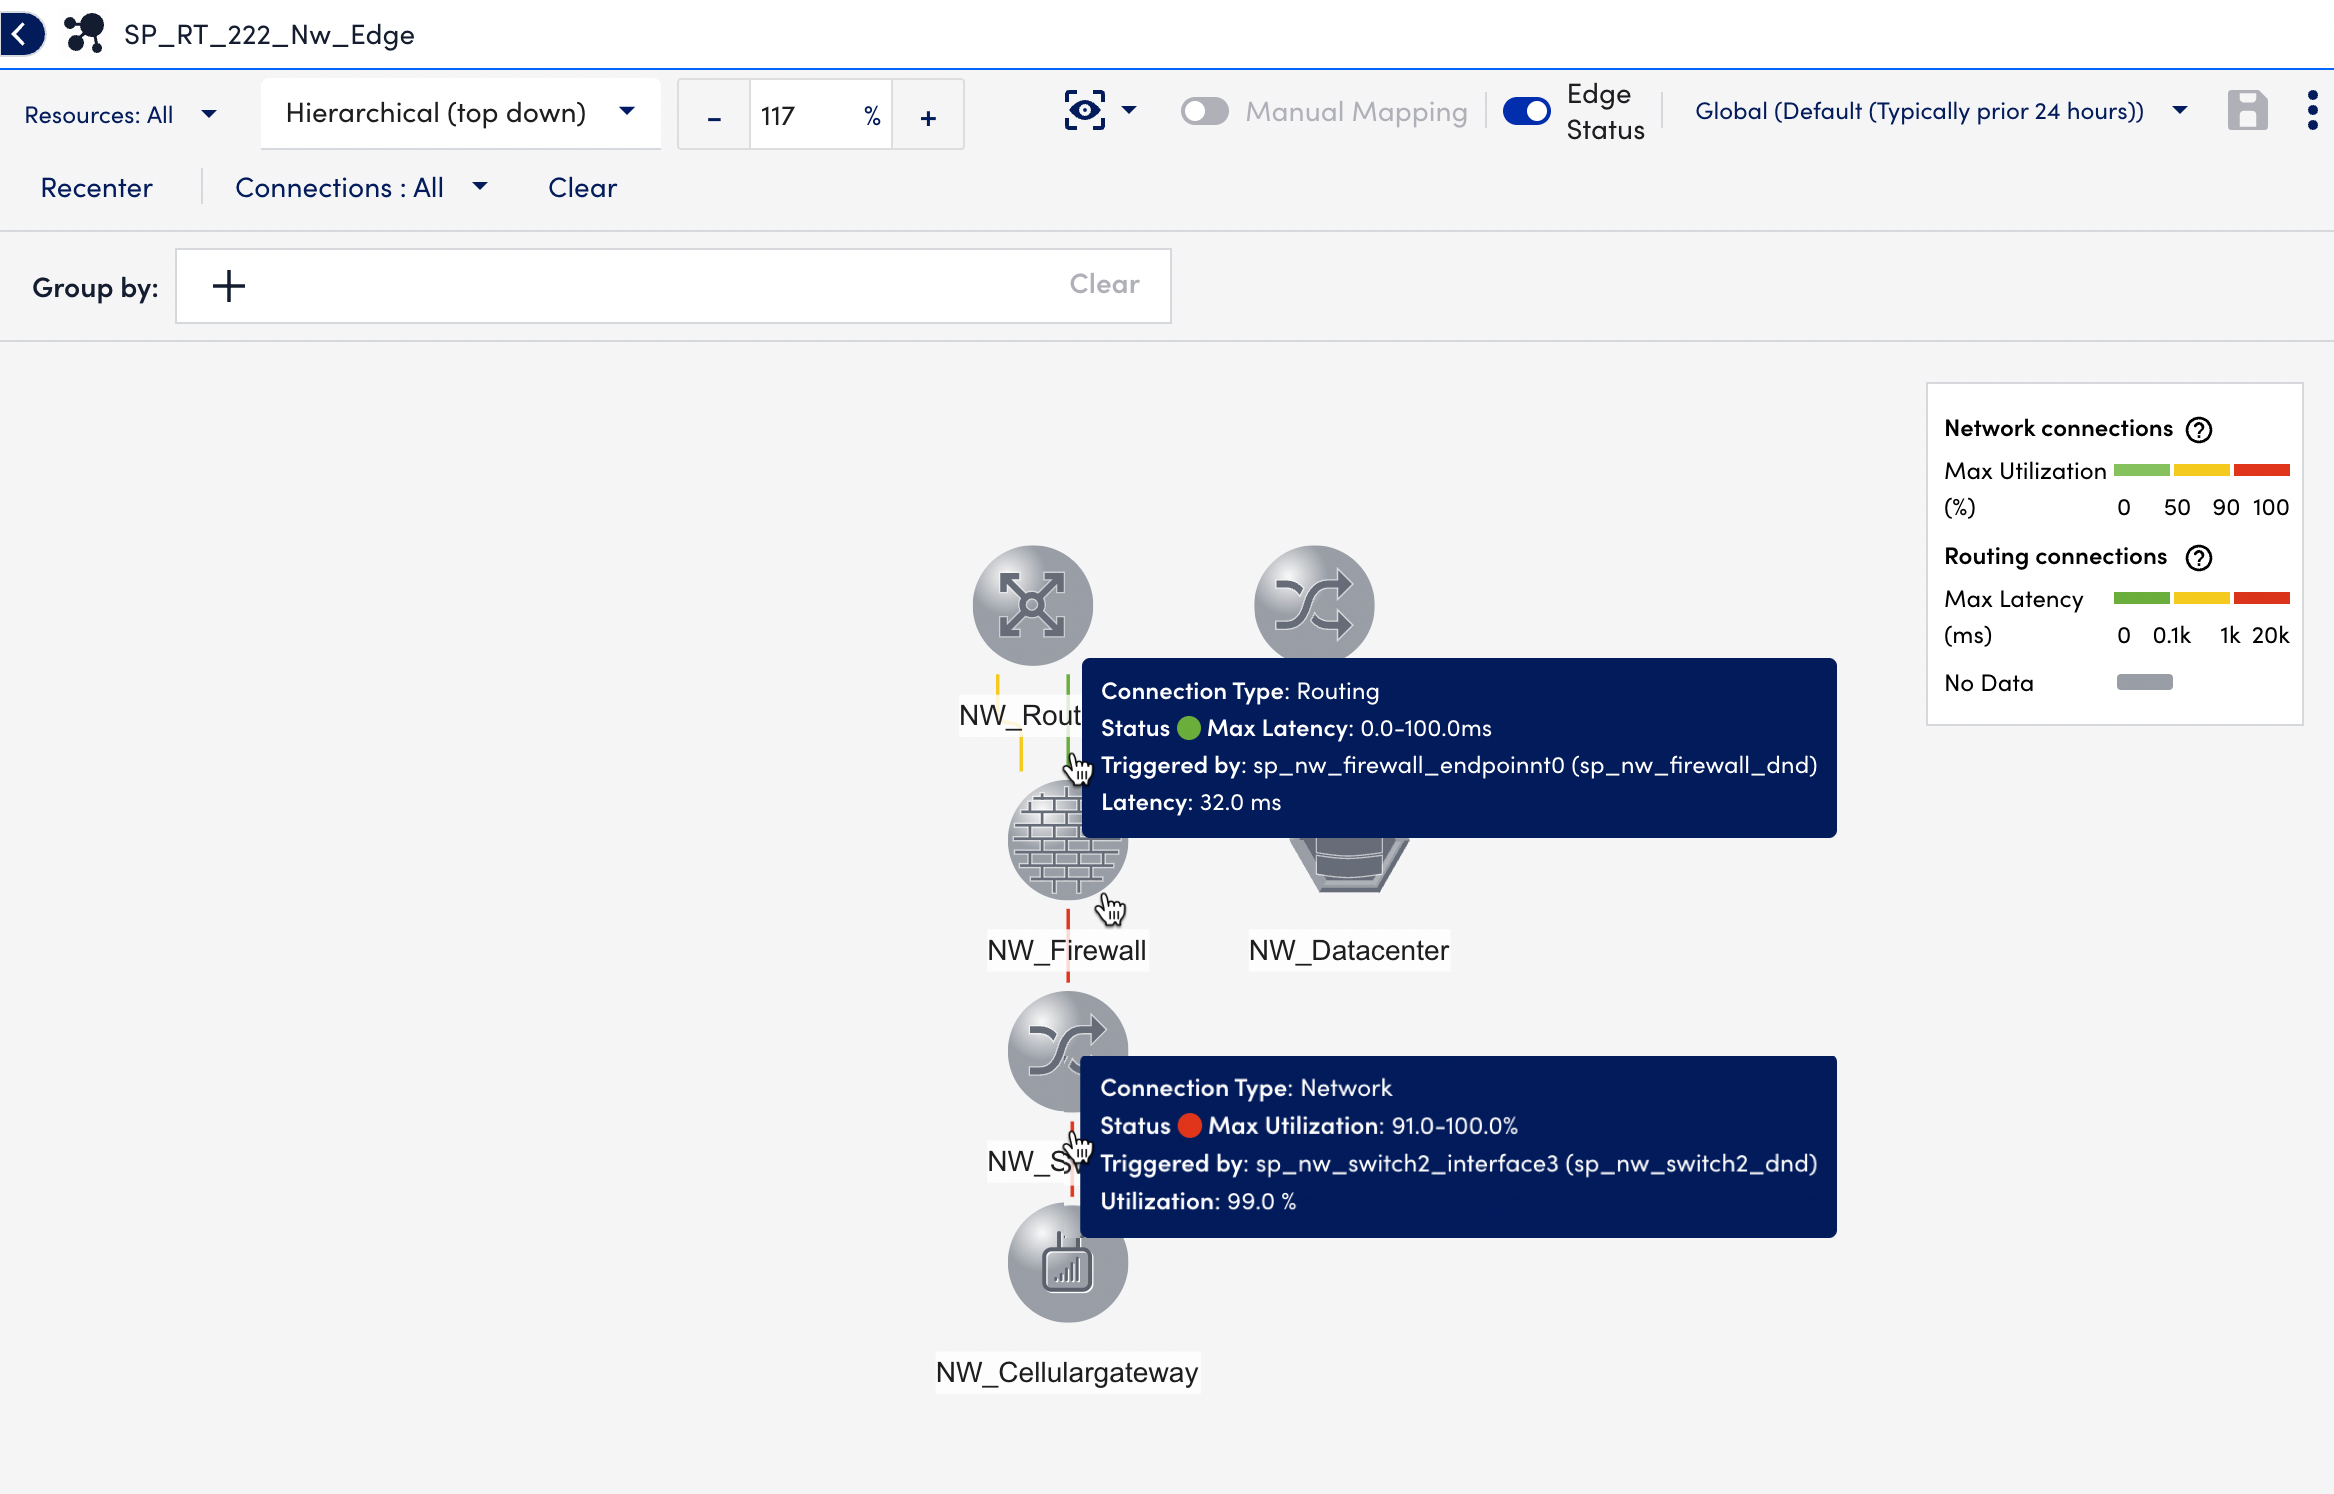
Depending on the connection type, the following information displays:
- Connection Type — Indicates the type of the connection: Routing or Network.
- Status — Displays the maximum latency value for Routing connections and the maximum utilization value for Network connections.
- Triggered by — Displays the name of the instance and resources from which the maximum latency or utilization is generated.
- Latency — Displays the latest latency value for Routing connections and the latest utilization value for Network connections.
5. (Optional) Select the edge to view detailed information in the Connection Details section.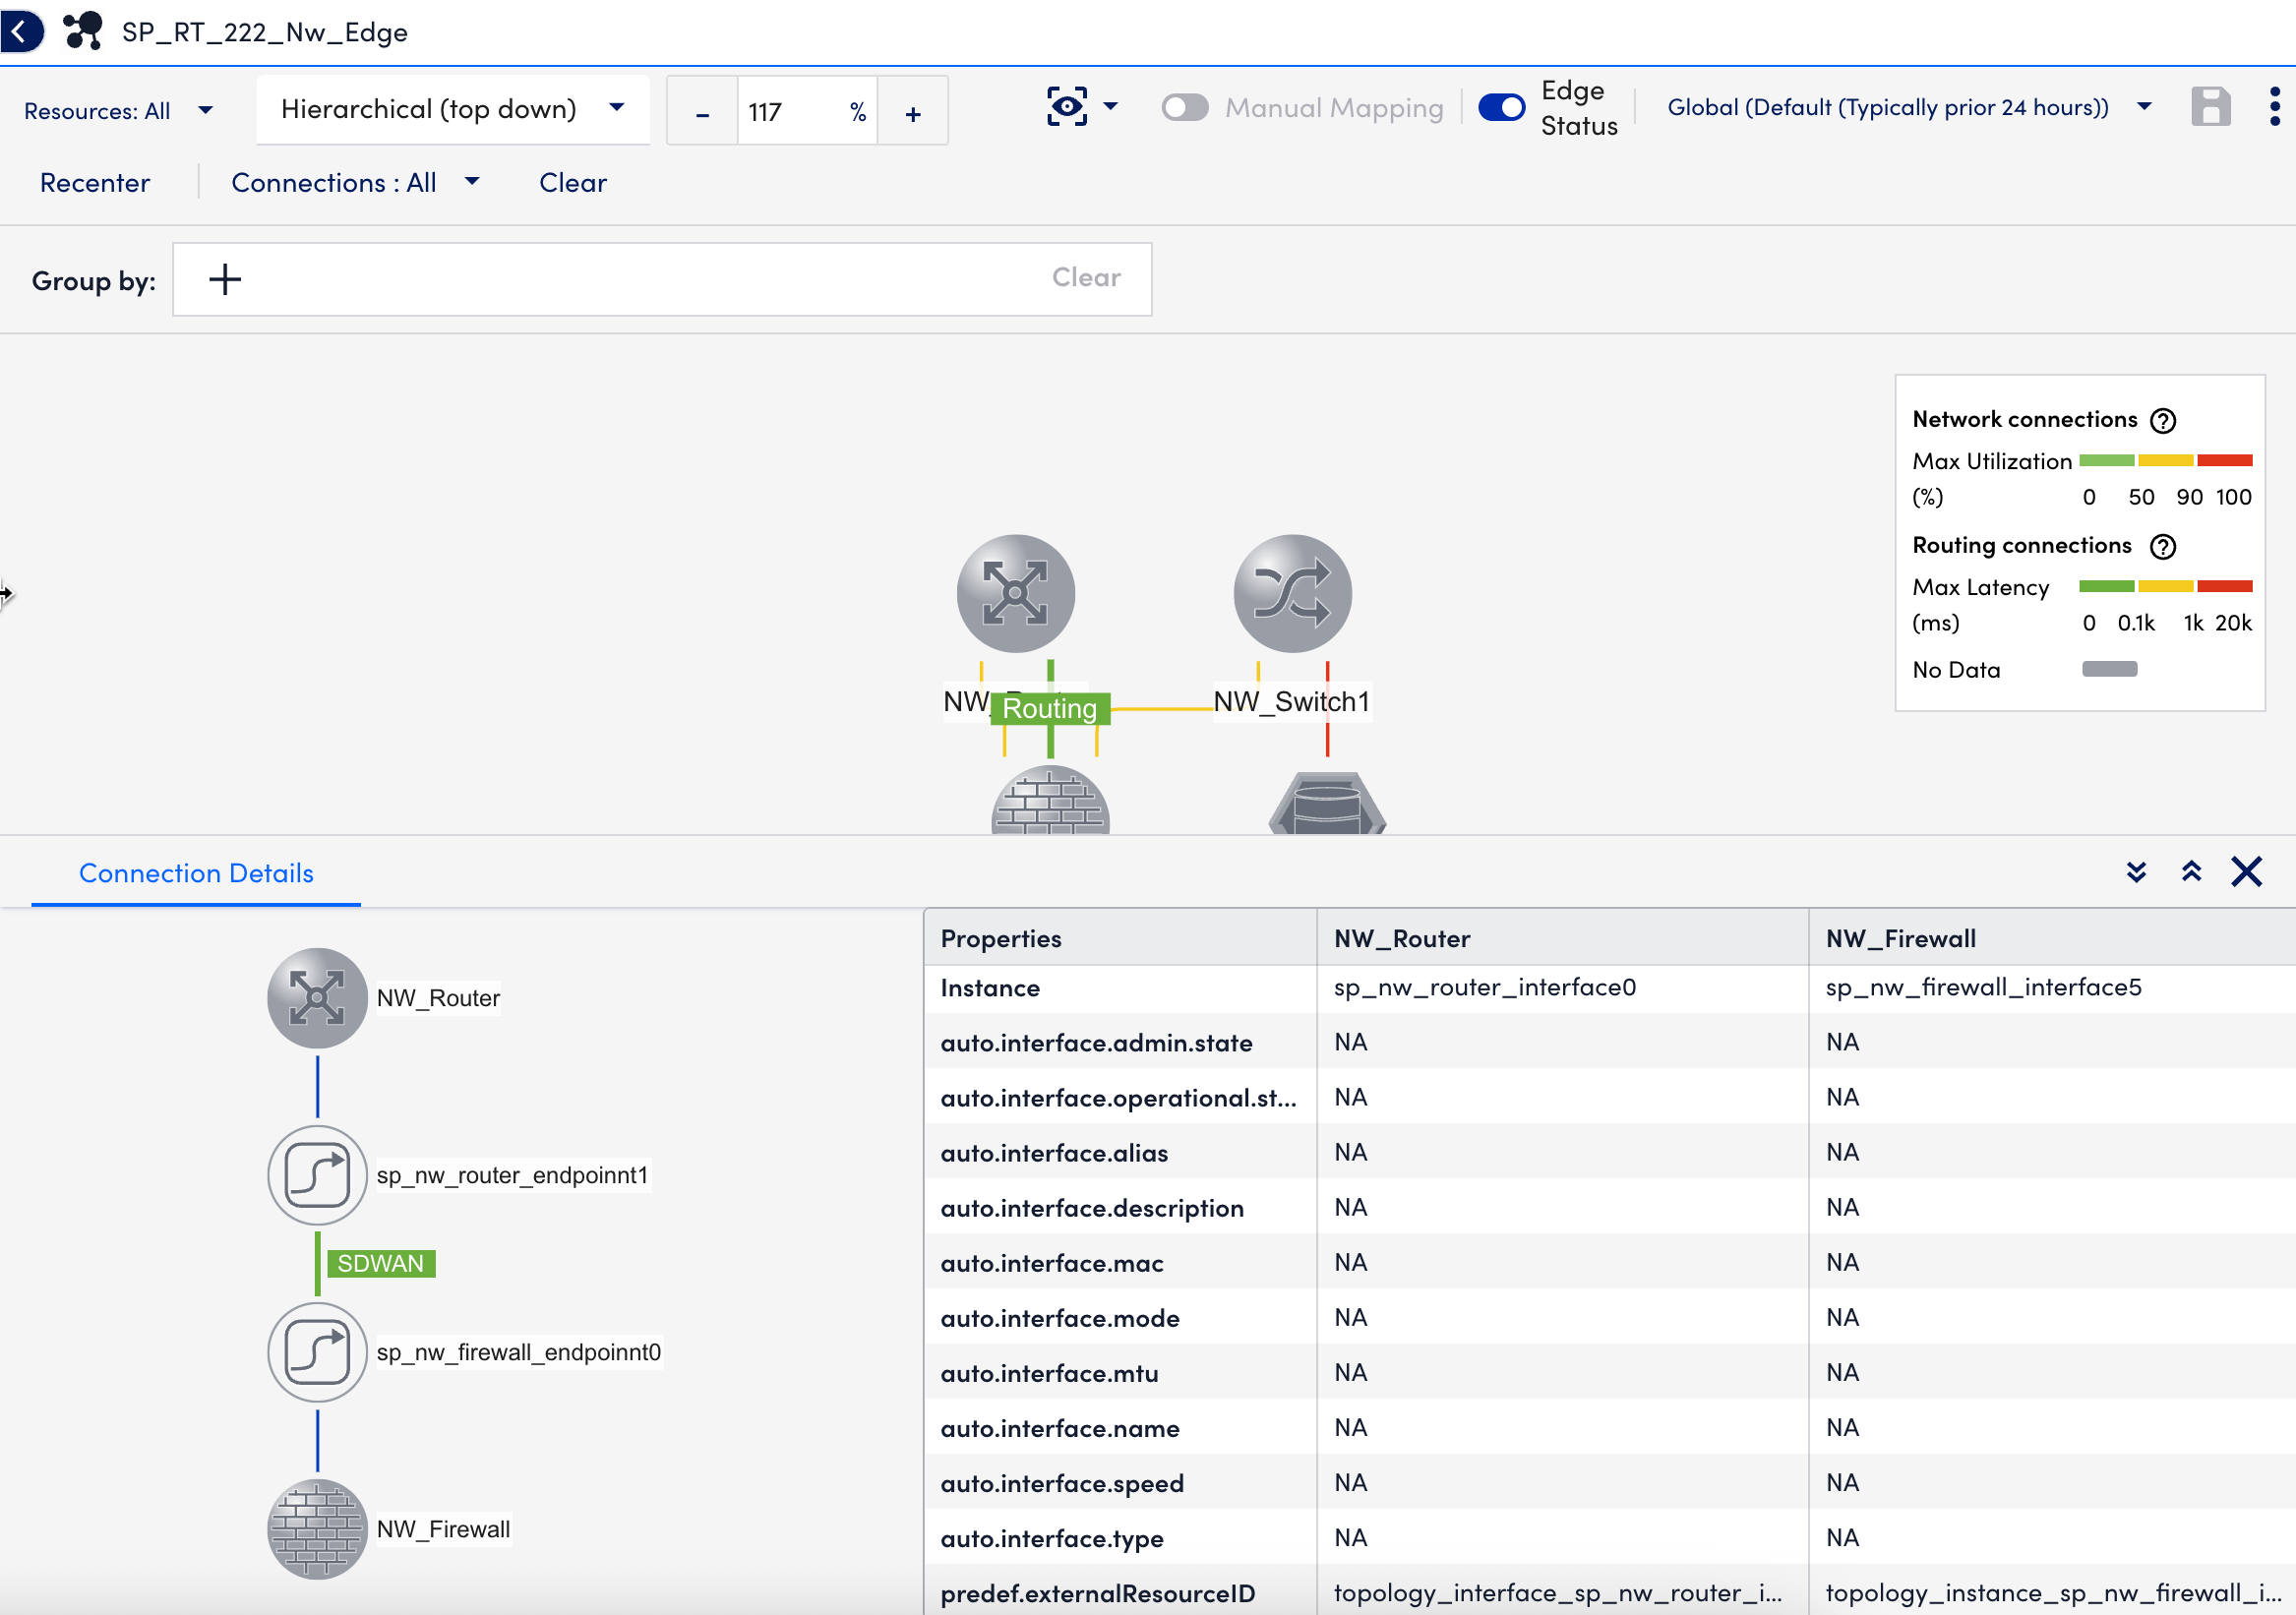
6. Select Save to save the map with the edge status view.
7. To customize connection metrics, select Customize Metrics.
8. In the Network connection panel, do the following:
- Select the Connection metric from the dropdown.
You can either select Utilization or Packet Loss. - Configure high and low threshold values.
- Select status color for the threshold values you have set.
9. In the Routing connection panel, do the following:
- Select the Connection metric from the dropdown.
You can either select Latency or Packet Loss. - Configure high and low threshold values.
- Select status color for the threshold values you have set.

10. Select Save Settings.
The system applies the custom settings and saves the map.
Note: To restores default Network and Routing threshold settings, select Restore Default Values and then select Save Settings.
11. From the More options, select Add To Dashboard to view the map with the Edge Status view in the Dashboard widget.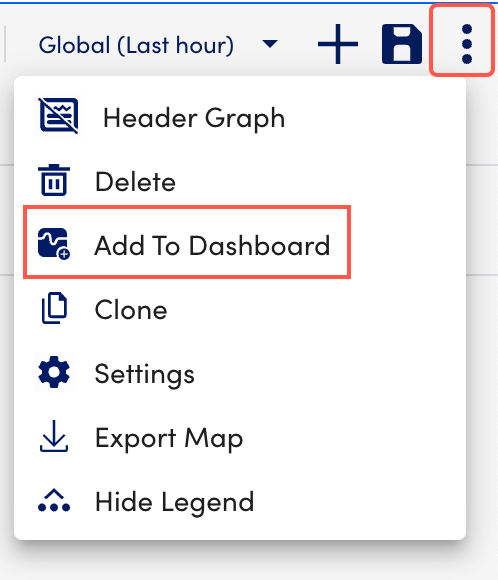
Note: You can navigate to Dashboards to view the Topology Map Widget in the Dashboard.