
Alert Forecast Report
Last updated - 29 May, 2026
You can use the Alert Forecast report type to forecast which datapoints are likely to go into alert in the next 30 days. The Alert Forecast report uses the static thresholds that are set for datapoints and predictive analytics to review the past trends of the datapoints and plot their future trajectories. For more information, see Data Forecasting Visualization.
Configuring an Alert Forecast Report
- In LogicMonitor, navigate to Reports.
- Select
 > Add Report > select Add for the Alert Forecast report.
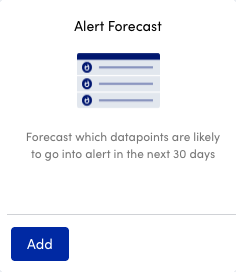
- In the Name field, enter a name for the report.
Report names cannot include the operators and comparison functions used in LogicMonitor’s datapoint expression syntax. - (Optional) In the Description field, enter a description for the report.
For example, you can enter a description of the specific purpose of the report. - From Report Group, select the report group where your report is stored.
Matching groups display as you type, and you can select the group from the list. - From Format, select the type of format for the output of the report.
You can select HTML, PDF, or CSV.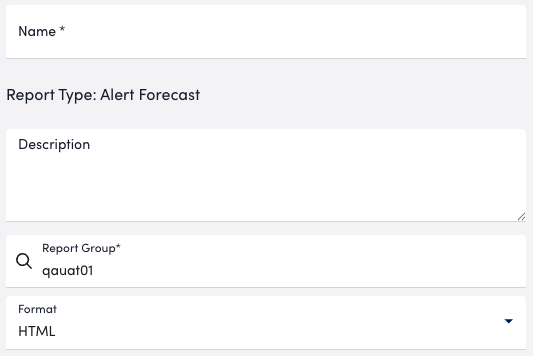
- From the Forecast Method dropdown, do one of the following:
- To display a single straight line that best fits the forecasted data, select “Line of best fit forecast.”Recommendation: Select this option if your datapoints are highly variable.
- To project lines that represent upper and lower bounds and the forecast values, select “95% confidence forecast.”
This option displays a range where LogicMonitor predicts future datapoints values can fall within.
- To display a single straight line that best fits the forecasted data, select “Line of best fit forecast.”
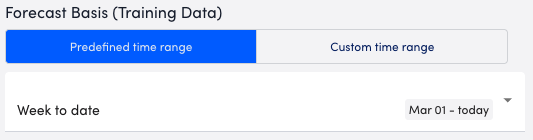
- In the Forecast Basis (Training Data) section, configure the duration of time from which data is analyzed (or trained) to predict future alerts.
You can select from a predefined time range or define a custom time range by doing one of the following:- To configure a predefined time range, select Predefined time range, and then choose a time range option.
- To configure a custom time range, select Custom time range, and configure the time range settings.
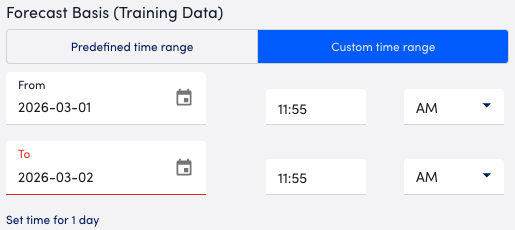
- To configure a predefined time range, select Predefined time range, and then choose a time range option.
- To restrict your report to the data in specified Resource Groups or Resources, do one of the following:
- To restrict the report to the Resources in specific Resource Groups, select Resource group and then enter a group in the Resource Group field. LogicMonitor attempts to match values as you type.
You can use explicit names or glob expressions in this field.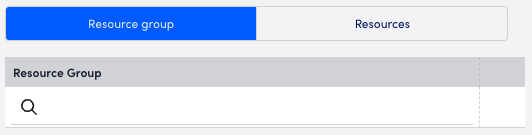
- To restrict the report to specific Resources, select Resources and then enter the name of a Resource in the Resources field. LogicMonitor attempts to match values as you type.
You can use explicit names or glob expressions in this field.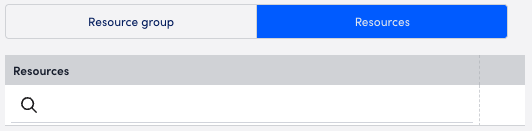
- To restrict the report to the Resources in specific Resource Groups, select Resource group and then enter a group in the Resource Group field. LogicMonitor attempts to match values as you type.
- In the Datapoints section, enter one or more sets of DataSource, Instance, and Datapoint to indicate witch datapoints to include in the report. LogicMonitor attempts to match values as you type.

- (Optional) To limit the number of results displayed in the report, toggle the Top 10 only switch.
- (Optional) Use the Columns settings to configure the columns you want displayed in your report.
You can configure the order the columns display in and whether or not to hide certain columns.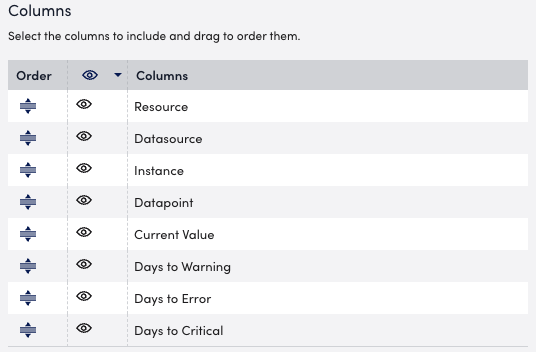
- In the Properties section, select the host properties and group host properties you want to include in the report.
Each property displays as a column header in your report.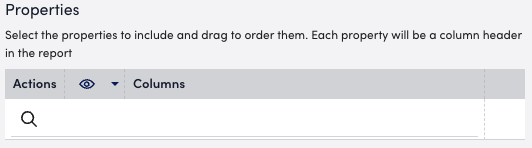
- In the Report Schedule section, do the following to configure the report to generate on a schedule:
- Toggle the Generate this report on a schedule switch.
- From the Frequency dropdown menu, select how frequently you want the report to generate, and then configure when you want the report to generate.
For example, if you configure the report to generate daily, you can choose the time to generate the report each day. If you configure the report to generate weekly, you can choose the day of the week and time to generate the report for the selected date. If you configure the report to generate monthly, you can configure the day of the month and time to generate the report.
Each frequency option provides you a setting for selecting the time zone. - In Recipients Email, enter the name of the user you want to receive the generated report.
LogicMonitor attempts to match values as you type.
The recipients you add to the report are emailed a generated report based on the format you configured and the email associated with the username.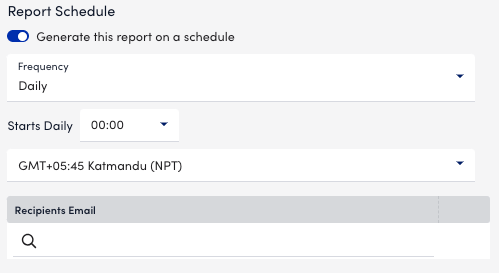 Note: You can include both individual users and recipient groups, and add multiple recipients as needed.
- To save the report, do one of the following:
- To save the report to the Report Group you selected, select Save.
If you configured the report to generate on a schedule, the report generates and sends to recipients based on the frequency you configured. - To save the report to the Report Group you selected and generate a report simultaneously, select Save and Run.
- To save the report to the Report Group you selected, select Save.
Threshold Limits
Adhoc Requests Thresholds (Limit for number of datapoints)
| CSV | HTML | |
| 100 | 100 | 100 |
Scheduled Requests Thresholds
| CSV | HTML | |
| 4000 | 300 | 300 |
